


 Arguments


Recent Comments
Prev 881 882 883 884 885 886 887 888 889 890 891 892 893 894 895 896 Next
Comments 44401 to 44450:
-
mcba at 16:05 PM on 12 June 2013Lu Blames Global Warming on CFCs (Curve Fitting Correlations)
jdixon1980 @68, it doesn't make sense to add up impact factors over a number of journals. Since the impact factor is the number of citations per paper, about all you can do is average the impact factors for IJMP[A-E]
-
OPatrick at 15:31 PM on 12 June 2013UK Secretary of State for the Environment reveals his depth of knowledge of climate change (not!)
This was shocking to listen to and shame on the BBC for setting it up in this way. There was no hope of meaningful debate with Delingpole on the panel so in most people's eyes Owen Paterson probably got away with his extreme views on climate change by virtue of sounding reasonable in comparison to him.
I hope this gets picked up and Owen Paterson is held to account for his words. I'll be contacting my (Conservative) MP to express my concern, particularly as he's just sent me a letter reassuring me that they are still working hard at being the 'greenest government ever'. Ha!
-
yocta at 13:23 PM on 12 June 2013A Miss by Myles: Why Professor Allen is wrong to think carbon capture and storage will solve the climate crisis
I work in research and development in the CCS industry. The claim by Myles Allen that a priority to invest in this field is wrong at the expense of others.
Most researchers I know and have met would agree on those points.
However, a significant portion of my peers are very pesimistic about humanity and giving up its love of coal. I would not agree with comments that it is soley a political spin. Many of my peers got into the research in order to make developments, or, knock it down, but with scientific scrutiny.
A significant overhead is on the investment in technology, and so an active role is on CO2 reuse technology with an aim to lower the cost of CCS technology. Examples include enhanced oil recovery, and enhanced coalbed methane.
CCS does have the potential to work. It is expensive (perhaps up to 20% of a power station's running cost) but that doesn't mean we should stop researching it.
I think it comes down to perspective, on what the best solution is at the time.
-
Ken in Oz at 10:35 AM on 12 June 2013A Miss by Myles: Why Professor Allen is wrong to think carbon capture and storage will solve the climate crisis
I think the true role of CCS so far has been as political spin, that encourages the view that we can keep on burning fossil fuels because 'soon' the emissions will be able to be sequestered. I still recall then Australian Prime Minister Kevin Rudd addressing the UN and urging the world to develop working CCS, and recall thinking that what he really meant was that Australia would never stop digging up and selling coal to the world, so the world had better make CCS work. He may have been genuinely convinced of it's viability, but I struggle to see how it can ever be cost effective, even for those power plants that have the good fortune to sit on top of suitable geology.
I have serious reservations about CCS, starting with simple arithmatic; for every ton of quality coal burned there will be in excess of 3 tons of CO2 given off, all taking specialised plant and heavy energy usage to deal with. The kinds of deep drilling needed would IMO be much better used developing geothermal energy sources - probably less drilling required for that than for CO2 sequestration.
-
scaddenp at 09:30 AM on 12 June 2013An estimate of the consensus project paper search coverage
Consensus is not a measure of scientific validity but is the only rational basis for determining policy.
-
scaddenp at 09:25 AM on 12 June 2013A Miss by Myles: Why Professor Allen is wrong to think carbon capture and storage will solve the climate crisis
Phil, I would think that market forces would push electricity generation towards non-carbon resources. That said, coal is far more damaging than petroleum - we have so much more of it for a start. A move to oil instead of coal would be limited by production capacity within the oil industry. A move to gas instead of coal is probably an improvement. For many parts of the world though, electricity generation from non-carbon means would get a big boost. Will we pay more in the end? Up front - probably. The problem with the current price we pay for energy is that it doesnt include the external costs from climate change (and probably quite a few other costs in many parts of the world).
-
jdixon1980 at 08:06 AM on 12 June 2013Lu Blames Global Warming on CFCs (Curve Fitting Correlations)
John0001 @69, yeah, I think that's why Dana made only a passing reference to the impact factor, musing as to a possible explanation of why the article passed peer review despite its low merit, which is addressed in the rest of the post. I was just curious as to what an "impact factor" even is, how much lower this journal's was compared to others, etc., and thought I might save other curious individuals like me some legwork.
-
Tom Curtis at 08:06 AM on 12 June 2013An estimate of the consensus project paper search coverage
william @4, maladapted @5, the argument that there is a concensus of climate scientists that AGW is happening has not been used by SkS, and should not be used to anyone. The argument used by SkS is simply that fake "skeptics" claim that there is no consensus, but on the contrary, evidence shows that there is. In turn, the claim by fake "skeptics" that there is no consensus is used as the premise in a number of invalid arguments such as - "There is no consensus, therefore there is reasonable scientific doubt about AGW", and "There is no consensus, therefore both sides of the evidence should be presented equally to the public", and "There is no consensus, therefore it is too soon to initiate any policy on climate change".
-
kar at 07:34 AM on 12 June 2013There's no empirical evidence
I have a couple of suggestions/questions about the text:
What about changing:
Figure 3: Spectrum of the greenhouse radiation measured at the surface. Greenhouse effect from water vapor is filtered out, showing the contributions of other greenhouse gases (Evans 2006).
To:
Figure 3: Spectrum of the greenhouse radiation messured at the surface. Greenhouse effect from water vapor is filtered out but showing the contributions of other more evenly distributed greenhouse gases (Evans 2006).
Something is missing at questionmark between figure 4 and 5:
... accumulate heat to the end of 2008 at a rate of 0.77 ± 0.11 Wm?2
-
Mal Adapted at 07:10 AM on 12 June 2013An estimate of the consensus project paper search coverage
William:
To use consensus to justify any scientific position is to stand on very shaky ground. We should abandon this argument. The evidence is very strong and speaks for itself. If the consensus was that climate change is nonsense, would this make it any more true.
The existence of the scientific consensus on AGW is not being used to justify the position to other climate scientists. It's being used to make it clear to members of lay public, who don't have the skills and knowledge to understand the evidence directly, that there really isn't a debate still going on about AGW within the community of experts, contrary to the insistence of the deniers.
Genuine skeptics who are not themselves experts on climate science will acknowledge and respect the judgement of those who are. On another thread I linked to the text of a talk by Texas State Climatologist John Nielsen-Gammon at last year's AGU meeting, titled Scientific Meta-Literacy, I think it's germane to your comment as well.
-
Don9000 at 04:51 AM on 12 June 2013A Miss by Myles: Why Professor Allen is wrong to think carbon capture and storage will solve the climate crisis
I agree with MarkR. Choosing the sequestration option as Professor Allen has done makes complete sense if we accept his argument's starting point: he is suggesting that humanity is incapable of not burning the carbon fuels that are causing the problem. In that scenario, sequestration is the only option left if we want to hold down the impact of burning all that carbon-based fuel.
Beyond the likelihood that sequestration, if chosen as the only solution, would prove to have serious limitations, I think there are two more pressing and daunting problems with Allen's approach.
First, it is unlikely to actually happen. For example, I seriously doubt that in the present political climate here in the US that there is any realistic chance that Congress could set us off on the carbon sequestration path in any meaningful way in the next several years. I'm sure many other countries would face similar obstacles in implementing such a fundamental course shift, and I doubt it would happen on a global basis in the time frame and on the scale necessary.
Allen's approach is also dangerous because if sequestration did gain political credence as a "silver bullet," the process of implementing it would give those opposed to taking real action a convenient excuse for delaying other possible solutions, since after the legislative sturm und drang we'd probably end up with a rather anemic array of "model" solutions that those opposed to systemic change would strum their political lyres over for ten or twenty years while the world continued to warm.
-
Phil at 04:32 AM on 12 June 2013A Miss by Myles: Why Professor Allen is wrong to think carbon capture and storage will solve the climate crisis
I'm somewhat confused by the information conveyed by prices. I would expect an extra cost on electricity generation by mandating CCS would push the market towards petrol burning cars, space heating by oil and gas rather than electricity and use of local oil generators to (illegally?) produce electricity. Perhaps Allen consider this to be insignificant ?
-
John0001 at 04:31 AM on 12 June 2013Lu Blames Global Warming on CFCs (Curve Fitting Correlations)
A strong argument.
But should we pay more attention to Lu's Physics Reports (2010)? Phys Rep has an impact factor of 20.574, whereas he did nothing more than a random correlation in that paper!
It might be an open question to target the impact factor, because some stupid scientists have pointed this out:
http://news.sciencemag.org/scienceinsider/2013/05/call-to-abandon-journal-impact-f.html
We should focus on the point that Qing-Bin Lu is not a climate scientist at all; he knows nothing about global warming! Far enough.
-
soo doh nim at 04:30 AM on 12 June 20132013 SkS Weekly Digest #23
Thanks, guys. I debate these things in other forums and can use all the ammo I can get. Thanks again!
-
william5331 at 03:27 AM on 12 June 2013An estimate of the consensus project paper search coverage
To use consensus to justify any scientific position is to stand on very shaky ground. We should abandon this argument. The evidence is very strong and speaks for itself. If the consensus was that climate change is nonsense, would this make it any more true.
-
KR at 03:00 AM on 12 June 20132013 SkS Weekly Digest #23
soo doh nim - Add in the fact that the satellite line in Christys graph appears to be the average of the RSS (~0.09C/decade, not inconsistent with model results) and UAH (~0.03C/decade) TMT data - the UAH data as produced by Christy and Spencer is a clear outlier.
This factor of 3x difference was, I'll note, not discussed by Spencer in his presentation.
Quite frankly, the outlandish accusations accompanying Spencer's blogging of Christy's graph say it all: with claims of the mainstream having "willingly ignored the evidence", "their willful blindness", and complaints that "scientists who still believe that climate change can also be naturally forced have been virtually cut out of funding and publication by the ‘humans-cause-everything-bad-that-happens’ juggernaut", Spencer is showing classic signs of denial. See Characteristics of global warming consensus denial #5, Conspiracy Theories.
-
jdixon1980 at 01:40 AM on 12 June 2013Lu Blames Global Warming on CFCs (Curve Fitting Correlations)
I was curious about Dana's reference to the "impact factor" (for people like me who need that explained, it is a measure of average number of citations to articles in the journal over some unit of time, probably a year?) of the journal that published Lu's article. The title of the journal itslelf is not mentioned in Dana's post - it is apparently the International Journal of Modern Physics B: Condensed Matter Physics; Statistical Physics; Applied Physics. Indeed, its impact factor of 0.361 is by far the lowest, being the only one below 0.591. Arguably, comparing the impact factor of a branch of a journal subdivided by topics to that of another entire journal is not a fair apples-to-apples comparison. However, a quick scan reveals that there are a few other journals or branches of journals directed to statistical physics (I assume that is where Lu fits into IJMP B), each having a significantly larger impact factor: Journal of Statistical Physics (1.397), Physica A: Statistical Mechanics and its Applications (1.374), Physical Review E: Statistical, Nonlinear and Soft Matter Physics (2.255).
As another type of comparison, the impact factors of the entire IJMP added up (4.1) seems to put it more or less into a well-populated second-tier of journals, not remarkably tiny, but far behind some of the leading journals (it looks like there are six of them with impact factors ranging from 10 to 40+).
A modest pedigree that I wouldn't be inclined to think impugns the credibility of the article by itself, but certainly not one that is proportional to the media attention the article received, or that would tend to suggest the article was thoroughly vetted by climate experts.
-
Lou Grinzo at 01:25 AM on 12 June 2013A Miss by Myles: Why Professor Allen is wrong to think carbon capture and storage will solve the climate crisis
While I think this is a very good summary of and response to Myles' position, there's an aspect of CCS that I don't think gets nearly the attention it deserves: The dichotomy between adding it to new power plants vs. retrofitting it onto old plants.
The former has more than enough hurdles we have to clear before it can be a useful contributor in our efforts to reduce GHG emissions, but the latter is truly a nightmare. Existing plants were designed and located without CCS in mind, making the complete process very expensive. I think this is largely why coal companies are so enthralled with CCS: They know that any carbon restriction that forces power plants to embrace CCS will also force them to abandon many existing plants long before their expected service lifetimes expired. Coal would be particularly hard hit, with some related industries, most notably railroads, also feeling big impacts.
-
KR at 00:57 AM on 12 June 20132013 SkS Weekly Digest #23
soo doh nim - As Rob said, Glenn Tamblyns (and Joel Shores) comments are an excellent analysis of that particular mess.
The set of models Christy ran were for "Mid-Troposphere" using one of the highest IPCC emission projections (i.e., the top end of the model range), compared to the satellite TMT signals (with known stratospheric cooling components) meaning that that graph isn't even comparing the same atmospheric components. Nor have they sourced the radiosonde data - radiosondes and their reanalyses are an ongoing topic of evaluation. A more appropriate comparison is probably between those model outputs (with realistic emissions) and the UAH TLT or RSS TTT products; and it's noteworthy that if you compare apples and apples there is far less difference.
Spencer (and Christy) also fail to mention that satellite data has long been suspected of a cool bias, for example as per Chedley 2012 "UAH has a significant bias that reduces the midtropospheric trend", or Chedley and Fu 2012, who state that:
The analysis reveals that the UAH TMT product has a positive bias [...] that artificially reduces the global TMT trend by 0.042 K decade−1 for 1979–2009. Accounting for this bias increases the global UAH TMT trend from 0.038 to 0.080 K decade−1, effectively eliminating the trend difference between UAH and RSS and decreasing the trend difference between UAH and NOAA by 47%.
Satellite temperature products are the result of quite complex modelling - Spencers unspoken assumption that they represent 'ground truth' is not well supported. And Christy, who produced the graph, is well aware of this - he's an author on 2006 US CCSP Temperature Trends In the Lower Atmosphere, which states (emphasis added):
This inconsistency between model results and observations could arise either because “real world” amplification effects on short and long time scales are controlled by different physical mechanisms, and models fail to capture such behavior; or because non-climatic influences remaining in some or all of the observed tropospheric datasets lead to biased long-term trends; or a combination of these factors. The new evidence in this Report [...] favors the second explanation.
In short - the graph is nonsense, lacking context.
-
Mike at Watch the Deniers at 22:44 PM on 11 June 2013A Miss by Myles: Why Professor Allen is wrong to think carbon capture and storage will solve the climate crisis
Good post on both CCS and the Allen's comments. "Magic bullet" thinking does concern me, given just how complicated the issue is.
Perhaps there is a place for CCS in order to draw down some of the CO2, but like other geo-engineering proposals it does nothing to address emissions. Then there is the issue of leaks/out gassing.
I dare say the response has to be multi-pronged, and by mid-century CCS will be part of the portfolio of technology responses. However, it would be prudent to match these with policies and mechanisms designed to switch energy sources and abate emissions. Critical to this is to keep the estimated 560+ Gt of Co2 in the ground, which would otherwise global av. temps beyond 2C.
-
MarkR at 21:35 PM on 11 June 2013A Miss by Myles: Why Professor Allen is wrong to think carbon capture and storage will solve the climate crisis
I understand Allen's point; he starts on the assumption that we will burn all fossil fuels, so all of that carbon will end up in the air. If that were absolutely true then logically only carbon sequestration would deal with it.
But I don't think he's demonstrated that it's true and I don't think he's shown that CCS would work economically.
He's basically argued for a trade war if countries don't agree to CCS, and assumes that's realistic for hugely expensive CCS but unrealistic for much, much cheaper alternatives.
-
Rob Painting at 19:45 PM on 11 June 20132013 SkS Weekly Digest #23
An epic fail indeed - by Roy Spencer. See Glenn Tamblyn's comments at Roy's blog here. Lesson No.1 - if it looks bogus, it probably is.
-
soo doh nim at 18:22 PM on 11 June 20132013 SkS Weekly Digest #23
What do you guys make of this:
http://wattsupwiththat.com/2013/06/06/climate-modeling-epic-fail-spencer-the-day-of-reckoning-has-arrived/
-
Dikran Marsupial at 16:48 PM on 11 June 2013The anthropogenic global warming rate: Is it steady for the last 100 years? Part 2.
KK Tung wrote: "In any case C is deterministic and that is the major defect of the thought experiment."
This is irrelevant to the central point.
"The whole problem can still be solved algebraically."
It is irrelevant whether the problem can be solved algebraically, we are discussing a limitation of MLR, so the solution that MLR finds is the issue.
"The criticism of your experiment in my post 134 still stands. If you wish I can repeat it with the correction in B that you just told me."
Yes, please do so.
-
Ari Jokimäki at 15:40 PM on 11 June 2013An estimate of the consensus project paper search coverage
Mspelto, thanks for the insider view. I think there are lot of papers in each category, where things are left unsaid just because the scope of the study.
Lanfear, that last comment was made tongue at least halfway in the cheek. We don't yet have the ~900 papers in our hands but it would need some digging to find out them all. We would need to rate every climate paper there is in order to find them. Having rated a few papers during this project, I know how tiring the rating process can be, so if we would like to rate large amount of papers, we would need lot more raters.
-
Chemware at 15:06 PM on 11 June 2013A Miss by Myles: Why Professor Allen is wrong to think carbon capture and storage will solve the climate crisis
On economics:
There was an excellent study in 2009 from Harvard University by Mohammed Al-Juaied and Adam Whitmore, the former a respected researcher into carbon capture:
Realistic Costs of Carbon Capture
It found that the cost of capture at a First-of-a-Kind Plant was around $150 per ton CO2, and $35-$70 per ton for a mature (Nth of a Kind) plant.
Most other estimates I have seen come in at around $100 per ton.
As I understand it, photovoltaic, wind and even nuclear become viable at much lower levels. That's without getting into the interesting SHE issues that enormous quantities of contaminated waste amines would raise.
-
KK Tung at 10:52 AM on 11 June 2013The anthropogenic global warming rate: Is it steady for the last 100 years? Part 2.
In reply to Dikran Marsupial on post 151. My reply to your post 134 is post 154. It was sent before I saw your correction to your D in the new post 151. It may be confusing because it arrived after your post 151.
Now with the correction, D has a different period as B. I still don't know what you intended it to be. In any case C is deterministic and that is the major defect of the thought experiment. The whole problem can still be solved algebraically. The criticism of your experiment in my post 134 still stands. If you wish I can repeat it with the correction in B that you just told me. But it is probably not necessary.
-
Tom Dayton at 10:15 AM on 11 June 2013Water vapor is the most powerful greenhouse gas
There's a good article in the June 2013 issue of Physics Today: "Water in the Atmosphere," by Bjorn Stevens and Sandrine Bony, pages 29-34.
-
KK Tung at 10:03 AM on 11 June 2013The anthropogenic global warming rate: Is it steady for the last 100 years? Part 2.
In reply to Dikran Marsupial on the thought experiment he posed on post 134: I have a little time today and can get back to understand your thought experiment as I promised.
Conclusion: A conflated D and an error in plotting the deduced Anthropogenic response. But basically this is the trivial case that I had already discussed on post 124, this being the deterministic limit of Dumb Scientist's example.
In the thought experiment that you posed and later abandoned in favor of this one, there was a nonexistent AMO. This time there is an "unobserved signal D". I don't understand why you need it. Anyway, let's keep it but realize that D is simply the same sinusoid as B unless there was a typo. So it can be replaced by B. The problem is then rather simple:
Y is supposed to be your global mean data:
Y=A+1.5*B+0.1*radn(size(T)),
where A is his anthropogenic trend, with a quadratic term:
A=0.00002*(T+T.^2)
B is a natural oscillation:
B=0.1*sin(3.7*pi*T/150).
C is supposed to be your N. Atlantic mean temperature that you will use to define the AMO index, but there is no noise term. This is a major defect.
C=0.5*A+B.
Cd is C linear detrended, so it is
Cd=0.5*(A-beta(2)*T)+B=0.5*0.00002*T.^2+B
C and Cd are deterministic, and so this is a trivial case. No need to do MLR. (This is similar to the case of DS when the regional Atlantic noise is set to zero). I can solve this problem exactly to yield:
Y-1.5*Cd=0.00002*(T+0.25*t.^2)+0.1*radn(size(T)).
This is the same as your deduced A plus residual that you plotted in green line in your last figure. This is almost linear as you found because the quadratic term is 1/4 the original value in A. So it looks like the blue linear trend you draw in that figure.The reason the blue line and greenline are offset below the red line A is that in your MLR X you have subtracted the mean of T, and so T does not start at 0 at year 0, but is zero at year 75. You can see it in the blue line in your last figure. Your claim that it falls outside the confidence interval is probably caused by this offset error.
In any case, regardless of the confidence level (which I have not checked because I did not repeat the MLR), you have not come up with a credible thought experiment to make your case against our MLR procedure. The present one is the same as a trivial subcase of Dumb Scientist's example that I discussed in my post 124. It is also very unrealistic because you did not include a noise term in your N. Atlantic data.
-
Dumb Scientist at 09:07 AM on 11 June 2013The anthropogenic global warming rate: Is it steady for the last 100 years? Part 2.
... I need to reiterate the basic premise of parameter estimation: if A is the true value and B is an estimate of A but with uncertainty, then B should not be considered to underestimate or overestimate A if A is within the 95% confidence interval (CI) of B. ... Not taking CI of the estimate into account is not the only problem in your post 117. ... [KK Tung]
My Monte Carlo histograms estimated the confidence intervals. To make these 95% confidence intervals more explicit, gaussians are now fit to the histograms. For comparison, 95% confidence intervals from the post-1979 trend regressions are also reported now.
A more serious problem is your creation of an almost trivial example for the purpose of arguing your case. ... I said this is an almost trivial example because if this small "regional" noise were zero it would have been a trivial case (see later). Even with the small regional noise, your n_atlantic is highly correlated with your global data at higher than 0.8 correlation coefficient at all time scales. [KK Tung]
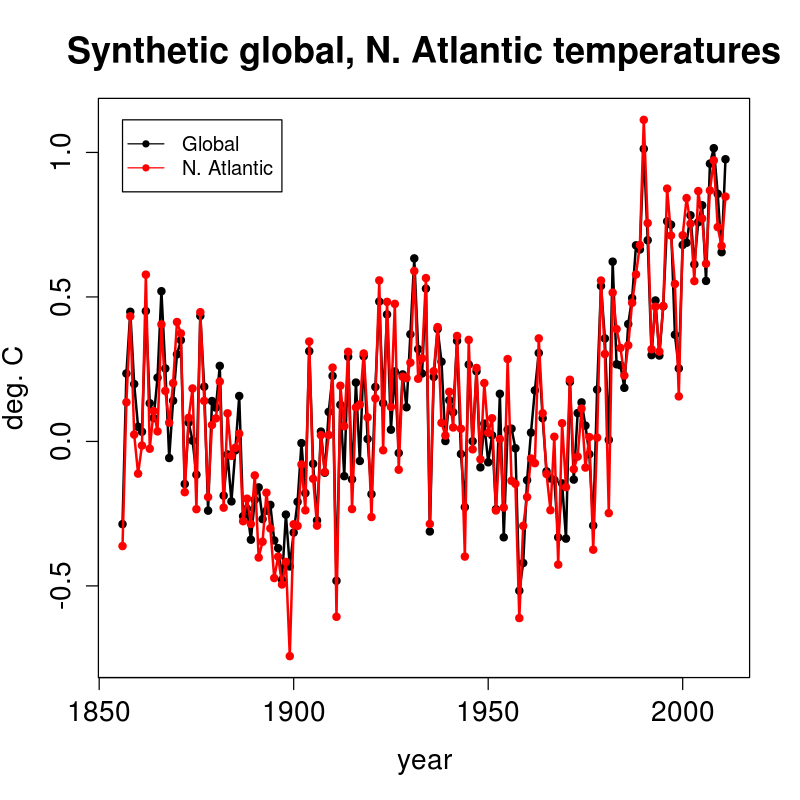
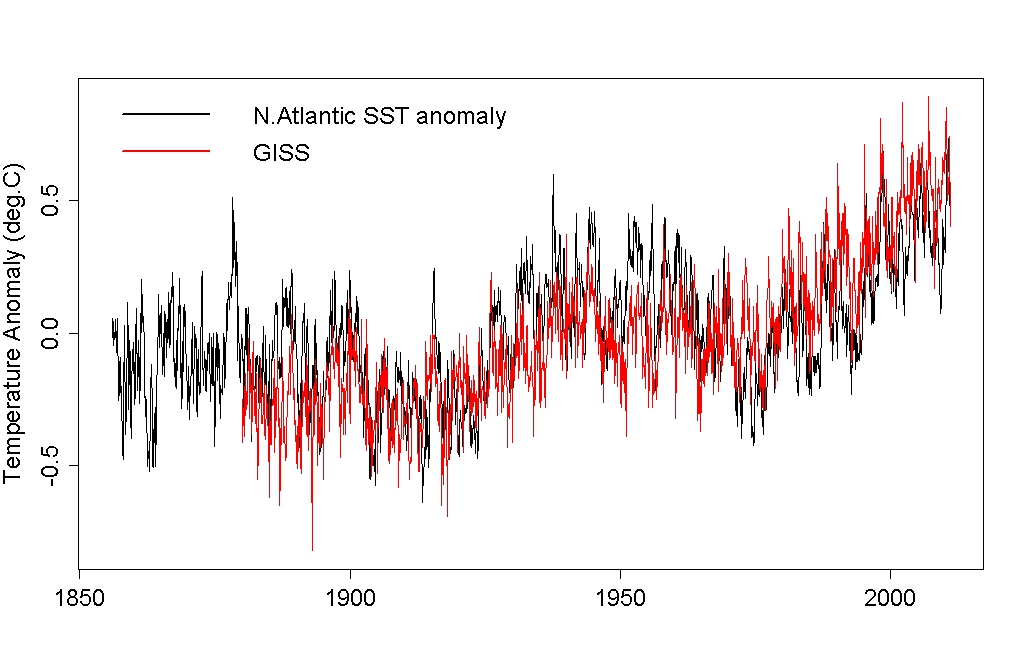
My original timeseries were simply chosen to look like these real timeseries from GISS and NOAA.
I wrote a new R program that downloads the HadCRUT4 annual global surface temperatures, and calculates annual averages of NOAA's long monthly AMO index and N. Atlantic SST:

The correlation coefficient between annual HadCRUT4 and N. Atlantic SST is 0.79. Linear regression is based on correlations, so my original synthetic timeseries were too highly correlated. Thanks for pointing this out, Dr. Tung.
To make your synthetic data slightly more realistic while retaining most of their features that you wanted we could either increase the standard deviation of the regional noise from 0.1 to 0.3---this change is realistic because the regional variance is always larger than the global mean variance... [KK Tung]
In my original simulation, the regional variance was already larger than the global mean variance because the regional noise was added to the global noise. In reality, the annual N. Atlantic SST variance is 0.04°C^2 but the annual global HadCRUT4 variance is 0.07°C^2. Adding 0.3°C of regional noise yields a reasonable correlation coefficient, but it doesn't look realistic:

Or we could retain the same combined standard deviation as your two noise terms in n_atlantic, but from a different draw of the random variable than the random variable in global... [KK Tung]
That looked more realistic but the average correlation coefficient over 10,000 runs was 0.64±0.08, which is too small. So I chose new simulation parameters to match the real correlation coefficient (0.79) and produce more realistic timeseries:
human = (t-t[1])^7
human = 0.7*human/human[length(t)]
nature = 0.15*cos(2*pi*(t-2000)/70)
global = human + nature + rnorm(t,mean=0,sd=0.11)
n_atlantic = human + nature + rnorm(t,mean=0,sd=sqrt(0.11^2+0.11^2))Now the AMO's amplitude is 0.15°C and the total human contribution is 0.7°C, both of which match the lower bounds in Tung and Zhou 2013. The nonlinearity is now 7th order to keep the true post-1979 human trend at 0.17°C/decade.

Averaged over 10,000 Monte Carlo runs, the synthetic correlation coefficient was 0.74±0.06, which contains the real value (0.79). The synthetic global variance is 0.06±0.01°C^2 which contains the real value (0.07°C^2). The synthetic N. Atlantic variance is 0.07±0.01°C^2, which is still larger than the real value (0.04°C^2). However, the discrepancy has shrunk and the LOWESS smooth removes fast fluctuations anyway.
You can also make your example less deterministic and hence less trivial, by smoothing your AMO index as we did in our paper. [KK Tung]
A 25-year LOWESS smooth was applied to the real and synthetic AMO index to match your paper:
smoothed_amo = lowess(t,amo,f=25/n)$y
amo = smoothed_amo

Here are the real residuals:

Here are the synthetic residuals:

Here are the real results:

(For easier comparison, the true human curve was shifted so it has the same post-1979 mean as the estimated human trend.)
Those results only use a white-noise model for comparison to the simulations. The real data are autocorrelated, and the caption of Fig. 1 in Zhou and Tung 2012 says the noise is order AR(4), which yields a trend of +0.12±0.05°C/decade.
Here are the synthetic results:

Averaged over 10,000 runs, the synthetic post-1979 trends and 95% confidence intervals are +0.09±0.04°C/decade. This histogram provides another similar estimate:

The true quadratic term is +5.15x10^(-5)°C/year^2, but the estimated value and its 95% confidence interval is +3.24±0.72x10^(-5)°C/year^2. The estimated human influence is still signficantly more linear than the true human influence, which is actually 7th order.
... In the MLR analysis of the real observation the degree of collinearity is much smaller, hence our error bars are much smaller, and so our MLR analysis gave useful results while your artificially constructed case did not yield useful results. ... [KK Tung]
Despite smoothing the AMO index and choosing simulation parameters that yield timeseries and correlation coefficients that are more realistic, the true post-1979 trend of 0.17°C/decade is still above the 95% confidence interval. The same procedure applied to real data yields similar trends and uncertainties. Therefore, I still think Tung and Zhou 2013 is a circular argument.
In our PNAS paper, we said that because of the importance of the results we needed to show consistency of the results obtained by different methods. The other method we used was wavelet. Applying the wavelet method to your example and to all the cases mentioned here we obtain the correct estimate of the true value foranthropogenic warming rate over 98% of the time. The wavelet method does not involve detrending and can handle both linear or nonlinear trends. [KK Tung]
The wavelet method may have its own problems, but these problems are orthogonal to the problem of the MLR as no detrending is involved. [KK Tung]
The wavelet method is just another way to curve-fit, which is also inadequate because attribution is really a thermodynamics problem. Again, your curve-fitting claim that ~40% of the surface warming over the last 50 years can be attributed to a single mode of internal variability contradicts Isaac Held and Huber and Knutti 2012 who used thermodynamics to conclude that all modes of internal variability couldn't be responsible for more than about 25% of this surface warming.
-
MA Rodger at 08:38 AM on 11 June 2013The anthropogenic global warming rate: Is it steady for the last 100 years? Part 2.
KK Tung @149.
Well, here is the statement from your first SkS Post and, as written, its context is quite clear. Figure 3 applies to the "final adjusted data" not to the "first step," not to any "intermediate step." Yet the presence of the "minor negative trend" is clearly accepted and while the rest of it is plainly described as "almost just noise" despite it still containing half the de-trended signal for 90 years of the 160 year of the MLR (as shown @148 above). This situation is described as "successful."
The arbitrary comment is made that this "small negative trend" can be added back from residual into anthropogenic regressor, but as written this is continuing to treat the "small negative trend" as one entirely negligable in consequence (because no consequences are described).
"Of the different regressors we tried the single anthropogenic regressor that is closest to the final adjusted data turns out to the QCO2(t) function given in Figure 1b. This is shown in Figure 3. The difference between the adjusted data and the QCO2 regressor is the Residual, which is shown in the inset. Except for s a minor negative trend in the last decade in the Residual, it is almost just noise. So the MLR with QCO2 as the anthropogenic regressor is successful. That small negative trend in the Residual, when added back to QCO2, yields a more linear trend in the adjusted data, similar to what we found in Tung and Zhou and in Figure 2b here. (The physical interpretation of why the net anthropogenic warming appears to follow the radiative heating by CO2 alone and with so little lag between forcing and response is rather tricky and will not be discussed here.)"
-
jdixon1980 at 08:17 AM on 11 June 2013The 5 characteristics of global warming consensus denial
DS @ 78: But what if they say, no, the scientists have come up with a better scheme than trying to sell uncertainty as to human cause, because there is only so long they could drag that out before their funders threw their hands up and said look, we've given you enough money, and if you're not sure by now, we must not be causing it. Instead, their scheme is to present a united front on human cause, and claim that they need enormous sums to create and continually refine computer models, study the impacts of various projected scenarios, propose and periodically revise emissions targets, periodically reassess climate sensitivity, etc. etc., thus creating an inherently self-perpetuating stream of research funding. Unlike the "uncertainty" approach which is bound to wear thin eventually, with this strategy there will be no point at which the gravy will stop, because the "so-called 'consensus'" as to human cause and seriousness of the problem attaches great importance to the research pertaining to details.
Of course, it's silly - those who are so inclined can always come up with convoluted rationalizations for believing in grand conspiracies. And John Hartz @ 79 is probably right - by trying to get inside their heads and preemptively refute every kooky thing they may come up with, I will never succeed in guiding them to sanity, but I may succeed in driving myself insane!
-
Lanfear at 06:28 AM on 11 June 2013An estimate of the consensus project paper search coverage
"Perhaps one of them is the one that turns around the whole of climate science."
Then it would need to be a thick one, since it needs to overthrow a sizeable chunk of the known, and settled, science.
Or, of course, the explanation is dispersed over a number of papers.
Either way, both cases are testable, either look into the thick research papers and see if they provide an alternative explanation which covers all the known detected anomalities. Or see if there are number of papers that does the same, being referred by each other.
After all, ~900 papers should not be that hard to read through. That's less than 3 years with 1 paper per day and I'm pretty sure you can automate this.
What are the odds of pseudosceptics picking up this task?
-
mspelto at 05:14 AM on 11 June 2013An estimate of the consensus project paper search coverage
Your comment fit well with my mass balance work on glaciers, "impacts papers are more inclined to mention the phenomenon causing the impacts they are studying, whereas for climate scientists it might go without saying that they are studying climate change related issues and they are perhaps more concentrated on studying the little details of the issue." All of my results indicate the impacts of global warming on glaciers, but the focus in word choice in the abstract will be more on negative mass balance, glacier retreat due to warming in the region. Since we are studying a locality that is the focus, and so it sometimes goes unsaid that it is all driven by global warming. .
-
Dikran Marsupial at 05:05 AM on 11 June 2013The anthropogenic global warming rate: Is it steady for the last 100 years? Part 2.
Prof. Tung. I deliberately separated the example from the discussion of AMO and relabelled the variables essentially at your request. The discussion is focussed on the form of the regression analysis, the exact nature of the variables is entirely unimportant, except for the fact that one of the variables (D) is only observed (C) in a form that is contaminated with the other two (A and B). Please can you answer the question, as posed: do you agree that in this example, the MLR regression method significantly underestimates the effect of signal A on signal Y?
please accept my appologies, I'm obviously having a bad day and am too grumpy to be posting. There was an error, it should be
B = 0.1*sin(2*pi*T/150);
however, the exact nature of the signals is unimportant other than that D is only observed contaminated with A and B as signal C. The plots and confidence intervals etc. should be O.K.
-
KK Tung at 04:51 AM on 11 June 2013The anthropogenic global warming rate: Is it steady for the last 100 years? Part 2.
Question to Dikran Marsupial on post 134: I don't quite understand your thought experiment. What is an "unobserved signal D"? Whatpurpose did you intend it to serve in this thought experiment? Isn't it the same as B? You can combine D with B and get:
C=0.5*A+(0.05+0.05)*sin(3.7*pi*T/150)
So it should simply be
C=0.5*A+B
Y=A+(0.1+0.05)sin(3.7*pi*T/150)+0.1*radn((size(T))
So it should simply be
Y=A+1.5*B+0.1radn((size(T)).
Maybe there was a typo on the sinusoidal function?
-
KK Tung at 04:09 AM on 11 June 2013The anthropogenic global warming rate: Is it steady for the last 100 years? Part 2.
Replying to MA Rodger in posts 147 and 148: You missunderstood the context of that statement about a minor negative trend in the residual. In the method of MLR that we used, the residual is added back to the regressed "anthropogenic" signal in the first round to obtain the "adjusted data" from which then the anthropogenic trend was finally determined. The result from the first step is not considered final if there is a trend in the residual. One should not attribute it in the intermediate step of the procedure to anything until the process is complete.
-
BaerbelW at 04:01 AM on 11 June 2013Live Feed of the AGU Chapman Conference on Climate Communication starting... now!
According to the Web Session Schedule, John's session on Wednesday will be broadcast online:
2:00 p.m. — 2:15 p.m.
The Importance of Consensus Information in Reducing the Biasing Influence of Worldview on Climate Change Attitudes -
miffedmax at 02:51 AM on 11 June 2013Lu Blames Global Warming on CFCs (Curve Fitting Correlations)
Thanks again for such a clear, concise rebuttal.
But I have to admit I got completely lost in the comments. This is an informative, if sometimes scary place, for us right-brainers. -
ShineNet at 02:28 AM on 11 June 2013Live Feed of the AGU Chapman Conference on Climate Communication starting... now!
Will these live feeds be recorded and available later? Thanks!
Response:[John Cook] I asked AGU about the question of archiving and they said probably yes, they will be available down the track.
-
Tom Curtis at 22:16 PM on 10 June 2013Imbers et al. Test Human-Caused Global Warming Detection
SASM @45, I have responded here.
-
Tom Curtis at 22:15 PM on 10 June 2013CO2 effect is saturated
Elsewhere, SASM asked some questions that were snipped for being off topic. They are on topic here, so I will address them. He says:
"Is it true that CO2 is nearly fully saturated in the IR bands? I have read (http://www.skepticalscience.com/saturated-co2-effect.htm) and it clearly shows that CO2 is dimming some IR to space in the 700 to 760 wavenumber bands, which is mid-wave IR around 13-14 um. Brightness is reduced by about 1.5K, but what is this in watts/m^2 or how much warming does this blockage produce? My speculation is that this is not very much. WUWT has a post (http://wattsupwiththat.com/2013/06/08/by-the-numbers-having-the-courage-to-do-nothing/#more-87809) that states that 94.9% of the IR is absorbed by 400 ppm CO2. The increase from 300 ppm to 400 ppm (the amount from early 1900 until now) only blocks 2.3% more than what is naturally occurring (i.e., 92.6% absorption for 300 ppm CO2). Do you all agree with these numbers, and if not what numbers do you have? How much additional warming is directly caused by the increase from 280 ppm to 400 ppm today? Don’t include forcing, feedback, or anything like that – just effects of CO2"
Turning to the WUWT post, it is complete nonsense. It does not indicate how the values of any of its tables were determined, and makes absurd false statements such at that at least 200 ppmv is required in the atmosphere for plant life to grow (CO2 concentrations dropped to 182.2 ppmv at the Last Glacial Maximum, giving the lie to that common claim).
More importantly, the claim that the "...proportional values shown above present are universally accepted by skeptics and Global Warming alarmists alike..." (PDF) is complete bunk. They are not accepted universally by AGW "skeptics" and are accepted by no defenders of climate science. Specifically, the "universally accepted" formula for radiative forcing is RFt = 5.35* ln(ct/c0). That is, the radiative forcing due to CO2 at time, t, relative to time, 0, equals 5.35 times the natural log of the CO2 concentration at time t divided by the CO2 concentration at time 0. The equilibrium temperatue response to that radiative forcing is a linear function of the radiative forcing, so that it follows the same logarithmic relationship.
An immediate consequence of that logarithmic relationship is that the temperature response for a doubling of CO2 concentration is the same for any doubling of CO2 concentration across the range over which that formula is valid (it clearly does not apply for very low values of CO2). That is, if the temperature response for increasing CO2 from 100 to 200 ppmv is X, then the temperature response for increasing it from 200 to 400, or 300 to 600, or 400 to 800, or 500 to 1000 ppmv will also be x.
Contrary to that relationship, however, Hoskins shows the increase from 100 to 200 as being 10.1% of some unknown value; that from 200 to 400 as being 7.3% of the same value; that from 300 to 600 as being 5.2%; that from 400 to 800 as being 4.6%, and that from 500 to 1000 as being 2.1% (PDF). As such his tables contradict the best known, and most widely accepted formula in climate science. Even worse, he then goes on to say that "beyond 1000+ ppmv the effect of increasing levels of CO2 can only ever be
absolutely minimal even if CO2 concentrations were to increase indefinitely." (PDF) That claim is the basis of setting the temperature response to 1000 ppmv as 100%, but is complete bunk. As per the standard formula, the temperature response of an increase in CO2 level from 1000 to 2000 ppmv is the same as the the temperature response for an increase from 100 to 200 ppmv.Hoskins does not even apply his formula consistently. Based on his first table, the increase in temperature for a given increase in CO2 concentration expressed as a ratio of earlier increases should be constant regardless of whether you use IPCC values, or "skeptical" values. Yet in his second table (WUWT post) that condition is not met. In other words, his calculated temperature responses in his second table are inconsistent with those in his first table.
Anyway, with the standard IPCC climate sensitivity of 3 C per doubling of CO2, increasing CO2 from 400 to 1000 ppmv will increase temperature by 3.9 C. That will represent a 5.4 C increase over pre-industrial levels - an increase equivalent to the difference in temperature between the coldest period of the last glacial and the pre-industrial.
-
ajki at 20:49 PM on 10 June 20132013 SkS Weekly Digest #23
Wow, this is a magazine that did understand this "sustainability" thing right by reusing its own covers :-D
May I use the opportunitiy to point the SkS team to one journalist who really tries hard to promote the many difficult issues around global warming and especially the arctic regions: Irene Quaile with her blog "Ice Blog" on dw.de (Deutsche Welle, a state owned broadcast). Throughout the years I've really learned to love her coverage and the great photo material on her blog.
-
Paul Pukite at 14:43 PM on 10 June 2013Lu Blames Global Warming on CFCs (Curve Fitting Correlations)
I commented at #4 with a double-check on Lu's regression analysis. Lu claims he did an analysis where he removed the effects of the solar component. What is interesting is I used his correlation recipe but only sliding by a lag of 9 years and got the same R^2 as he got.
I think this has important implications because his correlation coefficient didn't improve by removing the solar component. This could only happen if it was just a random effect in the first place. IOW, he didn't do a null test, but simply claimed that the solar improved the fit.
I might be missing something, that is why it is nice to have the SkS blog available.
-
Paul Pukite at 14:38 PM on 10 June 2013New study by Skeptical Science author finds 100% of atmospheric CO2 rise is man-made
Using the equatorial SST data for latitudes -6±15 degrees, we can take the Mauna Loa CO2 data and compensate for seasonal outgassing. This has a Henry's Law gain factor of 3 PPM/deg C after applying a lag of 1 month. This simple transformation completely removes the seasonal oscillations, leaving only low-level noise and perhaps a few glitches related to El Nino events (see 1998-1999).

The above figure is the compensated Mauna Loa CO2 data after removing the seasonal IPWP ocean outgassing of CO2. I also placed a polynomial fit as a guid to the eye.

The above figure shows the Indo-Pacific Warm Pool (IPWP) lies within the +9N to -21S SST average. This is the hottest part of the Pacific and should have the strongest activation for CO2 outgassing.
The SST data was taken from a NOMADS server (NOAA Operational Model Archive and Distribution System)
http://nomad3.ncep.noaa.gov/cgi-bin/pdisp_sst.sh?ctlfile=monoiv2.ctl&varlist=on&psfile=on&new_window=on&ptype=ts&dir=The CO2 data was taken from the Mauna Loa records, going back to 1981 to match the archival extent of the SST records
http://www.woodfortrees.org/data/esrl-co2/from:1981I have to say that the available oceanographic and atmospheric data is an amazing resource for debunking claims made by people like Humlum (and don't forget Murry Salby).
-
EliRabett at 12:58 PM on 10 June 2013Lu Blames Global Warming on CFCs (Curve Fitting Correlations)
Chordotonal, the good Professor Lu did not fit a curve, he tortured the poor dear with thick lines until it cried enough. The level of curve fitting was "look at that" without any statistical analysis. Follow the link
-
Tom Dayton at 11:59 AM on 10 June 2013CO2 effect is saturated
Stealth, see also "A Saturated Gassy Argument" part 1 and part 2. For more technical depth, check out Science of Doom; there are several places where saturation is discussed, but you might start with Part Five.
-
scaddenp at 10:45 AM on 10 June 2013Imbers et al. Test Human-Caused Global Warming Detection
And please move further comments to the appropriate thread. Regulars view this site through "comments" link so you comment doesnt get lost. Offtopic comments will be deleted.
-
scaddenp at 10:43 AM on 10 June 2013Imbers et al. Test Human-Caused Global Warming Detection
Stealth, you can play with the numbers yourself with this wonderful calculator. The mathematical introduction in Ramanathan Coakley 1978. Doubling CO2 from 280 adds 3.7W/m2 from CO2 alone.
-
StealthAircraftSoftwareModeler at 10:13 AM on 10 June 2013Imbers et al. Test Human-Caused Global Warming Detection
DSL @43. It seems my comment may have been deleted and I am not sure why. I did ask some questions and you seemed to answer one of them, so it was posted for some time. Perhaps the moderator thought my post was an ad hominem or not on topic or inflammatory. If so, I apologize. I’m not looking to start any flame wars and I am honestly looking for a good discussion.
Let me just completely back up and ask some basic questions:
(-snip-). Thanks! Stealth
Moderator Response:[DB] Your previous comment was moderated out as it contained multiple off topic statements, as does this one. Please take your individual concerns and questions to the most appropriate threads and place them there. The regulars providing dialogue interaction and guidance here will see them, no matter where you place your questions, and will respond as appropriate on those same threads.
Prev 881 882 883 884 885 886 887 888 889 890 891 892 893 894 895 896 Next


