


 Arguments


Recent Comments
Prev 885 886 887 888 889 890 891 892 893 894 895 896 897 898 899 900 Next
Comments 44601 to 44650:
-
DAK4Blizzard at 14:49 PM on 23 July 2013Why doesn’t the temperature rise at the same rate that CO2 increases?
Why exactly is the ocean depth of 700 meters to 2000 meters used? Why is it 700 meters (rather than say 500 or 1000), and why not include the ocean below 2000 meters? Does the deeper ocean not interact as much/directly?
@mandas: The forcings that dictate weather trends may be different, occur on a different scale, and occur in a shorter period from those that influence climate trends. It's an interesting point you make, and it's true that global termperature has not been increasing at a steady linear rate in short runs. But I think the analogy may be too weak to be substituted as a point on climate for longer runs.
-
mandas at 13:21 PM on 23 July 2013Why doesn’t the temperature rise at the same rate that CO2 increases?
I have an analogy for this, and I would like everyone's opinion on whether or not it is valid.
Today is the 23rd July, which means it is 32 days past the solstice, and the level of solar radiative forcing has been increasing (here in Australia) every day over the last month. Yet interestingly, the temperature hasn't been increasing every day at the same rate. The temperature has been going up and down, and it will continue to go up and down in response to other forcings. Yet, over the next 6 months or so, the long term temperature trend will be upwards in response to the solar forcing.
We don't expect the temperature to increase at a linear rate every day from winter to summer, why would we expect temperature to do the same in response to CO2 forcing?
-
KR at 10:22 AM on 23 July 20132013 SkS Weekly News Roundup #29B
JvD - Consumption subsidies are indeed still subsidies; artificially reducing prices by diverting monies from elsewhere in a fashion which encourages consumption. Also note that there are probably another 300-400 B in 'hidden' subsidies such as tax structuring in developed and developing countries, rather more difficult to directly pull out but still there.
"Those countries are merely selling their own citizens fuel at the cost of production." - That would be incorrect; Saudi Arabia, for example, subsidizes fuels for its people out of foreign sales, to the extent of risking their own economy. This encourages massive over-consumption, they consume more per capita than the US and more total than the UK, despite having half the population.
Again, fossil fuel subsidies are not, as you claim, a myth. They are real, they encourage fossil fuel consumption by artificial price supression, and they distort economies.
-
bvee at 09:56 AM on 23 July 2013The Economist Screws Up on the Draft IPCC AR5 Report and Climate Sensitivity
i'm not criticising the style - ie line weight and title. although i do like the hue of blue used.
i am saying the graph indicates that models are insensitive to climate sensitivity.
-
scaddenp at 09:56 AM on 23 July 20132013 SkS Weekly News Roundup #29B
Huh? In my books, where a government pays money to a producer so that the consumer cost is less than market rate, that is a subsidy. They are not paying market rate and therefore it distorts comparison with other fuel sources. Now, for many places, unsubsidized fossil fuel may well be cheaper than unsubsized other sources (Not here in NZ), but while governments provide market-price distorting subsidies in various ways, you cannot know. Ask the question - if the government stopped paying those monies, would the consumer cost go up? If yes, then its a subsidy.
-
JvD at 09:39 AM on 23 July 20132013 SkS Weekly News Roundup #29B
KR, consumption subsidies in oil producing countries are not really subsidies. Those countries are merely selling their own citizens fuel at the cost of production.
It makes no sense to lump such 'consumption subsidies' into the same category with actual production subsidies in OECD nations to solar and wind owners. These are completely different things!
It muddles the discussion. It decieves people into thinking that solar and wind energy are competitive wth fossil fuels. This doesn't help. True environmentalists should explain to the public that fossil fuels are incredibly cheap, while solar and wind are expensive. What that means is that people will have to *pay* to increase solar and wind energy. It is no use trying to trick people into thinking that some dumb misinformation like "600B fossil fuel subsidies" is what is holding solar and wind back. It's just nonsense and it should stop. Don't you think?
-
Tom Curtis at 09:17 AM on 23 July 2013The Economist Screws Up on the Draft IPCC AR5 Report and Climate Sensitivity
ianw01, chriskoz, bvee:
1) The graph displays 7.4 pixels per century as measured on Paint.
2) The low climate sensitivity mark is displaced by four pixels relative to the high climate sensitivity mark, whereas logically they should by on the same point on the x-axis.
3) Displaying the three possible outcomes shown seperately would merely cause an indistinguishable wedge, removing clarity. I do not see how the loss of clarity and visual simplicity would be compensated by so small a gain in logical coherence.
4) We can take the red line to be the modelled result for historical and projected forcings with a high climate sensitivity with RCP 6.0 The modelled temperatures in such a case would not differ from oberved temperatures by more than the value of half a pixel, and so would be indistinguishable. The low and modal values would properly be indicated by a line across from the right y-axis in that case. So considered, the criticisms of the graph come down to one of style. This shows them to be entirely trivial.
-
bvee at 08:29 AM on 23 July 2013The Economist Screws Up on the Draft IPCC AR5 Report and Climate Sensitivity
and why does the graph combine measured and projected into one color?
-
bvee at 08:27 AM on 23 July 2013The Economist Screws Up on the Draft IPCC AR5 Report and Climate Sensitivity
ianw01 is right - the graph is wrong
and it's closer to 10px/100 yrs
-
ianw01 at 07:29 AM on 23 July 2013The Economist Screws Up on the Draft IPCC AR5 Report and Climate Sensitivity
chriskoz@8: I'm not quite following you, but let me try:
The article says the figure shows "the amount of warming we can expect .... for equilibrium climate sensitivities of 1.5°C (best case), 3°C (most likely), and 4.5°C (worst case)"
If I take your response, that the dots do have different x-values, then the clear (but steep) slope between the points indicates that in addition to the different amounts of warming, it will take longer to reach the peak for each climate sensitivity?
If I have it right now, I'd argue for a short dotted tail branching out to the right of each dot indicating that there are alternate trajectories for each sensitivity.
The unsettling aspect is that it seems to portray in inevitable climb past the "low sensitivity" red dot, no matter what. I don't want to beat this issue to death, but this logical inconsistency undermines the credibility of the graphic.
-
william5331 at 06:39 AM on 23 July 20132013 SkS Weekly Digest #29
There seems to be a feeling that the so called developed world; the rich countries will be able to buy their way out of the results of climate change. One could argue the converse. Think of the East Coast of America. A megalopolus from the Canadian border down to Florida. Massive cities with, at most, three days of food within their borders and dependent on food delivered from the hinterland (the whole of the US of A and even the world) at a rate which is just eneough and just in time. This megalopolus is also totally dependent on systems which bring in fresh water and take away and treat sewage. Now have a complete failure of the wheat, soya, barley, corn and vegetable crop in the US of A rather than the little glitches we have seen over the past few years. Have a few Sandies but ones large enough to effect the power lines, sources of fresh water and so forth. I think I would rather be in some remote area with my own vegetable gardens and close to a hinterland where I could hunt a rabbit from time to time.
-
Composer99 at 05:20 AM on 23 July 2013Empirical evidence that humans are causing global warming
Matthew L:
You'll have to put up with some asperity from me, but trying to argue
My contention is that warming itself cannot directly be linked to human causation only indirectly if one assumes that all warming is due to the increase in CO2.
Yes, CO2 has increased caused by human emissions and yes, over the last century there has been warming. However, correlation is not proof of causation.
in 2013 is like trying to argue against the germ theory of disease.
- The link I have you systematically ruled out any agent, other than anthropogenic greenhouse gas emissions, as the primary cause of warming in the 20th century and hence, especially since 1970.
- CO2 was demonstrated in the mid-19th century to be a confirmed greenhouse gas, and its relation to warming the planet was first elucidated by Svante Arrhenius at the turn of the 19th/20th centuries. The physical mechanisms behind CO2 absorption of infrared and the greenhouse effect were made clear with the development of quantum mechanics, and with the study of the upper atmosphere during the early part of the Cold War.
Thus:
- We know from physics theory and lab experiment that adding greenhouse gases to the atmosphere must, cause warming (or at least be counteracted by cooling forcings such as reduced solar irradiance or increased concentration of reflective aerosols).
- We know by process of elimination that the current global warming must be the result of an enhanced greenhouse effect: no other phenomenon we can observe can account for the behaviour of the Earth climate system. See, for example, the summary of radiative forcings since the pre-industrial era in the IPCC AR4, WG1.
- We know, also by process of elimination and by other supporting observations (e.g. declining O2 content in atmosphere), that the only source of greenhouse gases sufficient to account for the observed increase is from human combustion of fossil fuels.
-
Chris G at 02:52 AM on 23 July 2013Why doesn’t the temperature rise at the same rate that CO2 increases?
Thanks; this will be useful, for those who actually seek to understand at least.
-
Dikran Marsupial at 01:33 AM on 23 July 2013Empirical evidence that humans are causing global warming
Matthew L wrote "The global average surface (and Troposphere) temperature is currently pretty stable year to year within a ~ +/- 0.5c range up and down and has been for at least 10 years (depending on the data set)."
Given that the projected rise in GMST for the two decades following the last IPCC report was 0.2c per decade, stating that temperatures are stable to within +/- 0.5c for at least 10 years is pretty much what you would expect if the projection were correct!
I have to say I get a bit tetchy when people write "correlation is not proof of causation" in conjunction with GMSTs and AGW. It is as if this correllation were mainstream sciences only source of evidence regarding the causal relationship, essentially ignoring a couple of centuries of physics and a multitude of other lines of evidence (e.g. OHC).
We also wouldn't expect to see a good correlation over a period of a decade as CO2 is not the only forcing, and as well as forcings, GMSTs are also affected by internal climate variability (e.g. things such as ENSO). This means it is a bit of a red-herring anyway! -
Philippe Chantreau at 01:23 AM on 23 July 2013Empirical evidence that humans are causing global warming
And the same could be said of numerous 10 years periods in the historical record, even the trend is what it is. Matthew is going down the up escalator, and ignoring that there is a very clear and inescapable physical mechanism for warming from increased atmospheric CO2. Same old...
-
Matthew L at 00:47 AM on 23 July 2013Empirical evidence that humans are causing global warming
Moderator: I think the following is on-topic. My second post was written before I saw your first post directing me to other threads, so my apologies if it seemed off topic.
Composer99
"There are multiple lines of evidence showing that the enhanced greenhouse effect causing the present warming is itself human-caused, as well as evidence excluding other sources. These lines of evidence are discussed here (and elsewhere) on Skeptical Science (and from thence the primary literature)."
Your link under the word "here" is to an article on the fact that the increase in CO2 in the atmosphere is "human-caused". That is something well proven and I do not argue with. My contention is that warming itself cannot directly be linked to human causation only indirectly if one assumes that all warming is due to the increase in CO2.
Yes, CO2 has increased caused by human emissions and yes, over the last century there has been warming. However, correlation is not proof of causation.
The global average surface (and Troposphere) temperature is currently pretty stable year to year within a ~ +/- 0.5c range up and down and has been for at least 10 years (depending on the data set). At some point the correlation will break down as the models' predicted increase in temperature moves further and further away from the actual measured temperature.
-
KR at 23:56 PM on 22 July 20132013 SkS Weekly News Roundup #29B
JvD - I fear you are looking at only a subset of the numbers. OECD countries are hardly the only group involved, and much of the subsidies are consumption subsidies in exporting countries, such as Iran and Saudia Arabia.

Duncan Clark in the Guardian has a good breakdown on a country-by-country basis, which is also worth looking at. Fossil fuel subsidies are not a myth. And phasing those subsidies out would have an impressive impact on emissions, estimated reductions (for example) on the order of 2.6 B tonnes by 2035, or ~70% of current EU emissions.
-
JvD at 23:19 PM on 22 July 20132013 SkS Weekly News Roundup #29B
"Industrialised nations plough $600 billion a year to subside coal, oil and gas activity."
This is not true! OECD countries 'plough' only about $45 to $75 billion of subsidies into fossil fuels per year, and they reap about $800 billion in tax revenues from the fossil fuel sector, of which about $400 billion directly from fuel taxes and another $400 billion from VAT and goods and services taxes.
http://www.oecd.org/site/tadffss/49006998.pdf
(-snip-).
Moderator Response:[DB] Inflammatory tone snipped.
-
Glenn Tamblyn at 19:03 PM on 22 July 2013Carbon Dioxide's invisibility is what causes global warming
gingcckgo, re Abbott's Dog Whistle.
Absolutely. The problem for Abbott is that a majority of the rest of the population don't agree with him on this and the dog whistle isn't silent for them, it is a horrible screeching in their ear. If he appeals to his rabid base, he alienates his broader or swinging base.
Something to do with petards and hoisting...
-
ginckgo at 15:27 PM on 22 July 2013Carbon Dioxide's invisibility is what causes global warming
You miss the point of this little Abbott dog-whistle, it's a cleverly coded message to his lunatic support base: http://www.abc.net.au/news/2013-07-18/green-an-invisible-nod-to-the-climate-change-sceptics/4826472
-
chriskoz at 14:17 PM on 22 July 2013The Economist Screws Up on the Draft IPCC AR5 Report and Climate Sensitivity
ianw01@7, you said:
Do the 3 labeled points have different x values? Presumably not
You're incorrect. Look at the timescale, draw the other X values of your interest and you'll see that, although 2000 and 2100 are different, their diffference on that plot is ~ one pixel.
I diagree with you that the inset is required to show what's happening between 2000-2100 because I see that graph as the summary of what was happening in the Holocene (human civilisation time), and the red line indicates the end of Holocene as we know it (some call this new period Anthropocene), there is no need to obstruct this simple picture with the "squeezed to timescale" AR5 scenarios picture refered to earlier, that lead to the red line.
-
tamikenn57 at 02:24 AM on 22 July 20132013 SkS Weekly News Roundup #29B
I don't count the increase of natural gas development as the tradeoff for coal reduction in China as a win. Obama is dead set pushing natural gas because of the economic benefits. To include increased exploration that extends the global climate carbon available to the number McKibben puts here: http://www.rollingstone.com/politics/news/global-warmings-terrifying-new-math-20120719
-
ianw01 at 23:03 PM on 21 July 2013The Economist Screws Up on the Draft IPCC AR5 Report and Climate Sensitivity
I find the plot quite puzzling. Do the 3 labeled points have different x values? Presumably not; I assume there are 3 overlapping lines that look like one line. For clarity I suggest that thinner lines of different colors be used, or perhaps an inset that shows what is happening in that thin slice of time.
-
michael sweet at 21:02 PM on 21 July 20132013 SkS Weekly News Roundup #29B
Chris,
This is terrific news. Thank you for the link. It will be interesting to see how this turns out.
Once again Michael Mann is a trend setter!
-
chriskoz at 19:37 PM on 21 July 20132013 SkS Weekly News Roundup #29B
The biggest news (perhaps the biggest in the history of climate science denial so far) is DC court decision to proceed with Michael Mann vs National Review case which might have broken right after this summary.
Interestingly, I scanned carefully through the comments section looking for any denialati innuendo, otherwise always present under news or quote related to Mike Mann. This time a total silence. Someone made a joke that "deniers are now going to say this DC court is part of the 'global conspiracy'", but that would be self-killing move so it looks like they prefer to stay silent. A turning point? Let's hold our breath until the final decision comes...
-
MA Rodger at 17:35 PM on 21 July 2013The anthropogenic global warming rate: Is it steady for the last 100 years? Part 2.
KK Tung @ 195 & @196.
The question I posed @193 was "Could you thus explain why this wobble is present in the residuals and why its presence has remained unreported?"
You appear to agree @195 that the wobble is significant in that @195 you mention such phenomenon without disputing its existence within my graph @193.
But you say I am not graphing the residuals from T&Zh13 Fig 5 because that would require the subtraction of a linear function while I subtracted the QCO2(t) function. Yet I do not consider such detail relevant to my enquiry. If the subtraction is linear or QCO2(t), neither will make wobbles magically disappear.
@196 you suggest the inset at Fig 3 in your 1st SkS post usefully shows residuals. Let us examine these residuals as there can be no dispute that they are the actual residuals. In that 1st SkS post you describe these residuals in the inset as "Except for s a minor negative trend in the last decade in the Residual, it is almost just noise," but this is not correct.The residuals in Fig3 inset contains a wobble, a signal almost half the size of the original HadCRUT4 signal. This is illustrated in the attached graph where the residuals have been multipled by 2 to show how close they are to being half the size of the original HadCRUT4 signal.A similar sized wobble is also present in the residuals of both the analyses graphed in Zh&T13 Fig 1 and T&Zh13 Fig 5. And the presence of such a wobble is important. After all, the final word of Zh&T13 was "Whether this method is successful can be judged by the reduced scatter in the adjusted data and by the residual’s resemblance to random noise."

So I repeat my question posed @193Could you thus explain why this wobble is present in the residuals and why its presence has remained unreported?
-
KK Tung at 09:55 AM on 21 July 2013The anthropogenic global warming rate: Is it steady for the last 100 years? Part 2.
Continued from post 195, the residual that you were looking for from the MLR analysis using QCO2 as the anthropogenic regressor was shown in Figure 3 in part 1 of my original post. No need to reconstruct.
-
whdaffer at 05:40 AM on 21 July 2013It hasn't warmed since 1998
Hi; On the issue of the video being private. Any ETA on when the updated versin will become available? It's a really nice explanation and I'd love to pass it along to some friends for whom such visual representations are more compelling.
whd
-
KK Tung at 04:10 AM on 21 July 2013The anthropogenic global warming rate: Is it steady for the last 100 years? Part 2.
In reply to MA Rodger at post 193:Ahh, I think I now understand your question. Figure 5B is the result of an MLR process, using a linear anthropogenic regressor. You wish to look at the residual of that MLR process, which was not shown in our PNAS paper. So you tried to reconstruct it by subtracting a posteri, an anthropogenic index QCO2, from a different set of MLR discussed in part 1 of my post, and found some significant wobbles. In that post I was trying to demonstrate the robustness of the adjusted data, which I said should ideally consist of anthropogenic response and climate noise, using very different anthropogenic regressors. It then follows that the residual---"climate noise"--- is compensating for the different anthropogenic regressor used. Therefore one cannot find out what the residual of one MLR is by subtracting out a different regressor. The QCO2 regressor was used only in part 1 off my post and a linear regressor was used in Figure 5 of our PNAS paper. I hope this answers your question.
-
MA Rodger at 02:23 AM on 21 July 2013The anthropogenic global warming rate: Is it steady for the last 100 years? Part 2.
KK Tung.
With no reply from you to my questioning @193, I will assume that the comments @190 & @192 constitutes such a reply. While I take a little time to consider the full implications of those replies, I will present another aspect of the data graphed @193 which also requires some explanation. (And be advised that this is not the last of my enquiries about this data.)The trace of the AMO signal shown in the graph @193 is obtained by subtracting the data presented in T&Zh13 Fig 5a from that in Fig 5b. This AMO signal raises two questions.
Firstly, this AMO signal used in your MLR is smoothed using LOWESS (as described in Zh&T13). This smoothing will smooth out inter-annual wobbles of ENSO or Sol or Vol that are present in the Enfield AMO data series. But such smoothing will not entirely remove ENSO, Sol & Vol. Indeed parts of these signals are still evident in your LOWESS smoothed AMO series. For instance, the inflection in the AMO signal 1980-90 is entirely the residual of two Volcanic wobbles (El Chi'chon & Pinatuba). Surely if AMO is to be used as a regressor then this LOWESS smoothing is allowing a smoothed and still significant ENSO, Sol & Vol signal to remain within that AMO signal. Can this be appropriate? Would it not be better to use, perhaps, MLR to remove ENSO, Sol & Vol from AMO prior to AMO's use in the HadCRUT4 MLR?
Secondly, there appears to be a problem with the more recent end of your smoothed AMO signal. I present the graph below by way of illustration. LOWESS smoothing of the AMO signal allows the signal to be smoothed to the very ends of the data.
The AMO signal has, of course, two ends. The 1856 end remains very flat despite the AMO index for 1856 averaging for more than a year 0.15 above your end-smoothed value. As a product of the smoothing process I have no problem with the flat 1856 end. Where things start to look awry is when this 1856 smoothing is compared with the smoothing at the 2000s end of the series.
The smoothed AMO signal from T&ZH13 Fig5 drops to its end 2007-2011 by 0.053. This is a considerable drop. In size it is over one sixth of the smoothed AMO's full value range. And it is crammed into a 4-year period. It is therefore a big drop.
This is all the more suprising as this drop is well over twice the drop of the smoothed AMO signal used in Zh&T13 Fig1 yet the inset in Zh&T13 clearly shows that Enfield AMO data to at least November 2011 has been used in Zh&T13. How then can T&Zh13 drop so much more than Zh&T13? In T&Zh13 the MLR does extend a further year to 2011 but, even if T&Zh13 included more recent data, any such extra data that is lower valued than your smoothed value (5 months worth) is far less significant than the 13 months-worth from 1856 that makes zero impact on the 1856 end. And, of course, the last year of Enfield AMO (some of which will post-date T&Zh13) is entirely above your smoothed value. As of now, there is no drop whatever!!
So can the large 2007-11 smoothed AMO drop used by T&Zh13 be explained?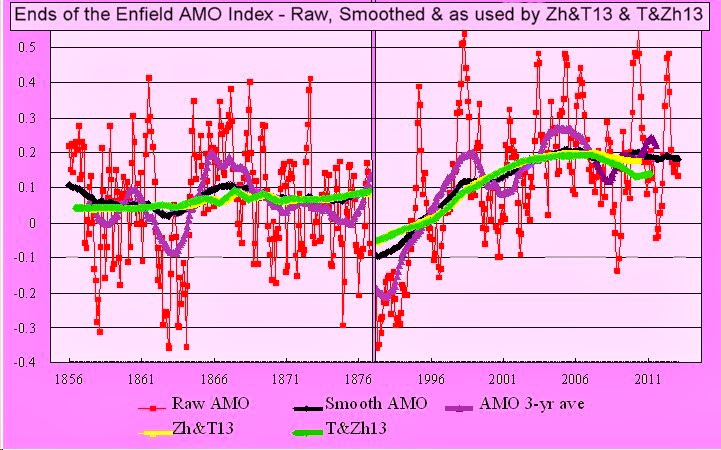
-
funglestrumpet at 22:42 PM on 20 July 2013Carbon Dioxide's invisibility is what causes global warming
Glenn Tamblyn @ 24
Thank you for taking the trouble to assist me in understanding the phenomenon of global warming in more detail. I imagine that others will have puzzled over the exact mechanism that greenhouse gasses employ in relation to IR radiation; I hope that they have been following the comments section of this post.
Thanks again to all who have commented in reply to my original request!
-
chriskoz at 20:22 PM on 20 July 2013Science does inform policy making … sometimes
Good info. The only question I have is the long-term lifetime of HFC in the athmosphere - are they as stable as CO2 or can they decompose faster?
It is important question, because if they maintain a signifficant residual forcing out of that ~0.5Wm-2 forcing shown on Figure2 for many centuries, then they will amplify CO2 impact at eqilibrium. The resulting fraction of a degree may make a lot of difference on top of CO2 induced warming with respect to Earth system tipping points. Consequently, their immediate reduction is as urgent as the reduction of CO2.
Figure 3 gives me an idea what may happen until 2100, but I'm interested in equilibrium conditions beyond 2100, with an optimistic assumption the emissions drop to zero within 2050 as with the white lines on Figure2.
-
shoyemore at 20:21 PM on 20 July 2013The Economist Screws Up on the Draft IPCC AR5 Report and Climate Sensitivity
IPCC Statement:
www.ipcc.ch/pdf/ar5/statement/statement_wg3_table.pdf
GENEVA, 19 July -
The Intergovernmental Panel on Climate Change (IPCC) notes that an article has been published in The Economist citing a table that appears in the second order draft of the IPCC Working Group III contribution to the IPCC's Fifth Assessment Report.
This draft, like any IPCC draft, is the result of the IPCC's iterative process of writing and review process and thus a work in progress. The text is likely to change in response to comments from government and expert reviewers. It is therefore premature and can be misleading to attempt to draw conclusions.
-
Micawber at 20:15 PM on 20 July 2013Global warming games - playing the man not the ball
CSLDF is a significant source of help to beleaguered scientists who in my experience have a strong belief if data-based truth and expect legal or justice systems to work on this basis. The Anglo-American adversarial legal system works by arguing polarised views with the winner being the best arguer. That is not necessarily or even usually the truth. Indeed a Harvard law prof stated that in his experience the verdict in legal cases rarely reflected the evidence. He said it was fortunate that accused were usually guilty of something so a guilty verdict could be justified.
It is a total shock to hardworking scientists to be exposed to such an unjust system. Clever wordsmiths can twist a narrative into a very persuasive argument that can easily sway non-scientist judge and jury. So CSLDF is welcome, though it will only make the lawyers even richer.
I note CSLDF is US-based. Science is international. One only has to think of Climategate and Phil Jones of UEA to realised that an international branch of CSLDF is sorely needed. Indeed Monckton is UK based for his international fund-raising attacks against climate science. He is thoroughly imbued with Catholic belief system so the parallels to Galileo were appropriately drawn in your article. Thus the deniers have an international fund raising association (hence the request for the Knights of Malta). Is there an international arm to CSLDF? -
MA Rodger at 19:16 PM on 20 July 2013Trenberth on Tracking Earth’s energy: A key to climate variability and change
A previous thread was opened up to this discussion with jmorpuss by Moderator Decree although moderators were kept busy. The final act was a proposed jump to a more appropriate thread where a rebuttal remains unaddressed by any counter-argument 18 months on.
Simply put, the tiny tiny fraction of the total energy-use of mankind that is present in radio waves sent into the atmosphere is incapable of impacting climate to any significant amount. Mankind's enhancement of the greenhouse effect is fifty-times greater than mankinds total energy-use. How then can a tiny tiny fraction of that already small fraction have a significant impact on climate?
If jmorpuss wishes to answer that question, perhaps he should do so on the thread with the unaddressed rebuttal.
Moderator Response:[TD] Thank you for the detective work! I had entirely forgotten that history, so I was baffled by jmorpuss's comments. Further comments by jmorpuss or anybody on that topic must be on the thread MA Rodger pointed to. Comments here, by anybody not just jmorpuss, will be deleted.
-
gpwayne at 15:54 PM on 20 July 2013The Economist Screws Up on the Draft IPCC AR5 Report and Climate Sensitivity
chriskoz: the 'PD' stands for 'peak and decline'.
The other scenarios are named after the w/m2 forcings - whereas RPC 3-PD posits a maximum of 3 w/m2, dropping to 2.6 w/m2 by 2100. I think it's confusing however, and elsewhere I've seen rather critical reactions to it as a pathway due to the rather unlikely nature of the scenario.
-
Tom Curtis at 11:20 AM on 20 July 2013CO2 was higher in the late Ordovician
CBlargh @8, I haven't really looked into it. Certainly it is plausible, and the Taconic orogeny occurs at about the right time to explain it. I do not, however, know the precise timing, nor what other events might be simultaneious with the Hirnantian cC13 excursion. Therefore it is a possible explanation only.
-
Tom Curtis at 11:06 AM on 20 July 2013Trenberth on Tracking Earth’s energy: A key to climate variability and change
jmorpuss @263, no he is not. Just because he mentions the ionosphere does not mean he was pursuing your particular brand of pseudo-science. Further, the Earth's dynamo effect has nothing to do with the greenhouse effect, and nor is it maintained by the energy of the sun.
-
Tom Curtis at 11:01 AM on 20 July 2013The Economist Screws Up on the Draft IPCC AR5 Report and Climate Sensitivity
Chriskoz @3, having had a closer look, it appears that you are correct and I am wrong.
Having said that, the radiative forcing of RCP 3-PD peaks at just over 3 W/m^2 in 2045, and drops to 2.6 W/m^2 by 2100. Were the radiative forcing held constant at 3 W/m^2, it would take approximately 200 years to reach the equilibrium climate sensitivity. Alternatively, had the radiative forcing been held constant from the time it reached 2.6 W/m^2 (2021), it would likewise take two hundred years to reach equilibrium climate sensitivity. It is unlikely, therefore, that in the RCP 3-PD scenario that equilibrium climate sensitivity will be reached in 2100.
So, not only does the Economist compare different scenarios, but they do not compare strictly equivalent values. Their fudge that "...the practical distinction would not be great so long as concentrations of CO2 and other greenhouse-gas emissions were stable or falling by 2100" is unsound.
-
jmorpuss at 10:47 AM on 20 July 2013Trenberth on Tracking Earth’s energy: A key to climate variability and change
I think Old sage has been trying to explain the importance of the Earths Dynamo Effect and it's production of electomagnetic field lines.
Moderator Response:[DB] Off-topic snipped.
-
scaddenp at 10:23 AM on 20 July 2013Trenberth on Tracking Earth’s energy: A key to climate variability and change
"Alas, your failure, again, is to validate your thoughts against reality"
Old Sage much prefers misconception to reality and by refusing to look at any evidence to the contrary is effectively got fingers in ears yelling "la, la, la". More what I would expect from a 8 year old.
-
CBlargh at 07:01 AM on 20 July 2013CO2 was higher in the late Ordovician
@Tom: Thanks for your reply.
It looks from the chart that this occurred later. Is increased weathering the accepted cause of the dC13 spike during the Hirnantian?
Never underestimate the power of a liverwort!
-
chriskoz at 20:32 PM on 19 July 2013The Economist Screws Up on the Draft IPCC AR5 Report and Climate Sensitivity
Tom@1,
Actually, on the Figure 5 in Dana's link to AR5 scenarios, in the RCP 3-PD scenario, the deltaT stays in at 1.7C and does not rise beyond 2100 suggesting it to be this scenario's equilibrium, rather than theoretical equilibrium of 1.7*1.5 = 2.55C.
I haven't read AR5 yet (no point doing it if I'm not a reviewer), but the key fallacy and misrepresentation by Economist here, appears to be that they tried to equate the RCP 3-PD scenario with Category 1 of TAR. Those are quire different scenarios. Category 1 TAR assumed emissions dropping after 2050 but staying positive throughout; while RCP 3-PD assumes emissions dropping below zero in 2070. Not realistic IMO, but the ingenuity of our children may do miracles. That would suposedly result in CO2 decline in second part of XXI and T not go to the 3Wm-2 equilibrium but stabilise around 2070 levels. The radiative forcings of AR5 scenarios are shown precisely here. BTW, anyone knows what "PD" stands for in RCP 3-PD acronym?
So, have the Economist reviewed carefuly the differences between TAR and AR5, they would not make such stupid comment. But from their narrative, it looks like they did not even bother distinguishing between equilibrium T and 2100y T, so it's hardly surprising they cannot understand the language of IPCC reports.
-
Lanfear at 20:11 PM on 19 July 2013Trenberth on Tracking Earth’s energy: A key to climate variability and change
Sorry Bob@259, this piece is irresistable :-/
"I'd just like to wrap up this exchange by saying there is evidence of energy exchange between the outer plasma and earth and it would be a very brave man who would deny its possibility."
Bluntly put, so what?
Your claim is at most a red herring or straw man, since nobody has denied the existence of the said phenomen.
What you have totally failed in is showing any evidence that the said phenomen is:
- Quantitatively relevant
- Any way fitting with the rest of the observed changes (see Tom's excellent point which I quoted in my previous writing)
Simply put, you jump over the necessary step of actually validating your thoughts by checking whether there are any actual evidence that supports your belief. Another good example of this kind of shortcoming can be seen in the cosmic ray explanation.
"If the earth only had O2 and N2, there would still be a 'greenhouse' effect"
This is funny. And just as you redefine the 'greenhouse' effect to mean something else, I redefine funny meaning 'not even wrong'.
"their failure to absorb and emit means their take up by conduction and convection could only be lost through transport"
Alas, your failure, again, is to validate your thoughts against reality.
Your setup is a planet with a pure N2+O2 atmosphere. This means that the atmosphere is transparent both in visible as well as IR spectrum. Since we know that the vast majority of the incoming energy comes in in these forms, the visible will either be absorbed by the ground/sea, or b) reflected (visible light), according to the albedo coefficient.
What about the absorbed energy, now transformed to heat? How does it get re-emitted from ground/sea? Some of it undoubtedly can be transferred by conduction, but a notable amount is also transmitted by IR. If you don't accept this, then you need to explain how exactly the IR cameras works.
Now since your atmosphere does not contain any element that can absorb IR radiation, it will dissipate to outer space. Compare this situation to our real atmosphere where the atmosphere contains GHGs which absorb and re-emit IR, and you should understand that logically this difference makes your example a cooler world when all other items are kept the same. In reality we do have both negative and positive feedbacks which alter the outcome, but these do not change the basic physical properties of N2, O2 nor CO2.
Hence it is evident that you either have a very poor understanding of the reality, or you choose to dismiss a notable amount of inconvenient information even from our daily life.
-
Glenn Tamblyn at 19:19 PM on 19 July 2013Carbon Dioxide's invisibility is what causes global warming
funglestrumpet, try this description.
- Atoms have a property called Electronegativity. This essentially describes how strongly an atopm holds its electrons to itself. Oxygen is strongly electronegative, Hydrogen much less so for example
- When aroms are combined to form molecules, differences in the electronegativity of the component atoms can mean that the electrons from all the atoms in the molecule may tend to cluster bit closer to the more electronegative atoms. As a result some molecules can have what is known as a charge separation across the molecule. One side of the molecule is somewhat negative and the other side is somewhat positive. This can't happen for symetrical molecules such as O2 or N2 - this is why they aren't GH molecules.
- The bonds that link the atoms in a molecule together aren't rigid, they are flexible. So the atoms can jiggle around on the ends of their bonds like balls on springs.
- So with a charge separation and 'jiggling', we end up with electric charges that are in motion. In particular, charges that are accelerating. Maxwells Equations that describe all electrical activity tell us that acelerating electric charges can generate Electro-Magnetic Radiation. A transmitter for example works because electrons are sent charging backwards and forwards along a wire, 'launching' EM radiation into space. The movement of the charges on the end of the molecular bonds are doing the same thing. When a GH molecule radiates some EM Radiation, it is acting just like a transmitter.
- Conversely, when EM radiation passes over an electric charge it can set that charge into motion. This is how a receiving antenna works - the EM radiation passing by sets the electrons racing in the antenna. So to for those charges on the molecular bonds; some EM RAdiation can set them jiggling faster. So when a GH molecule absorbs some EM radiation, it is acting just like a receiver.
- So when a GH molecule absorbs some energy from a photon of EM Radiation, the energy of that photon gets converted into Kinetic energy of motion for the atoms in the molecule.
-
Glenn Tamblyn at 18:41 PM on 19 July 2013A detailed look at Hansen's 1988 projections
And add that he used UAH satellite data rather than the results from RSS that show nerly twice as much warming.
Sometimes ya just gotta luv how creative some skeptics can be with data. Cherry farmers every single one of them.
-
scaddenp at 18:10 PM on 19 July 2013A detailed look at Hansen's 1988 projections
"Some of your graphics are innacurate". That would be one of the funnier comments we have seen.
-
old sage at 18:07 PM on 19 July 2013Trenberth on Tracking Earth’s energy: A key to climate variability and change
I'd just like to wrap up this exchange by saying there is evidence of energy exchange between the outer plasma and earth and it would be a very brave man who would deny its possibility. So more to be done, look up Van Allen for those interested.
If the earth only had O2 and N2, there would still be a 'greenhouse' effect, their failure to absorb and emit means their take up by conduction and convection could only be lost through transport to a cooler place thus minimising the extremes of an empty atmosphere. I am surprised that you cannot look up tables of concentration v penetration depth for at least a few of the characteristic absorbing frequencies to give some idea of when absorption is 100 %. We might well be there and only soot particles be now contributing to the absorption of additional frequencies. -
Tom Curtis at 16:30 PM on 19 July 2013A detailed look at Hansen's 1988 projections
Bob Loblaw @130, you missed the outragious claim that Scenario A was what "actually occurred". Given that CO2 concentrations, as indeed all other GHG concentrations were still below the Scenario B values in 2010, and the total GHG forcing was less than that in scenario B, such a claim cannot have been honestly made. It was either made in ignorance of the data, and hence what actually happened, and is dishonest in implicitly claiming that knowledge, or it is more directly dishonest in that the person making the claim knew it to be false when they made it. As you say, very illuminating.
-
Bob Loblaw at 14:09 PM on 19 July 2013Trenberth on Tracking Earth’s energy: A key to climate variability and change
Phillippe, a 252, a dit tout qu'il faut dire.
Tom: I expect the "Sage" is a spice, not an IQ. A condiment accompanying large quantities of turkey, which is what his posts are looking like.
Old Sage: I have spent years measuring the IR radiation you say "looked right" at 45 W/m2, and it was obviously wrong to me. I have also spent many years measuring the convective/turbulent energy fluxes you talk about, and you are obviously wrong about those, too. You appear to be the only one your vast misunderstandings aren't obvious to.
I think Old Sage has gone deep into troll territory. I suggest DNFTT.
Prev 885 886 887 888 889 890 891 892 893 894 895 896 897 898 899 900 Next


