


 Arguments


Recent Comments
Prev 888 889 890 891 892 893 894 895 896 897 898 899 900 901 902 903 Next
Comments 44751 to 44800:
-
tcflood at 14:29 PM on 4 June 2013Another Piece of the Global Warming Puzzle - More Efficient Ocean Heat Uptake
Let me quickly add that I just found the "Trenberth can't account for the lack of warming" thread. I don't mean to say that the energy balance and ocean heating are not important, (they are very much so). It's that my working theory is that his comment was probably born of the facts that he may not have been working with an accurate number for the TOA net radiation, and there may not have been good data on ocean heat content at that time.
-
KK Tung at 14:16 PM on 4 June 2013The anthropogenic global warming rate: Is it steady for the last 100 years? Part 2.
In reply to post 117 by Dumb Scientist: I have to admire your single-minded determination to "prove" that the result in Tung and Zhou (2013) somehow had a technical flaw. You had created a highly unrealistic case and tried to demonstrate that the Multiple Linear Regression (MLR) method that we used gives an underestimate of the true anthropogenic trend most of the time. Before we start I need to reiterate the basic premise of parameter estimation: if A is the true value and B is an estimate of A but with uncertainty, then B should not be considered to underestimate or overestimate A if A is within the 95% confidence interval (CI) of B. I previously discussed this problem in my post 120 addressing Dikran Marsupial's MLR analysis in his post 57.
Not taking CI of the estimate into account is not the only problem in your post 117. A more serious problem is your creation of an almost trivial example for the purpose of arguing your case. Your synthetic global temperature (denoted "global") is fine. It contains a smooth accelerated warming time series (denoted "human"), a smooth sinusoidal natural variation of 70 year period (denoted "nature"), plus a random noise, which contains year-to-year variations:
global=human+nature+rnorm(t,mean=0,sd=0.2)
Your synthetic North Atlantic temperature (denoted "n_atlantic") is exactly the same as "global" but for a small "regional" noise of standard deviation of 0.1, half of that of global mean:
n_atlantic=global+rnorm(t,mean=0,sd=0.1)
I said this is an almost trivial example because if this small "regional" noise were zero it would have been a trivial case (see later). Even with the small regional noise, your n_atlantic is highly correlated with your global data at higher than 0.8 correlation coefficient at all time scales. This is unrealistic because it is highly unlikely that a high frequency noise in North Atlantic also appears in the global mean. For example, a blocking event that makes Europe warmer in one year should not show up in the global mean. This defect is caused by the fact that each wiggle in the global noise also shows up in your n_atlantic by your construction. To make your synthetic data slightly more realistic while retaining most of their features that you wanted we could either increase the standard deviation of the regional noise from 0.1 to 0.3---this change is realistic because the regional variance is always larger than the global mean variance:
(1) n_atlantic=global+rnorm(t,mean=0,sd=0.3)
Or we could retain the same combined standard deviation as your two noise terms in n_atlantic, but from a different draw of the random variable than the random variable in global:
(2) n_atlantic=human+nature+rnorm(t,mean=0,sd=sqrt(0.2^2+0.1^2))
For both cases we repeated your MLR and found that the true anthropogenic warming of 0.17 C per decade is correctly estimated to lie within the 95% CI at least 93% of the time for case (1) and at least 94% of the time for case (2). This conclusion is obtained by 10,000 Monte Carlo simulations.
The reason I said above that your example is almost trivial is that except for the small regional noise, n_atlantic is the same as global. The AMO index that you defined is n_atlantic minus its linear trend. So global minus n_atlantic is deterministic (when that small regional noise is absent) and is equal to the linear trend. You do not need MLR to show that when your AMO is regressed away what is left is the linear trend 100% of the time.
You can also make your example less deterministic and hence less trivial, by smoothing your AMO index as we did in our paper. Even with everything else remaining the same as in your post 117, you would find that with this single change in your procedure the true value of the anthropogenic warming rate is found to lie within the 95% CI of the MLR estimate 2/3 of the time.
In our PNAS paper, we said that because of the importance of the results we needed to show consistency of the results obtained by different methods. The other method we used was wavelet. Applying the wavelet method to your example and to all the cases mentioned here we obtain the correct estimate of the true value for anthropogenic warming rate over 98% of the time. The wavelet method does not involve detrending and can handle both linear or nonlinear trends.
For the realistic case considered by us in our papers, the anthropogenic warming rate was found to be approximately 0.08+/-0.02 C per decade by the two methods, which gives us confidence that our result was not affected by a particular method. The smaller error bars (compared to your unrealistic example) bound the true value far below the value of 0.17 C per decade of Foster and Rahmstorf (2011).
-
GreenCooling at 13:46 PM on 4 June 2013It's CFCs
As much as it pains me to correct such an eminent and respected scientist, I must humbly submit that Prof David Karoly is mistaken in saying on the ABC radio "AM" story cited by Tom @9 that "The replacement chemicals for chlorofluorocarbons are hydrofluorocarbons, which are used as refrigerants, have already got as large a greenhouse influence as the reductions in the chlorofluorocarbons.
As established by Velders et. al. Science (2012) "Preserving Montreal Protocol Climate Benefits by Limiting HFCs" (and reinforced by the 2011 UNEP Synthesis Report "HFCs: A Critical Link in Protecting the Climate and the Ozone Layer" ) the climate benefit inadvertantly acheived by phasing out CFCs to protect the ozone layer has been significant, yet is likely to be lost in coming decades if we fail to take effective action to prevent rapidly rising emissions of HFCs. The HFCs horses have not yet all bolted, but it is time to shut the gate.

Velders et.al. (2012) put it like this: "Total avoided net annual ODS emissions are esti- mated to be equivalent to about 10 Gt CO2/ year in 2010, which is about five times the annual reduction target of the Kyoto Proto- col for 2008–2012 (5). This climate benefit of the Montreal Protocol may be reduced or lost completely in the future if emissions of ODS substitutes with high GWPs, such as long- lived HFCs, continue to increase."
Preserving the climate benefits of the Montreal Protocol by urgently phasing out HFCs with a mix of policy tools including strict regulation such as end use bans, carbon pricing levies and inclusion in the Montreal Protocol to drive concerted global action is the largest, quickest, cheapest and most effective tool in the emissions abatement policy shed. But as atmospheric HFC concentrations continue to rise, time is running out, and greater attention to the non-CO2 forcers is required now.
Natural refrigerants such as ammonia, carbon dioxide and hydrocarbons stand ready to provide the needed solutions to meet our cooling needs, and the chemical companies that caused the CFC, HCFC and HFC problems have a new range of patented and attractively branded low-GWP 'HFO's' they are pushing to see adopted by anyone who still thinks they deserve to continue to be rewarded for doing so.
Prof Karoly is completely correct in saying "in fact, the global warming influence of these chemicals, the hydrofluorocarbons, is already growing more rapidly than the reductions in chlorofluorocarbons" (although he could have added that hydrochlorofluorocarbons, HCFCs, are also CFC replacements and are still rapidly increasing, in spite of being subject to a Montreal Protocol driven phaseout), but there is still more we could do to increase the reductions of CFCs & HCFCs by recovering them from the pipework and foams of our dead fridges and airconditioners respectively.
Lamentably few scientists understand the climate threat posed by HFCs, and fewer still are prepared to speak out about the need to urgently avoid their use and to rapidly embrace the readily available environmentally benign rerigerant solutions.
If we are to avoid the projected greenhouse impacts of HFCs wiping out those acheived by the CFC phaseout, it would be very helpful if Prof Karoly and others of similar standing were able to assist in clarifying the imperative of acting now to rapidly reduce the use and emissions of Ozone Depleting Substances and Synthetic Greenhouse Gases.
While Lu is completely wrong about CFCs, the debate now required is a good opportunity to correct the widely held yet mistaken notion that the F-gas problem is fixed.
-
tcflood at 13:13 PM on 4 June 2013Another Piece of the Global Warming Puzzle - More Efficient Ocean Heat Uptake
To anyone who might have the time and interest to reply.
JoeT @4 says Stephens et al. (2012) has the TOA imbalance at 0.6 +/- 0.4. The way I read the paper it looks like 0.5 +/- 3.1 Wm^-2. Can anyone explain if either of us is correct?
Where the uncertainty bars on the TOA net radiation bars come from for a model result.
On other sites I have seen the contention that the Trenberth “missing heat” was not a meaningful issue because of the large uncertainty in the TOA net radiation. I would be very interest in you take on this.
-
scaddenp at 09:54 AM on 4 June 2013Imbers et al. Test Human-Caused Global Warming Detection
Paul D - for modelling the difference, see Hansen 2005 "Efficacy of climate forcings"
-
jmorpuss at 09:30 AM on 4 June 2013Imbers et al. Test Human-Caused Global Warming Detection
If Atlant http://www.australianrain.com.au/assets/files/PDF/StatisticalModellingRainfall.pdf uses the electron released by the antenna to seed clouds, how much seeding dose high voltage power lines create ?
-
michael sweet at 09:28 AM on 4 June 2013Imbers et al. Test Human-Caused Global Warming Detection
Stealth,
The human contribution is not only GHG. Aerosols are also included as a human forcing. Keep in mind that aerosols are a negative forcing. That means that the GHG effect is more than 100% of the measured warming. The rest of the forcings add up to peanuts in the long term (probably negative). When coal is scaled back the aerosols will quickly be removed from the equation. That means more warming at first when less coal is used.
It sounds to me like you have just started looking at AGW. Read a lot more before you reach conclusions. There are a lot of open threads here at SkS.
-
Rob Honeycutt at 08:53 AM on 4 June 2013Imbers et al. Test Human-Caused Global Warming Detection
Stealth... If you're interested in the topic, you should definitely check out this lecture from Dr Richard Alley. It's a nice overview of climate science. And Alley's a pretty entertaining speaker.
http://www.agu.org/meetings/fm09/lectures/lecture_videos/A23A.shtml
-
Paul D at 08:44 AM on 4 June 2013Imbers et al. Test Human-Caused Global Warming Detection
Out of interest has there been any modelling in which CO2 levels are stable and solar input isn't?
I would think that the resulting changes would be different to that of CO2 changing, eg different types of weather patterns, different impacts on warming in different regions etc.
-
KK Tung at 08:33 AM on 4 June 2013The anthropogenic global warming rate: Is it steady for the last 100 years?
MY reply to Dikran's post 57 can be found here.
http://www.skepticalscience.com/news.php?p=3&t=123&&n=1975
-
scaddenp at 08:03 AM on 4 June 2013Imbers et al. Test Human-Caused Global Warming Detection
I dont think any model assumes "Sun and Other are that stable". Solar input has been measured since 70s and inferred from proxies before that etc. If you look at the IPCC WG1 report, you can see what the models use for the various forcings and how these have changed over time. The references will take you to the papers that tell you how these are estimated. You might want to look at Benestad and Schmidt 2009 for a statistical look at the climate and solar forcings.
-
Kevin C at 07:51 AM on 4 June 2013Imbers et al. Test Human-Caused Global Warming Detection
Well, if you are proposing a strong solar impact on temperature, then you have the problem that solar output has declined over the past 30 years when the climate has been warming most rapidly. If you want to argue for a stronger solar term, you are also arguing for a stronger anthopogenic contribution.
-
StealthAircraftSoftwareModeler at 07:15 AM on 4 June 2013Imbers et al. Test Human-Caused Global Warming Detection
Okay, I think I now see the baseline issue. I think a better way to say it is that the zero line on the top temperature anomaly is around 1985. In order to get to the temperature for any given date (future or backward) then add up all the component effects of ENSO, VOL, SUN, ANT, and Other. It does appear that if you add these up then you can compute the temperature for the second date. For example, to get the temperature for 1950 from 1985, we take the temperature anomaly of 0 deg C and add -0.1 deg C for ENSO component at 1950, then 0 for VOL, then about 0 for SUN, then about -0.3 or -0.4 for ANT, and about 0 for Other. Then we arrive at about -0.4 or -0.5 for 1950, which matches the top temperature graph. Is this correct? If so, thanks for taking the time to explain it.
I’ve done a bit of research into AGW just for fun. I’m not a “denier” per se since I’m sure CO2 does absorbs some IR wavelengths; I model some of this in aircraft detection and sensor computation for my job. My main question is “how much has CO2 contributed to global warming?” This set of charts seems to indicate that GHG is all of it over the last 100 years since all the charts (except ANT) wiggle about their respective zero line. I have a hard time believing that that Sun and Other are that stable. If you assume they are stable, then the conclusion has to be that GHG is the problem. I am curious as to how scientists have split out and determined that the Sun and Other are that stable.
-
Rob Honeycutt at 06:59 AM on 4 June 2013Imbers et al. Test Human-Caused Global Warming Detection
Sealth said... "That, in my book, isn’t trivial or negligible, so I do not see how you can make that claim."
Yes, it's not trivial if you are a tiny and highly sensitive piece of electronics several miles above the surface of the earth, or if you're a biological creature floating around in space susceptible to gene damage.
What is being discussed here is the radiative forcing on the climate system. Irradiance from the sun in coming in a ~1340W/m^2, and that varies ~0.25W/m^2 over the course of the 11 year solar cycle. Thus, the radiative change in forcing from solar activity is tiny compared to the net change of 2.8W/m^2 in anthropogenic factors.
-
John Hartz at 06:59 AM on 4 June 2013The 5 characteristics of global warming consensus denial
jdixon1980 #77:
A word of caution -- Trying to think like a die-hard climate denier may be dangerous to one's mental health.
-
Tom Curtis at 05:45 AM on 4 June 2013Imbers et al. Test Human-Caused Global Warming Detection
Stealth @5:
1) Volcanic contribution is not always zero. If you run a line across at the zero level you see that it is mostly positive, only becoming noticably negative near major volcanic erruptions (approx 1905, 1965, 1985, and 1992). The later two mean that the average is near zero over the baseline period as determined by eye.
2) The CME striking Earth in March 2012 was exceptional, but only released 26 billion kWh (93.6 x 10^15 Joules) of energy to Earth's upper atmosphere over three days. That represents an average 0.0007 W/M^2 energy over the three days. Only 5% of that energy actually reached the Earth's surface, the rest being radiated to space. Therefore the CME increased the Earth's energy imbalance for three days by only 10,000th of the minimum current Top Of Atmoshere energy imbalance. I would consider that inconsequential.
-
MA Rodger at 05:39 AM on 4 June 2013Imbers et al. Test Human-Caused Global Warming Detection
StealthAircraftSoftwareModeler @5.
Concerning the position of the zero on the vertical axes of figure 1 of the post. You say "That makes no sense based on the other charts" but the position of the zero is actually what makes those six panels sensible.
The top panel has its zero point set by the global temperature anomaly based on 1980-2000. As the caption explains - "The remaining panels show the individual temperature contributions to the top panel..." As the top panel of global temperature is well below zero at the start of the series (c -0.65ºC), the sum of all the contributions in the other panels must also total to that same value (of c -0.65ºC).
Because the anomaly base is 1980-2000, a period in which ther was quite a lot of cooling due to volcanic activity, you will find that the panel VOL plots a positive contribution to temperatures for the vast majority of the series. This means that for most of the period 1880-2010, volcanic activity resulted in a higher temperature in comparison with the base period 1980-2000.
Likewise the human impact ANT. Because human positive forcings were less before 1980-2000, the impact of those human forcings will be lower temperatures before that period. To describe it as "cooling" as you do requires the analysis to run backwards in time. Forwards in time, the usual way, 'cold' becomes 'hot' which is usually considered to be 'warming.'
And as plotted, the period 1945-65 is consistent with a rising human contribution.
-
dana1981 at 05:10 AM on 4 June 2013Imbers et al. Test Human-Caused Global Warming Detection
Stealth @5 - see here. In some cases it's perhaps more accurate to say there's no evidence or research supporting a link between your proposed solar variable and global temps.
Whether or not you buy it, Kevin and I are correct on the baselining issue. Just look at the top panel of Figure 1. The panels below add up to the model simulations shown in the top panel. The top panel has a negative temp anomaly before ~1970. All of the lower panels are plotted in terms of temp anomalies as well. It's just a baselining choice issue.
-
KR at 05:04 AM on 4 June 2013Imbers et al. Test Human-Caused Global Warming Detection
Stealth - Regarding zero point: If you are examining correlation/causation, the only thing that matters is the change, the anomaly. Baseline value makes no difference whatsoever for such studies.
Regarding solar winds and coronal mass ejections (CME): solar winds vary time-correlated with total insolation (TSI), any effect from solar wind appears (is folded in) as a larger contribution from the 11-year solar cycle, a larger solar attribution.
The energy in a CME is roughly that of 1/6 second of total solar output, and few of them actually strike the earth - not much of a contribution. And the frequency of solar flares is also tied to the 11-year solar cycle - that would again just fold into causation studies as a larger solar attribution.
-
Dumb Scientist at 04:10 AM on 4 June 2013The 5 characteristics of global warming consensus denial
(Moderators: This is the second time one of my comments showed up blank. I think it's happening when I type into the source box and don't click "basic" to preview before hitting submit.)
jdixon1980 @77: Stephen Schneider and Marshall Shepherd both pointed out that scientists who are only motivated by funding would deny that the science is solid. That would keep the gravy train coming: "the science is so uncertain; we need more funding."
Also, the recent consensus project shows that most papers in Web of Science containing the phrase "global climate change" don't bother to address human causation, just like most astronomy papers don't bother to address the fact that the Earth orbits the Sun.
If scientists were as motivated by funding as the conspiracy theorists suggest, more papers would take positions on human causation in order to get more of the funding gravy train.
-
StealthAircraftSoftwareModeler at 03:58 AM on 4 June 2013Imbers et al. Test Human-Caused Global Warming Detection
Can you respond with some links that point me to some of this scientific literature that asserts that solar wind, CME, etc have a negligible effect on climate? I am having a hard time believing this claim and I would love to see how someone proved this. I like to follow CME and solar weather for auroras, and the last X class CME that hit the earth dump more energy into the upper atmosphere in 24 hours than has been released by all of mankind over all of history. CMEs set up huge electrical currents in the ground and wires and can knock out the power grid, fry satellites, and force astronauts into protective and shielded quarters on the ISS. That, in my book, isn’t trivial or negligible, so I do not see how you can make that claim.
I’ve done a quick Google search and haven’t found any such documentation supporting your claim. Wikipedia states, “The IPCC acknowledges that there is a low level of scientific understanding with respect to solar variation.” (http://en.wikipedia.org/wiki/Solar_variation under the “Effect on global warming.”) I doubt the IPCC would say this if there was clear science to the contrary, so I really look forward to your references.
As for the zero point, still just don’t buy that the zero point is a re baseline for comparison as you can Kevin state. That makes no sense based on the other charts. All other factors (ENSO, etc) are relative to zero showing how they added or subtracted from the global temperature. Note how VOL is always negative, which makes sense. A volcano burps out a bunch of aerosols which reflects some sun light and cools the earth some amount. The ENSO can warm or cool the planet and they show that in their chart.
If you look at the five charts, you can see a global cooling trend from 1945 to about 1965. ENSO is near zero over this time span, VOL is also zero, and the SUN and Other are always near zero. In order to have cooling from 1945 to 1965, then ANT has to be negative as the authors have clearly shown on their chart, otherwise things just do not add up. If ANT is related to GHG, and GHG always warm the planet, then the ANT chart should never be negative. Hence the reason this paper seems incorrect to me.
-
jdixon1980 at 03:06 AM on 4 June 2013The 5 characteristics of global warming consensus denial
John Hartz @67 - I think the denial rationale based on "strings attached" to funding is a bit more subtle than simply alleging an explicit, quid-pro-quo arrangement like, "we provide funding, you provide evidence and explanations supporting AGW." Their rationale, as I have heard it explained, is that climate scientists live in fear of the entire field becoming obsolete (or at least massively downsized) if they acknowledged the alleged "truth" that there is no AGW, because then there would be no crisis to contend with and money would be better spent elsewhere. Therefore, they have all agreed, either tacitly or explicitly, to falsify, manipulate, and/or explain away data that does not tend to support AGW, on a massive global scale.
This cynical theory is not so easy to refute simply by saying that academic researchers are not paid huge salaries - one might even argue that living on a low income makes you all the more dependent on and defensive of the income you do have, because you are not able to put much away as a safety net. Therefore, I don't believe that it is so easy to refute this type of conspiracy theory in a framework of cold, amoral, economic self-interest.
What makes the theory so implausible to me is precisely its extreme cynicism. I simply cannot believe that 97% of the thousands of researchers in an entire field of science are so profoundly corrupt that they would devote their careers to systematically publishing lies. The economics of academic research science do also tie into my view, in that I think self-selection would tend to remove most people who would so compromise their morals for financial gain from the pool of people who end up in a career that they knew from the start would not be very lucrative.
But that said, I even doubt that 97% of business executives are that corrupt. You will sometimes get this retort from a "skeptic"/denier conspiracy theorist: "How can you assign only noble motives to scientific researchers and only evil motives to corporations and/or their executives?" Thus trying to turn tables and make you look like the conspiracy theorist. But this is a misleading comparison. Even if it is the case that 97% of fossil fuel executives publicly deny AGW (I don't know that in reality the figure is that high), it would not be analagous to what they are accusing scientists of, namely, systematically distorting the truth in their field of expertise. At least oil executives could be excused for misunderstanding the science of AGW because it is not their expertise. What skeptics/deniers are accusing the climate science community of, on the other hand, is far more damning - knowingly and deliberately lying to the public about a subject that they understand better than anyone else, such that there is no higher authority to step in and correct them! It would be more analogous to 97% of oil execs, for example, systematically lying to their shareholders about their reserves/assets, their revenues/costs, their business plans/strategies, their negotiations/projects, their "prospectus," or whatever it is that they understand better than anyone else.
It is very, very hard to reach someone who is cynical enough to believe that sort of thing. Case in point - one of my coworkers is an adamant AGW denier (which, incidentally, is what got me interested in actively researching the topic - before talking to him, I didn't expect to ever encounter an educated person who held such views, and so it kind of woke me up and spurred me to action). After one of the recent mass-murder tragedies, I think it was either Newtown or the Boston Marathon bombing, I overheard him saying to someone in the office that he was surprised that this kind of attack didn't happen more often than it does, given that there is no way to be 100% secure against it. In contemplating these words, I found myself thinking that I am not surprised. Rather, I think that the most obvious explanation is that people who are so mentally disturbed (or what he would probably call "evil") to do something so terrible are few and far between. For the profoundly cynical, however, there often must be some other hidden explanation, if the most obvious explanation is not nefarious enough.
-
dana1981 at 02:25 AM on 4 June 2013Imbers et al. Test Human-Caused Global Warming Detection
Stealth @3 - the solar contribution appears 'stable' because the change in solar forcing is so small compared to the change in GHG forcing. And there is no evidence that solar wind, CME, etc. have a non-negligible impact on global temperatures. That's not an assumption, it's what the scientific literature says.
Kevin @2 is also correct about the baselining being the reason some of the values are negative.
-
StealthAircraftSoftwareModeler at 02:00 AM on 4 June 2013Imbers et al. Test Human-Caused Global Warming Detection
Having gone and looked at the paper itself, I do not get the impression that the 0 point is meaningless. In order to extract the components (ENSO, Volcanoes, AGW, Sun, Other) of the temperature change, they must conclude that the AGW component prior to 1985 was negative in order to get all the numbers to "balance." That doesn't seem right to me.
I guess I can understand that they can pull ENSO and Volcanic effects from the global temperature record based upon physics modeling, but how did they separate out Sun and Other effects from ANT? This shows that the Sun is very stable – perhaps it is in total solar intensity, but the Sun does a bunch of other things that may affect the climate – like solar wind, coronal mass ejections (CME), magnetics fields, to name a couple of major ones. These clearly are not very stable and are highly related to sun spots and the solar cycle. If you assume the sun is stable and other factors are stable, then I suppose you can easily conclude the ANT is a major player. But what if the Sun and Other are not as stable as assumed? Then the ANT contribution would be much lower.
-
Dikran Marsupial at 01:08 AM on 4 June 2013CO2 increase is natural, not human-caused
Falkenherz to add to what MA ROger has already said, if you want a specific mechanism, the transport of carbon dioxide between the atmosphere and surface oceans is proportional to the difference in partial pressure of CO2 between air and ocean. Therefore if we increase the partial pressure of CO2 in the atmosphere (e.g. by burning fossil fuels) then this difference increases, and more CO2 passes from atmosphere to the ocean than in the other direction. This causes the oceans to take up more CO2 until the partial pressures are in equilibrium again.
David Archer has written a very good primer on the carbon cycle, which is well worth a read.
-
MA Rodger at 00:59 AM on 4 June 2013CO2 increase is natural, not human-caused
Falkenherz @2.
If we say there was pre-industrial equilibrium with 280ppm CO2 by volume, NE-NA=0, but the natural carbon cycle is still at work. NE=NA= 770 GtCO2 pa.
Now we are at 400ppm having pumped something like 2,200 GtCO2 into the atmosphere over the previous century or so and seen a little over half of it get absorbed by the oceans and biosphere, if we stopped emitting tomorrow (HE=0), equilibrium will not be achieved for a millenium or so. The eventual level of atmospheric CO2 would be somewhere near 340ppm.
Archer et al 2009 is usually seen as a pretty definitive study on the subject.
-
Kevin C at 00:56 AM on 4 June 2013Imbers et al. Test Human-Caused Global Warming Detection
No, the zero point on that graph is meaningless. They've rebaselined everything so the mean on 1980-2000 is zero - presumably for comparison purposes.
-
StealthAircraftSoftwareModeler at 00:38 AM on 4 June 2013Imbers et al. Test Human-Caused Global Warming Detection
Am I reading Fig 2 correctly? It appears that this chart is saying that the human contribution before 1985 was negative, which implies cooling. That doesn't seem to make sense to me. I thought that most of the warming since 1900 was man made?
-
Dikran Marsupial at 00:36 AM on 4 June 2013The anthropogenic global warming rate: Is it steady for the last 100 years? Part 2.
I am no longer confident that my MATLAB programs actually do repeat the analysis in the JAS paper, at least it is difficult to reconcile the explanation given in Prof. Tung's first SkS post with the description in the paper (although the description in the paper seems rather vague).
It seems to me that the actual regressors used are: ENSO, volcanic, linearly detrended AMO and a linear trend acting as a proxy for anthropogenic forcing. So I shall modify my thought experiment accordingly.
Again, let us perform a simulation of 150 years
T = (1:150)';where again the anthropogenic forcing is quadratic, rather than linear
anthro = 0.00002*(T + T.^2);
and the effect of known natural forcings and variability (other than AMO) is sinusoudal
natural = 0.1*sin(2*pi*T/150);
As before, the observations are a combination of natural and anthropogenic forcings, but does not depend on AMO in any way
observations = anthro + natural + 0.1*randn(size(T));
Instead, AMO is a consequence of temperature change, rather than a cause
AMO = 0.4*anthro + 0.5*natural;
We can use regression to estimate the true linear rate of warming due to anthropogenic forcing
X = [ones(size(T)), T];
[beta,betaint] = regress(anthro, X);which we find to be 0.03 +/- 0.001 degrees K per decade.

Again, we linearly detrend the AMO signal, in order to remove the anthropogenic component.
X = [ones(size(T)), T];
beta = regress(AMO, X);
AMOd = AMO - beta(2)*T;
Next, lets perform the regression exercise:
X = [ones(size(T)) natural-mean(natural) AMOd-mean(AMOd) T-mean(T)];
[beta,beta_ci,residual] = regress(observations, X);
model = X*beta;
The model provides a good fit to the data:

The regression coefficient for AMOd is 2.7685 +/- 1.2491, note that this interval DOES NOT contain the true value, which is zero.
The regression coefficient for the linear trend is 0.0011 +/- 0.0010, which does not contain the 'true' value of the linear trend due to anthropogenic emissions (0.003).
Following the procedure, we add on the residual to the linear component, and compare it with what we know to be the true anthropogenic influence:
deduced_anthro = X(:,4)*beta(4) + residual;we can also calculate the deduced anthropogenic trend
X = [ones(size(T)), T];
[beta,betaint] = regress(deduced_anthro, X);
Note that the residuals have no appreciable trend, so this step does not solve the problem. The deduced anthropogenic trend is less than the true value, and the true value does not lie within the confidence interval.
Now one of the reasons for this failure is that not all of the anthropogenic component of AMO is removed by linear detrending. If we look at the deduced anthropogenic signal (green) we can see that it is rising approximately linearly, rather than quadratically like the true anthropogenic signal (red). The reason for this is simple, the quadratic part of the anthropogenic signal remains in the detrended AMO signal. This means that when we regress the observations on AMOd, AMOd can 'explain' the quadratic part of the anthropogenic forcing on the observations, so it doesn't appear in the residuals.
-
Falkenherz at 00:03 AM on 4 June 2013CO2 increase is natural, not human-caused
Question on the part on "simple accounting":
I assume if we set HE to 0, then NE-NA would result in a deltaC of 0, representing the pre-industrial equilibrum. This puzzles me: Why is nature (oceans, plants, soils) suddenly able to absorb 15 billion tons more CO2 with an atmosphere with ~400ppm, as opposed to the pre-industrial equilibrium with ~200ppm?
-
Falkenherz at 22:39 PM on 3 June 2013Shakun et al. Clarify the CO2-Temperature Lag
Hi! My questions above, from half a year ago, are too muddled and unclear. Just to fully understand the article's "What's going on?":
Complementary to what's going on when an ice age ended: What happened when an ice age was started by the Milankovitch cycle?
-
Tom Dayton at 22:17 PM on 3 June 2013It's CFCs
David Karoly pointed out that the HFC replacements for CFCs have just as much greenhouse effect as CFCs, so the reduction in CFCs that Lu insists has been and will cause cooling, is being offset by HFCs. So Lu's assertion is just plain wrong for that reason, too.
-
Tom Dayton at 22:10 PM on 3 June 2013Hockey stick is broken
There is an awesome new post on RealClimate about tree rings, soundly refuting McIntyre and other critics.
-
kiwipoet at 17:38 PM on 3 June 2013The 5 characteristics of global warming consensus denial
Thanks for these 5 characteristics of global warming consensus denial. I would, tentatively, add a sixth: head-in-the-sandism. A complete refusal to engage. The mind simply shuts down as soon as the words climate change or global warming are uttered. Active denial, of the kind outlined in this post, can be met with evidence. The passive denial I am talking about is blind, deliberately autistic. I suspect that if you prodded a passive denier hard enough he/she would have to revert to one or more of the five characteristics outlined. The willfully complacent head-in-the-sand denier is perhaps the most difficult to deal with as no communication is possilbe.
-
[1and0nly] at 16:42 PM on 3 June 2013It's CFCs
An updated rebuttal of the CFC theory needs to be on the homepage ASAP. Some mainstream media are throwing the ridiculous claims made in Lu's new study around as if they were facts (notably The Australian).
-
jyyh at 14:52 PM on 3 June 2013Video: Lake El'gygytgyn, Pleistocene super-Interglacials and Arctic warmth
And this would be why I think southern Greenland will enter a period of constant melt (through winter) in my remaining life time.
-
Bert from Eltham at 11:25 AM on 3 June 20132013 SkS Weekly Digest #22
The denialists are acting far more strangely than usual. They seem to have a consensus that consensus does not matter! Bert
-
citizenschallenge at 11:12 AM on 3 June 2013The 5 characteristics of global warming consensus denial
Psst,
I decided to share this with those skeptical folks at the so-called SkepticForum:
The 5 characteristics of global warming consensus denial
http://www.skepticforum.com/viewtopic.php?f=40&t=20381&p=337071#p337071
Might turn into a raucous discussion ; - }
-
Andy Skuce at 10:27 AM on 3 June 20132013 SkS News Bulletin #14: Alberta Tar Sands and Keystone XL Pipeline
william: There is a small bitumen sand quarry in the Amazon rainforest in Ecuador that I visited years ago; where, just as you suggested they quarry the sand and use it to surface the local roads. It's not exactly ideal as blacktop, but it is cheap and better than mud.
There is a rather repetitive short video of the Ecuador tarsands that somebody posted.
-
KK Tung at 03:58 AM on 3 June 2013The anthropogenic global warming rate: Is it steady for the last 100 years? Part 2.
In reply to post 116 by Dikran Marsupial: My previous attempt at posting a figure on AR4 projection was not successful. A gentleman at Skeptical Science offered to host my figures for me but needed clear copyright for the figurs. I do not currently have the time to search to ascertain the copyright. May I send it to you privately? Or we can wait for me to have more time.
-
KK Tung at 03:52 AM on 3 June 2013The anthropogenic global warming rate: Is it steady for the last 100 years? Part 2.
Minor correction to my post 120: " confidence level" should be "confidence interval".
The last sentence is confusing and should be deleted. I will explain in more detail on Dumb Scientist's post in a separate post.
-
Chris8616 at 03:46 AM on 3 June 2013Video: Lake El'gygytgyn, Pleistocene super-Interglacials and Arctic warmth
How much resolution does the new sediment record reveal? How fast?
And, if with 320 ppm all the ice melts, 350 doesn't seem legit.
-
Andy Skuce at 02:22 AM on 3 June 2013The 5 characteristics of global warming consensus denial
William Haas: I should make the obvious point that The Consensus Project and the associated discussion is centered around a peer-reviewed article published in a mainstream scientific journal. Even if we adopted your narrow definition of what SkS should cover, TCP would still be be within that scope.
-
DSL at 02:01 AM on 3 June 2013The 5 characteristics of global warming consensus denial
Wrong, William Haas. This site is about the communication of climate science to the general public. That task is essentially political (in the broad sense, not the crude RepDem, LibCon, RightLeft sense). Comments are expected to be supported with evidence, preferably that generated through the scientific process.
-
Tom Dayton at 23:18 PM on 2 June 2013It's CFCs
Eli Rabett has commented on the "new" (i.e., recycled) 2013 Lu paper claiming CFCs are responsible for everything.
-
R. Gates at 22:39 PM on 2 June 2013Video: Lake El'gygytgyn, Pleistocene super-Interglacials and Arctic warmth
chriskoz,
There are many factors which go into the unique nature of each interglacial, with the actual combinations of Milanokovitch forcings being one. The rising CO2 levels, which seem to be a positive feedback to the initial Milanokovitch forcing are a good gauge as to the overall temperature of the interglacial, but there are natural negative feedbacks, such as increased rock weathering and decreased dust in the atmosphere that act to remove CO2 from the atmosphere during interglacials. During the current interglacial, the explosive release of CO2, and other greenhouse gases by humans (a virtual human carbon volcano) has overwhelmed all natural feedbacks. On the current trajectory, certainly 450 or 500 ppm seems assured. Absent any massive geoengineering efforts to reduce CO2 in the atmosphere, certainly a Pliocene-like, and even a Miocene-like climate in the coming centuries in which both Greenland and Antarctica are eventually ice free is likely. This rapid shift in climate would be not unlike the shift we saw during the PETM, with the related massive loss of species, of which we are already seeing.
-
MA Rodger at 20:16 PM on 2 June 2013The anthropogenic global warming rate: Is it steady for the last 100 years?
(The previous graphs illustrating Where's Amo? should now also be visible.)
A selection of US States can also be used to create a temperature profile for a North-South band of the country. This is done here to create 4 more temperature records westward across the US. (Eg (1) Ohio, Kentucky, Tennessee, Alabama. (2) Minnesotat, Iowa, Missouri, Arkansas, Louisiana. (3) Montana, Wyoming, Cloorado, New Mexico. (4) Washington, Oregon, Calafornia.) With one exception, the individual state data in each N-S band again provide similar temperature records (the exception being Montana which experiences a cold spell all of its own in the late 40s-early 50s). (The data all has the same E Coast 'de-trending' trend subtracted from them for sake of the comparison.)
The graph below is rather busy but still gives no indication of AMO affecting US temperatures. The 'saw-tooth' profile of the East coast actually amplifies beyond the Appalachians but disappears by the Rockies where, if you really want it to be there, the profile looks a bit like AMO. But, no, it is gone by the West Coast. So Where's Amo?
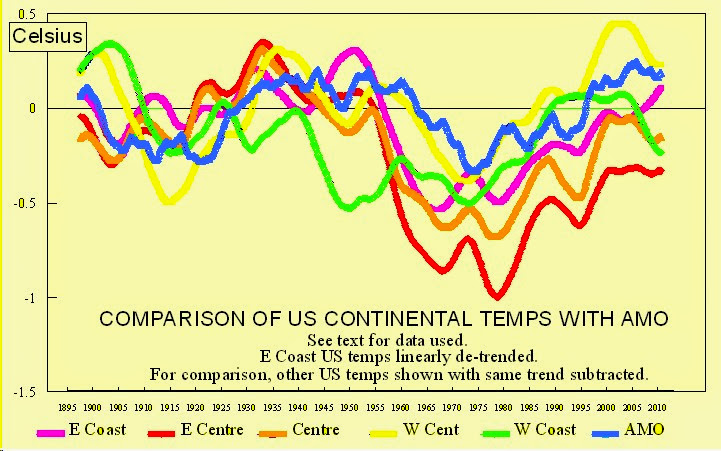
When the US average temperature anomaly is plotted, something a little like AMO starts to appear with a strong amplitude, stronger than AMO. However it still remains different enough not to be AMO, certainly not a temperature profile driven by AMO.
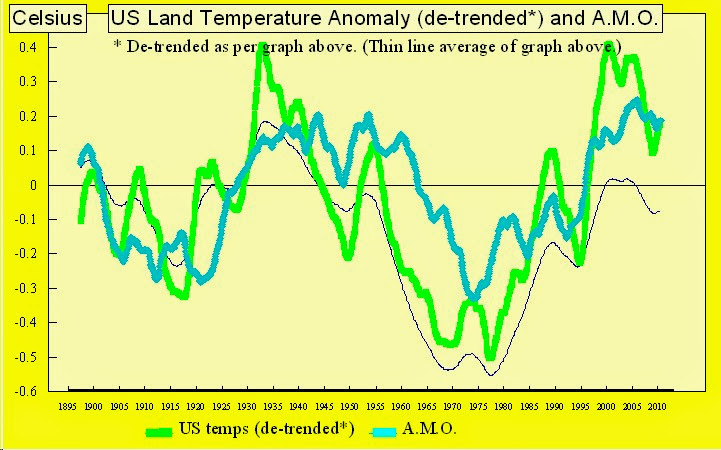
So Where is Amo?
-
Dikran Marsupial at 20:01 PM on 2 June 2013The 5 characteristics of global warming consensus denial
William Haas, the TCP is a survey that tells us where the mainstram scientific position lies on the question of AGW, that is a question about science, not politics. Try reading up on the philosophy of science (e.g. Kuhn), you will find that the emergence of a concensus is essentially what defines a scientific paradigm
-
chriskoz at 19:07 PM on 2 June 2013Video: Lake El'gygytgyn, Pleistocene super-Interglacials and Arctic warmth
Hmm, this stage 11 (420-400ka) ecxeptional warmth in the Arctic (+8 deg according to foraminifera resord) was accompanied by only 300-320ppm CO2. That means Arctic can be emxtremely sensitive. Admitedly, the Milankovic forcings (eccentricity and obliquity) must have been aligned accordingly.
So the question is now, how 400+ ppm today (realisticly 450+ ppm because politicians will not be pressing FF industries to cut emissions more than the agreed maximum target) would affect Arctic, given today's Milankovic alignment? I think 450ppm can easily overpower Milankovic forcings although I don't have numbers to show that. So, essentialy ice-free Greenland is likely in the longer, few-century term?
-
William Haas at 18:58 PM on 2 June 2013The 5 characteristics of global warming consensus denial
This site is suppose to be about science and not politics. Consensus is a political argument and not a scientific one. Accordingly the consensus project should be deleted from this site.
Moderator Response:[JH] You are skating on the thin ice of sloganeering. Please cease and desist.
Also. please read and adhere to the SkS Comments Policy.
Posting comments on SkS is a privelege, not a right.
Prev 888 889 890 891 892 893 894 895 896 897 898 899 900 901 902 903 Next


