


 Arguments


Recent Comments
Prev 916 917 918 919 920 921 922 923 924 925 926 927 928 929 930 931 Next
Comments 46151 to 46200:
-
MA Rodger at 19:46 PM on 6 June 2013The anthropogenic global warming rate: Is it steady for the last 100 years? Part 2.
The question-answer-question sequence on this thread appears in danger of hitting resonance so I wonder if reforming the question would help.
T&Zh13 and KK Tung's first SkS post on this subject has argue coherently that an Anthopogenic Regressor of non-linear form does not impact greatly the results when included in the MLR analysis.
In this thread, it has been demonstrated by Dikran Marsupial & also Dumb Scientist that the MLR analysis is sensitive to an underlying quadratic trend if a sinusoidal signal used in the MLR is linearly detrended when the trend it contains is quadratic.
In the first SkS post KK Tung describes how the best fit for an Anthropogenic Regressor is quadratic in form.
Given this situation, here is the question:-
Why is the AMO used in this MLR analysis still detrended linearly?
-
Dikran Marsupial at 18:09 PM on 6 June 2013The anthropogenic global warming rate: Is it steady for the last 100 years? Part 2.
KK Tung@133 O.K. for the moment lets forget about AMO and concentrate on the technical limitation of MLR that is central to the point being made.
Say we have a variable of interest, Y, and three possible causes, A, B and C, which we have observed over 150 uints of time, T. It so happens that signal A rises quadratically with T:
A = 0.00002*(T + T.^2);
Signal B is sinusoidal in nature
B = 0.1*sin(3.7*pi*T/150);
Signal C is formed from an unobserved signal D plus contamination from A and B
D = 0.05*sin(3.7*pi*T/150);
C = D + 0.5*A + 0.5*B;The signal of interest happens to be a noisy linear combination of A, B and D.
Y = A + B + D + 0.1*randn(size(T));
We can work out the linear rate of increase in Y due to A by linear regression
X = [ones(size(T)), T];
[beta,betaint] = regress(A, X);
ebar = diff(betaint');
ebar = 0.5*ebar(2);
true_A = 10*beta(2);giving

Now say we suspect that the signal C has been contaminated by signal A, so we try linearly detrending C to remove the contamination, giving detrended signal Cd
X = [ones(size(T)), T];
beta = regress(C, X);
Cd = C - beta(2)*T;which looks like this:

We now perform our regression exercise to attribute changes in Y to A, B and Cd, however, rather than using A directly, a simple linear trend is used as a proxy.
X = [ones(size(T)) B-mean(B) Cd-mean(Cd) T-mean(T)];
[beta,beta_ci,residual] = regress(Y, X);
model = X*beta;
Giving a reasonably good fit:

Looking at the confidence intervals for the regression coefficients, we see that
signal B: [0.0248 0.7946]
signal Cd: [0.6460 1.7664]
linear trend: [0.0013 0.0025]note that the confidence interval for the linear trend, which is being used as a proxy for signal A, does not include the true value of the linear trend in Y due to A, which is 0.003.
Again, we combine the linear trend with the residual to determine the deduced linear trend due to A
deduced_A = X(:,4)*beta(4) + residual;
X = [ones(size(T)), T];
[beta,betaint] = regress(deduced_A, X);
ebar = diff(betaint');
ebar = 0.5*ebar(2);
true_A = beta(2);and get this result

Note that the confidence interval for the linear trend in Y due to signal A does not include the true value (0.003).
Prof. Tung, in this synthetic example, do you agree that the MLR regression method significantly underestimates the effect of signal A on signal Y?
-
Glenn Tamblyn at 17:40 PM on 6 June 2013Lu Blames Global Warming on CFCs (Curve Fitting Correlations)
Klapper
If I had to focus on the most important aspect of Lu's paper that seems faulty, it is simply his claim that CFCs correlate with warming because CFCs have dropped and warming has dropped. His basic error is in equating surface temps with total system warming. Surface temps constitute only 2% or so of the total system warming with the bulk of this occurring in the oceans.
If his hypothesis wrt CFCs being the dominant driver of warming, not CO2, is to have any legs then he needs a correlation between CFCs and the major effect of warming which is total heat content. That correlation simply isn't there; CFCs have plateaued, warming hasn't, the oceans are still warming.
He has another problem in that he dismisses the GH Effect impacts of CO2 without ever giving a satisfactory reason why, just vague allusions to Saturation. And his claim that OLR readings don't match what is expected is a flat out misrepresentation of Anderson et al.
Additionally he merely uses correlation to suggest that CFCs can have the magnitude of GH Effect that he claims when he could have used to known properties of CFCs to actually calculate this using any of the many Radiative Transfer Codes available.
In a reply to a criticism of his paper at Climate Science Watch here he makes the following statement (my emphasis)
"5. “In contrast, there is strong experimental evidence of the physical mechanism by which CO2 warms the planet, evidence that (as scientists have mentioned already in response to Lu) dates back 150 years.”
Response: I do not know who has done such experiments."
That is an absolutely stunning statement from a researcher involved with Atmospheric Physics! He actually doesn't know the literature of the field he is operating in!
As for his actual theories about Cosmic Ray genesis for Ozone depletion, I don't have an opinion. It seems most of his peers reject that claim, and have done so in the past but I don't know enough to actually comment on that. But his other claims about CFCs vs CO2 and the GH Effect have more holes in them than a block of Swiss Cheese.
-
Klapper at 15:31 PM on 6 June 2013Lu Blames Global Warming on CFCs (Curve Fitting Correlations)
@Glenn Tamblyn #26:
I meant to say "non-neglible effects" not "no effects". The CERN experiments on cosmic rays are going on because currently there is a very low level of scientific understanding in this area.
Also I didn't say indirect effects are not solar cycle related, I said they didn't necessarily correlate with the secular trend in TSI, or that's what I meant to say. For example what if the peak TSI drops from one cycle to the next but the aa-index does the opposite, even though it still honours the same period.
The point of all this is that I don't think you can ignore indirect solar effects, nor can you assume the relationship between TSI and indirect solar effects is constant over the last 100 years. If I interpret this post correctly, Lu's paper is being de-constructed primarily because TSI can't possibly raise the temperature as much as Lu claims prior to 1970. Yet indirect and direct solar effects are rates as having "very low" and "low" levels of scientific understanding according to the IPCC.
-
Klapper at 15:12 PM on 6 June 2013Lu Blames Global Warming on CFCs (Curve Fitting Correlations)
[DB] "Doesn't AR4 admit indirect solar is poorly understood"
Citation, please.
Table 2.11, Page 202, Chapter 2 of AR4 lists "Cosmic Rays" as LOSU = very low, consensus = 3, evidence = C. Even direct solar effects (irradiance) are listed as LOSU = low, consensus = 3, evidence = B. In section 2.7.1.3, UV modulation is also mentioned but it does not receive extensive discussion, nor is it included in Table 2.11.
-
Glenn Tamblyn at 15:07 PM on 6 June 2013Lu Blames Global Warming on CFCs (Curve Fitting Correlations)
Klapper @24
Dana said:"There's also no research or physical evidence suggesting that indirect solar effects have a non-negligible impact"
You replied: "Doesn't AR4 admit indirect solar is poorly understood. That is we don't know enough to conclude it has no effect?"
Don't you see the logical fallacy in your statement? You have converted Dana's comment involving something with shades-of-grey into a black and white statement then responded to that. That is a strawman argument.
Nobody suggests that there cannot be any impact from indirect effects such as the impact on UV. That mechanism certainly has plausibility, particularly given that the UV part of the solar spectrum varies by a more significant percentage than overall TSI. However admiting the possibility of a mechanism that might have an impact of some magnitude does not necessarily mean that such a mechanism would necessarily have a significant magnitude, which was Dana's point.
If any mechanism associated with the Solar Cycle; TSI, Stratospheric changes due to UV, whatever, exists, one would expect to be able to extract its significance from the data using Multiple Regression. When F+R regress against TSI they are effectively regressing against the Solar Cycle since TSI is very highly correlated with the cycle. So their analysis will necessarily find the impact of all mechanism that correlate with the Solar Cycle.
One thing you could consider is doing similar regression analyses of Solar Cycle versus the various satellite temperature records for the various levels in the stratosphere which you could get from here. You would still need to include Volcanic activity in this since the impact of the El Chichon and Pinatubo eruptions is clearly visible in the stratospheric data.
As for non-Solar-Cycle related indirect solar effects, how do you look for them? What would you be correlating against, and what mechanism would make them plausible; at least solar-cycle related effects have a plausible mechanism? If there is no plausible mechanism, isn't looking for some such hypothetical equivalent to speculating that dust storms on Mars might influence Earth's climate. One can speculate idly as much as one likes, but a conjecture needs at least some degree of plausibility before one even considers it. -
Klapper at 13:30 PM on 6 June 2013Lu Blames Global Warming on CFCs (Curve Fitting Correlations)
@Tom Curtis #21:
'claim F&R2011 "assum[e]........'
Where do I claim that? I'm talking about this Skeptical Science analysis when I say "you", meaning Dana is the one making the assumption that the TSI effect can only be direct, i.e. the delta W/m2.
As for the possibility that indirect solar effects don't correlate with TSI, at least cycle to cycle, that might be true. I'm going to start by checking the aa index vs SSN over the period of the F&R2011 paper.
Moderator Response:[DB] "Doesn't AR4 admit indirect solar is poorly understood"
Citation, please.
-
Klapper at 12:28 PM on 6 June 2013Lu Blames Global Warming on CFCs (Curve Fitting Correlations)
@Dana81 #20:
"There's also no research or physical evidence suggesting that indirect solar effects have a non-negligible impact"
Doesn't AR4 admit indirect solar is poorly understood. That is we don't know enough to conclude it has no effect?
Moderator Response:[DB] "Doesn't AR4 admit indirect solar is poorly understood"
Citation, please.
-
Dave123 at 12:06 PM on 6 June 2013Lu Blames Global Warming on CFCs (Curve Fitting Correlations)
I'm not sure also what UV effects on the stratosphere is supposed to mean. UV is included in the TSI satellite measurements, so it's not like it's missing from the TOA energy budget. Is this some kind of 'wings of the butterfly' effect that is supposed to do something else? Or is this more unicorn chasing....the endless parade of "what ifs" that don't actually formulate a hypothesis.
-
Dave123 at 11:36 AM on 6 June 2013Lu Blames Global Warming on CFCs (Curve Fitting Correlations)
I don't know if the crew here have seen this:
http://science.nasa.gov/science-news/science-at-nasa/2012/22mar_saber/
But there are a few sites that claim this falsifies global warming....because CO2 in the thermosphere is called a "coolant" in the article. But anyhow, I think this is the kind of activity that Klapper may be referring to. The footnote at the end of the article points out:
ootnote: (1) No one on Earth’s surface would have felt this impulse of heat. Mlynczak puts it into perspective: “Heat radiated by the solid body of the Earth is very large compared to the amount of heat being exchanged in the upper atmosphere. The daily average infrared radiation from the entire planet is 240 W/m2—enough to power NYC for 200,000 years.”
-
Tom Curtis at 11:30 AM on 6 June 2013Lu Blames Global Warming on CFCs (Curve Fitting Correlations)
Klapper @19, you yourself say that F&R11 use TSI as a proxy of solar activity, and do not check against forcing. It follows from that that any indirect solar effect correlated with TSI is included in F&R11's TSI regression. To then turn around and claim F&R2011 "assum[e] that TSI is the only effect that solar can have" simply contradicts yourself (in addition to being false). You may, of course, suspect indirect effects that do not correlate with TSI; but if they do not correlate then they weaken, rather than strengthen, the TSI forcing.
-
grindupBaker at 11:24 AM on 6 June 2013Communicating climate change at the Maths of Planet Earth conference
"average layperson thinks of climate as the weather" is the obvious one but I think it's well overdue to also explain that warming is heat, not just the temperature of a miniscule scrap of what's being heated (the bit they see). They'll (I mean most regular bods) easily understand this if you simply explain it clearly. Air is, what, 0.09% of the ecosystem's heat ? and land .085% is it ? Fresh water ~2.5% ? And the top 3% of the oceans is, by definition, 3%.
-
dana1981 at 11:20 AM on 6 June 2013Lu Blames Global Warming on CFCs (Curve Fitting Correlations)
Klapper @19 - no, not even remotely similar situations. F&R used multiple linear regression for all of the primary short-term natural temperature influences (solar, volcanic, ENSO). Lu just randomly scaled up one forcing - an old and inaccurate representation of the forcing at that - ignored all other forcings, and didn't even use any statistics.
There's also no research or physical evidence suggesting that indirect solar effects have a non-negligible impact on global temperatures, especially one that's not correlated with TSI. It would be generous to say your comment is on shaky scientific footing.
-
Klapper at 10:52 AM on 6 June 2013Lu Blames Global Warming on CFCs (Curve Fitting Correlations)
"You can't just choose whatever proportionality is convenient for your argument."
You mean like Foster & Rahmstorf 2011? TSI is only a proxy for solar activity. In their paper F&R also looked at another proxy, SSN, but made no attempt to cross-check theorectical TSI forcing against their coefficient. Why should Lu be held to a higher standard?
By assuming TSI is the only effect that solar can possibly have, you eliminate indirect solar effects which may also correlate with TSI, like UV modulation of stratospheric temperature.
-
Dave123 at 10:51 AM on 6 June 2013Lu Blames Global Warming on CFCs (Curve Fitting Correlations)
@17 - Eli- Sort of reminds me of one Will Happer. Yes? Except of course, Happer hasn't published on climate science....just opined.
And the saturated gassy argument is sooooo old. As Spencer Weart notes- that argument was had between Arrhenius and Angstrom.
-
KK Tung at 08:24 AM on 6 June 2013The anthropogenic global warming rate: Is it steady for the last 100 years? Part 2.
In reply to post 131 and post 132: Of the three examples, two by Dikran and one by Dumb Scientist, the example by Dumb Scientist is logically the most correct. His nature contains what in his mind is the 70-year AMO signal, and that such a signal is present in both his global mean data and his N. Atlantic data. The latter was used to define his AMO index after linearly detrending the n_atlantic data. There is no disconnect between what he thinks in his own mind of what an AMO signal is and what he tells his MLR. In contrast, in Dikran's revised example, the one we are currently debating, his natural has 150 year period. Whether it is 150 year or 70 year period does not matter in this hypothetical example, but it matters what he thinks in his mind is the AMO, especially if he does not tell his MLR what he thinks. In his mind he thinks that the AMO should have a 70 year period, but there is no 70-year period oscillation in his global data nor in his AMO index. His AMO index is simply anthro plus this 150 year natural oscillation, later detrended. In addition, and this fact is important, he has both natural and AMOd as his regressors. In contrast, Dumb Scientist only has one of these two. In Dikran's case, the 150-year oscillation belongs to natural. His AMOd is empty as far as oscillation is concerned. What it contains is mostly anthro linearly detrended, and so it contains mostly a quadratic anthro term. That was why I suggested that his AMOd should be renamed quadratic.
Let's redo his thought experiment after the renaming: The regressors are quadratic, natural and linear. There are no AMO regressor because it is not in the global data, and, in his mind Dikran does not think his 150 year oscillation in natural is an AMO. After the MLR is performed, do we get the right answer? There is no AMO index in the regression and therefore the MLR will not give you any amplitude for the AMO, which has 70-year period and no amplitude in the synthetic data. So there is no contradiction here. His natural regressor yields his 150 year oscillation and thus also gets him the right answer. His quadratic yields the quadratic part of his anthro. His linear yields the linear part of his anthro. The MLR is doing what it is supposed to do.
Now consider the logic of the thought experiment if we now say the quadratic regressor should tell us something about a 70-year oscillation with zero amplitude. In reality quadratic gave us an amplitude for the quadratic term in anthro which is quite large and bounded away from zero. Dikran then concluded that this gives the wrong answer for the AMO. It is wrong, in his mind, because he had given quadratic the name AMOd, and by doing so the MLR should magically know that the AMO should have a 70-year period.
In the observation, the global mean data has a quasi 70-year oscillatory signal. The North Atlantic has a similar 70-year signal. It is the North Atlantic data that is being used to define what we called the AMO. How you detrend it is subject to debate, but the logic of Dumb Scientist's example is clear, when he used the n_atlantic data to define the AMO index, but the logic of Dikran's example is not.
-
EliRabett at 06:14 AM on 6 June 2013Lu Blames Global Warming on CFCs (Curve Fitting Correlations)
Lu is an experimental electron scattering guy who thinks that he can use that to explain everything. He also seems to be a bit of a self promoter. BTW, the CFC+HFC forcint is flat since about 1992, so that is twenty years.
-
Tom Curtis at 06:14 AM on 6 June 2013Imbers et al. Test Human-Caused Global Warming Detection
stealth @34: "I think my bullsh*t sensor is pretty good."
One component of an effective bullsh*t sensor that is often missing is an appropriate respect for expertise. An expert has been succinctly defined as a person who knows all the basic mistakes in their field, and how to avoid them. Ergo the most basic feature of the non-expert is that they do not know how to avoid basic mistakes. That can be simply because the relevant information available to them is limited compared to that possessed by the expert; or because of lack of knowledge of the literature in which the basic mistake they are making was first proposed, then refuted.
This is not to suggest that experts are always right. However, if you are genuine about avoiding bullsh*t your first instinct when you come up with a significantly different answer to that of the experts is to ask yourself, "What am I missing?" The arrogance of AGW "skepticism" as practised at WUWT etc is seen in the failure of this form of self skepticism.
-
Tom Curtis at 06:02 AM on 6 June 2013Imbers et al. Test Human-Caused Global Warming Detection
Stealth @35, by a rough pixel count, there is an approximately 0.15 C increase in temperature due to anthropogenic factors shown in the chart from 1880-1950. That is much smaller than post 1950 but not zero. Others have provided an the data needed on natural forcings over that period. It should be noted that part of the 1910-1940 temperature increase is due to a switch from strong La Nina conditions arount 1910 to strong El Nino conditions around 1940.
There remains, however, a small component of that increase which is not yet explained by either known forcings or ENSO variation. This may be due to problems in the temperature record. Global coverage of SST (in particular) fell significantly during WWI and WWII and immediately after due to reduced the effect of the wars on merchant shipping. It may also be due to an underestimate of the forcing from Black Carbon (BC). Finally, it may also be due to the Atlantic Multi-decadal Oscilation.
Post 1950, natural forcings are negative such that anthropogenic factors represent around 90% of all forcings from 1880-2010 (as shown above). The uncertainty about that is sufficiently large, however, that it could be significantly lower than that.
-
Alexandre at 06:00 AM on 6 June 2013Lu Blames Global Warming on CFCs (Curve Fitting Correlations)
I found a correlation between global temperatures and the quantity of headlines about the private life of celebrities. I think the obscure journal may be interested in it - but I'll see if I get a better offer from Energy & Environment.
Science Daily, here I come!
-
Matthew L at 05:49 AM on 6 June 2013Will Tropical Forests Remain Carbon Sinks?
Interesting paper. It is sort of intuitive that an ecological system as intense as rainforest would already be close to saturation as a carbon sink. What is interesting though is that recent research has shown that the CO2 fertilisation affect, and hence (presumably) the carbon sink potential of plant biomass, is most apparent in arid and semi-arid regions which are already showing rapid greening in response to elevated CO2.
The major benefit in a dry climate of higher CO2 levels is that a plant can get the CO2 it needs from the air with fewer stomata in its leaves. Fewer stomata means less water loss from the leaf and hence the plant can produce the same carbohydrates through photosynthesis with less water (or more carbohydrates with the same amount of water).
Research has been published in Geophysical Research Letters that shows an increase of 11% in green foliage cover between 1980 and 2011, mainly in arid and semi-arid areas. This means that as the rain forests decline as a carbon sink that the slack may be taken up as arid areas green and increase their role as a carbon sink. Isn't nature wonderful!
http://onlinelibrary.wiley.com/doi/10.1002/grl.50563/abstract
-
KR at 05:27 AM on 6 June 2013The anthropogenic global warming rate: Is it steady for the last 100 years? Part 2.
Dr. Tung - I believe that what Dikran has shown with his synthetic data case is that inappropriately detrending (linearly in his synthetic experiment) cyclic forcings, forcings superimposed on nonlinear trending anthropogenic forcings, causes a clear mixing of the signals. And his synthetic data shows a corresponding reduction in attribution to any nonlinear components, errors in identifying known inputs.
I would also agree with his last comment about correct component labeling.
By extension the same method of analysis (MLR), applied in your paper, is subject to the same issues - that a linear detrending of a cyclic signal (AMO) that is potentially a superimposition on a nonlinear trend (anthropogenic and other forcings, known to be nonlinear in sum) can and will lead to false conclusions about anthropogenic attribution.
A simple linearly detrended AMO by definition suffers from an undetermined amount of multicollinearity with nonlinear forcings. Separate methods for identifying the shape of the underlying trends, upon which the AMO is superimposed, must be used to avoid this problem.
-
David Lewis at 04:59 AM on 6 June 2013It's CFCs
GreenCooling: Mario Molina et.al. noted in 2009 in Reducing abrupt climate change risk using the Montreal Protocol and other regulatory actions to complement cuts in CO2 emissions which was published in pnas that:
"The Montreal Protocol is widely considered the most successful environmental treaty, phasing out almost 100 ozone-depleting chemicals by 97% and placing the ozone layer on the path to recovery by mid-century (18). It also is the most successful climate treaty to date..."
-
Glenn Tamblyn at 04:20 AM on 6 June 2013Imbers et al. Test Human-Caused Global Warming Detection
Stealth
In addition to the other comments about 1910 to 1940's warmth, this is interesting from GISS. Warming by latitude vs time (available here):
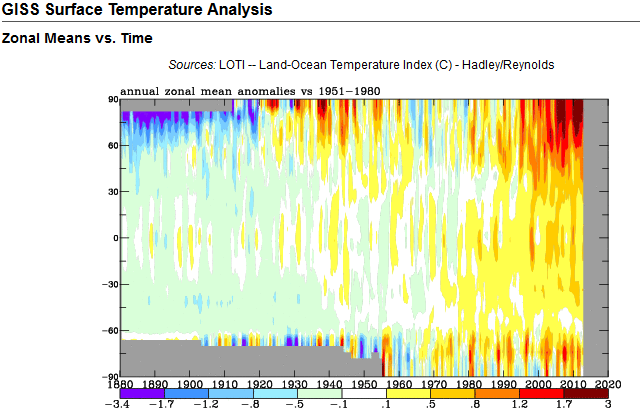
A significant part of the warming was just in the Arctic. Also the station coverage of the Earth was in flux during that period. Stations were being added to the Arctic at that time which previously had no useful coverage. The Antarctic only started getting decent coverage after the International Geophysical year in 1957. I have some doubts about how much credence we can give the 1910-1940's data if there was a regional warming just as station coverage was changing in that very region.
Also there was a definite bias change in the measurement of Sea Surface Temperatures during the years of WWII due to a change in the mix of nationalities measuring SSTs (and thus measurement methods) during the war. This has been partly corrected through an adjustment to those records just recently but it is unclear how completely that has resolved the issue.
-
David Lewis at 03:46 AM on 6 June 2013Lu Blames Global Warming on CFCs (Curve Fitting Correlations)
Harris Farman and Fahey actually used the word "hydrophobic". Duh. One reason CFCs and other ozone destroying substances make it up into the stratosphere is they do not mix with water molecules in the troposphere to be rained out. Lu needs CFCs to appear on the surfaces of the ice particles that make up the polar stratospheric clouds found in Antarctica so the reaction he believes in can take place. Ice isn't liquid or gaseous water, but the Farman paper states the claim "seems very unlikely".
-
Dikran Marsupial at 03:10 AM on 6 June 2013The anthropogenic global warming rate: Is it steady for the last 100 years? Part 2.
KK Tung, wrote "My procedure" found something, but it was not an AMO. The fact that you gave it the name AMOd does not make it an AMO."
Similarly a variable in your MLR analysis is labelled as being AMO but that doesn't mean that it actually is the true AMO signal. As I have pointed out linear detrending does not remove all of the anthropogenic contamination of the AMO signal, nor for that matter does it remove the contamination due to other natural forcings, such as solar and volcanoes. It is this contamination by both natural and anthropogenic forcings that means that some of the warming due to anthropogenic forcing can be misattributed by your MLR analysis to the variable that you have labelled as AMO.
-
KK Tung at 02:46 AM on 6 June 2013The anthropogenic global warming rate: Is it steady for the last 100 years? Part 2.
In reply to post 129 by Dikran Marsupial: I thought I was quite clear already, but it seems that I needed a lesson in communication, or I was trying to be too polite, which hinders communication in forums like this. When I said:
"How do you know the true value for the AMO is zero? Must it be that in your mind you identified the 70-year oscillation as the AMO?''
I meant it as a rhetorical question. The answer of course is that you did not put it in your example. It was entirely in your head, and you did not tell your MLR what you meant by AMO. When you replied :"I know this by construction.". You seemed to miss the irony.
I thought I had explained it:"But by construction your AMOd regressor does not contain any 70-year signal, nor does your observation. In fact there does not exist any 70-year signal anywhere in your example. So it trivially follows that you will not get any 70-year signal by multiple regression. It now becomes a word game on what you call your AMOd. You could just as well call it the "quadratic". Then you always get zero for the nonexistent 70-year AMO cycle in your MLR."
Now in post 129, you continue to miss the point that I was trying to make, but now you think I was missing your point:
"You clearly still do not understand the point of the thought experiment. In the thought experiment there is no AMO influence on observed temperatures, but your MLR procedure DOES find one, even though it doesn't exist. That is the problem.""My procedure" found something, but it was not an AMO. The fact that you gave it the name AMOd does not make it an AMO. Please do your thought experiment again but this time give your AMOd the new name quadratic.
-
tcflood at 02:42 AM on 6 June 2013Lu Blames Global Warming on CFCs (Curve Fitting Correlations)
David Lewis @6
Just to cut down on the confusion factor, you probably mean that CFC's are "strongly hydrophobic."
-
John Hartz at 01:55 AM on 6 June 2013Lu Blames Global Warming on CFCs (Curve Fitting Correlations)
Are the powers-to-be at the Univesity of Waterloo under the thumb of the Harper government?
-
dana1981 at 01:54 AM on 6 June 2013Lu Blames Global Warming on CFCs (Curve Fitting Correlations)
John H @9 - thanks for that link, yes, Gilkson does a nice job debunking this myth as well. I notice he has an Escalator link in there :-)
-
Bob Loblaw at 01:46 AM on 6 June 2013Lu Blames Global Warming on CFCs (Curve Fitting Correlations)
Oops. Make that "Alternatively, languish as a tenured assistant associate professor ..."
-
Bob Loblaw at 01:44 AM on 6 June 2013Lu Blames Global Warming on CFCs (Curve Fitting Correlations)
The usual progression in Canadian universities is:
- hired as an untenured assistant professor
- get tenure, get promoted to associate professor. Sometimes a single step, sometimes two, depending on the university - but usually they happen at roughly the same time. In very rare cases, I have seen faculty get tenure, then sit at the assistant professor level for years.
- continue to develop your fiefdom and accumulate enough papers/grad students/research grants to get promoted to full professor (i.e., "professor", with no assistant or associate prefix). (Alternatively, languish as a tenured assistant professor for the rest of your career.)
On this basis, my guess is that Lu has tenure. Number of publications often counts more than quality...
-
John Hartz at 01:30 AM on 6 June 2013Lu Blames Global Warming on CFCs (Curve Fitting Correlations)
Andrew Gilkson, Earth and Paleo-Climate Scientist at the Auatralian National University, has also writtten a devastating critique of Lu's paper.
Gilkson's critique, Are CFCs responsible for global warming? was posted on The Convesation on June 5.
Gilskson and Dana cover much of the same ground in their respective posts.
-
Rob Honeycutt at 01:22 AM on 6 June 2013Imbers et al. Test Human-Caused Global Warming Detection
Stealth... I may be repeating Kevin and KR, but I think you'll find there to be a general consensus in the research that early 20th century warming was only partly due to anthro-GHG forcing. From ~1940 to 1970 you get a slight cooling due to anthro-aerosols, and then late 20th century is likely all due to anthro-GHG forcing.
I have to say, it sounds like you're taking an appropriately skeptical approach to the issue. It's greatly appreciated. It's hard but we all have to try to check our biases at the door when looking into scientific issues.
-
Kevin C at 01:05 AM on 6 June 2013Imbers et al. Test Human-Caused Global Warming Detection
Stealth: Here's the Potsdam data which was an input to CMIP5 in excruciating detail. link
Start with pages 4-7. Volcanic is on page 45. Solar is on page 46 (note the scales).
-
KR at 00:34 AM on 6 June 2013Imbers et al. Test Human-Caused Global Warming Detection
Stealth - In the early 20th century solar activity was relatively high (positive influence), and even more importantly there was a distinct paucity of volcanic action (less negative influence); notice the flat volcanic graph during that period. There's a SkS thread on this very topic - What caused early 20th Century warming - which is worth looking at.
-
MA Rodger at 00:30 AM on 6 June 2013The anthropogenic global warming rate: Is it steady for the last 100 years?
So where is Amo? Perhaps we should look where he was last reported being seen.
The first graph plots 5-year rolling average of AMO (after Enfield) over the last 130 years along side the three surface global temperature records, all averaged, de-trended and re-based for comparison.So is the wobble in the global temperature records actually AMO? Like 'Where's Waldo?' it isn't just any old kid with glasses in a colourful jumper & bobble hat that we are looking for.

Now these different temperature records do provide differerent breakdowns of the global total. NASA GISS, for instance, provides temperature records for different latitudes of the globe.
The graph below compares such data for different latitudes for the Southern Hemesphere against AMO. I see no sign of AMO there.
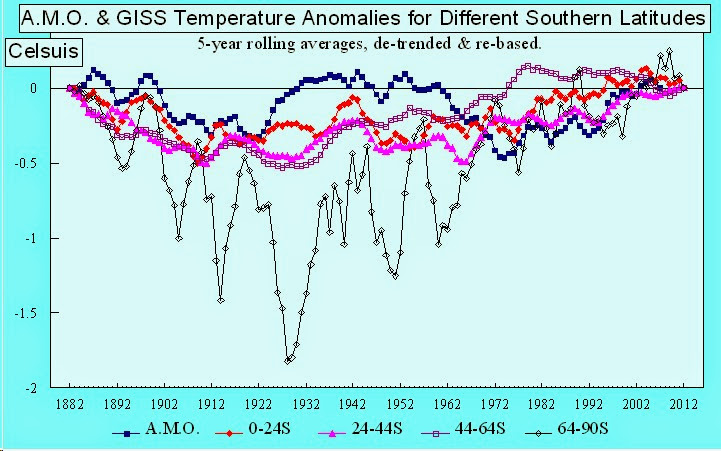
An identical graph but the Northern Hemesphere does show a goodly wobble. So can we see Amo in the Northern Hemisphere?

Perhaps. But here's a thing. The size of those wobbles increase as the Northern latitude increases and the size of the trend that has been subtracted to present the graph also increases with that same increasing latitude, as the fourth graph here illustrates.

So here's a question. If this increase with latitude applies to both wobble and trend, would this not indicate a common source for both of these elements of the global temperature record? If not, what mechanism would provide the same trend for different causes, one AMO-caused the other a global-wide climate forcing. This is a tricky question because according to the proposal before us, AMO does not cause any trend.
-
MA Rodger at 00:15 AM on 6 June 2013Another Piece of the Global Warming Puzzle - More Efficient Ocean Heat Uptake
tcflood @23.
I was much to hasty @21 with my analysis of recent OHC and fell foul of a bit of inadvertent cherry-picking.So we come to agreement. I calculate OHC as per Levitus at 0.5 W/m^2 yielding a global warming of some 0.6 W/m^2.
The graph I mentioned also didn't appear. It cannot be displayed here but only be linked to from its present location (see down link here - it may take 2 clicks 'to download your attachment'.) due to the Google double click.
So Trenberth's missing energy remains missing.
-
StealthAircraftSoftwareModeler at 23:33 PM on 5 June 2013Imbers et al. Test Human-Caused Global Warming Detection
New question about the charts in this post:
The contributing factors (all the ones in the various colors) seem to add up relative to the 1985 baseline for years between 1955 and 2010. If I add up ENSO, VOL, etc to the temperature on the top chart, they all add up. Before 1955 there is component data but it doesn’t produce any temperature movement. From 1910 to 1945 there was a large warming period of almost 1 deg C, but the component values do not reproduce that. The ANT chart also seems to be saying that all ANT effects have been from 1960 until today – is this censuses view on AGW? I thought the AGW claim is that the industrial age and CO2 increase has caused most of the warming. If ANT hasn’t affected temperature from 1910 to 1945, what caused the large temperature increase from 1910 to 1945?
-
StealthAircraftSoftwareModeler at 23:23 PM on 5 June 2013Imbers et al. Test Human-Caused Global Warming Detection
Manwichstick @27
I agree that “incomplete” is a better word for models. My full saying about models is: “all models are wrong, but some are more useful than others.” My group does the best it can in our models, and there can be life and death decisions riding on them (that’s always humbling). All sorts of design trades have to be made, and real time is a major one – a great answer 5 minutes after you are dead is not better than a good answer in 5 seconds.
scaddenp @29
Your question about “evaluating truth” is a good one. I think “wallow” is a bit of a strong negative word, but I understand what you are saying. I read what “the others guys” have to say and examine the data they have. If it makes sense then I incorporate it into my world view. I guess since I don’t believe anyone, and I become convinced of things based on the data and the most creditable explanation of the data. I think my bullsh*t sensor is pretty good. But I also know I have been wrong many times in my life on many things, and have changed positions based on the results, so I feel that I am very open to the facts and what they say. I truly believe that reality has a persistent voice.
So far, what I really like about this site is that everyone seems open and has provide excellent information, and a lot of it. I have to wait until the weekend to review and digest some of it. My day job isn’t paying me to research the climate. :-)
-
Paul D at 21:50 PM on 5 June 2013Imbers et al. Test Human-Caused Global Warming Detection
scaddenp@28
Thanks, that's interesting.
Not a great deal of difference other than higher solar irradience would seem to make it hotter than the CO2 forcing and the Arctic and land masses would be much more hotter than would be the case if the forcing were just CO2 and/or others. -
chriskoz at 18:25 PM on 5 June 2013Lu Blames Global Warming on CFCs (Curve Fitting Correlations)
GFW,
Lu's profile page at UW places him as an associate at the faculty of Physics & Astronomy, and he looks on the picture as a young person (certainly not "emeritus" type ala Singer), nothing about his tenure but I guess as an associate he doesn't have one yet.
One thing is certain, he tries to apply his Astronomy skill to the field where he lacks basic knowledge and it's surprising that he's been able to do it (publish poor work) three times. I wonder, Mike Mann style, if he has certain other affiliations business or political or such, that make him so biased in this filed unknown to him.
-
Glenn Tamblyn at 18:22 PM on 5 June 2013Lu Blames Global Warming on CFCs (Curve Fitting Correlations)
He describes himself as:
Qing-Bin Lu, PhD
Professor in Physics, Chemistry and Biology
Canadian Institutes of Health Research (CIHR) New Investigator
Department of Physics and Astronomy
University of Waterloo
-
David Lewis at 18:22 PM on 5 June 2013Lu Blames Global Warming on CFCs (Curve Fitting Correlations)
Climate Science Watch has a page up entitled Response by Qing-Bin Lu to “Qing-Bin Lu revives debunked claims about cosmic rays and CFCs” On it, Lu says he is not aware of any experimental evidence of "the physical mechanism by which CO2 warms the planet". His actual words were: "I do not know who has done such experiments".
Joe Farman, the first person to observe the Antarctic ozone hole, critiqued Lu's idea that cosmic rays cause it, in 2002 (with Harris and Fahey, in Comment on "Effects of cosmic rays on atmospheric chlorofluorocarbon dissociation and ozone depletion"). Lu's idea then was that CFCs were observed to be in lower concentration over Antarctica therefore cosmic rays must cause this, therefore cosmic rays, not UV photolysis, was the cause of the ozone hole. It was as solid as that. It had something to do with something Lu thought must be going on on the surfaces of the polar stratospheric clouds, i.e. ice particles that ozone scientists suddenly realized were there. He had no measurements. Farman said no one has ever measured anything like what Lu is talking about on the surfaces of ice particles in the stratosphere over Antartica, or in a laboratory, and Lu is not citing measurements now. Farman said CFCs are "strongly hydrophilic" and therefore why should they suddenly be attracted to solid water particles? Farman stated that the observed concentration of CFCs in the atmosphere over Antarctica was consistent with the idea that UV photolysis breaks up CFCs mainly in the tropical and subtropical stratosphere and with what is known about the movement of air from the troposphere to the stratosphere and within the stratosphere.
What amazed me was that the Dean of the Faculty of Science at Waterloo allowed the Waterloo News to publish his statement that he, Terry McMahon, has swallowed Lu's gibberish, hook, line, and sinker. Waterloo has a good reputation in Canada, especially in computer science. If its Dean of Science claims one of the scientists there has come up with a paper overturning 150 years of climate science, it is no wonder that some newspapers covered it. The question is, who were the "peer" reviewers, and how has Lu palmed off his work all these years as something Waterloo would want to be associated with? McMahon must believe Lu is something like Einstein, the discoverer of a new way to see.... No wonder the human race is doomed.
-
Dikran Marsupial at 17:56 PM on 5 June 2013The anthropogenic global warming rate: Is it steady for the last 100 years? Part 2.
KK Tung wrote "Of course when there is no AMO in your data you are not going to find an AMO using the method of multiple linear regression analysis (MLR)."
You clearly still do not understand the point of the thought experiment. In the thought experiment there is no AMO influence on observed temperatures, but your MLR procedure DOES find one, even though it doesn't exist. That is the problem.
-
GFW at 17:49 PM on 5 June 2013Lu Blames Global Warming on CFCs (Curve Fitting Correlations)
Is this guy an actual tenured prof? But not an aging "gone emeritus" type? It's supposed to be really hard to get a professorship at any halfway decent U these days, and Waterloo is more than halfway decent. -
Paul Pukite at 16:25 PM on 5 June 2013Lu Blames Global Warming on CFCs (Curve Fitting Correlations)
The other fitting step that QB Lu from U of Waterloo applies is a crucial 9-year lag from halocarbon increase to temperature effect. Below is my attempt at reconstructing what Lu attempted to do via the 9-year lag. Note that he also uses R instead of R^2 to make the correlation look better. As Dana said, the lag is not there in the OHC data.

-
sylas at 14:55 PM on 5 June 2013Lu Blames Global Warming on CFCs (Curve Fitting Correlations)
The journal IJMP-B is a low impact journal, yes; but it serves well in its particular focus; which is mainly condensed matter physics, superconductivity and the like. The problem is most likely somewhere within the editorial board, allowing this otherwise respectable if low impact journal to be a soft touch for pseudoscientific climate denial. It is something the editorial board really needs to look at seriously.
Declaring my own personal interest: I'm one of the six people who helped put together a response to the nonsensical Gerlich and Tscheuschner (2009) at IJMP-B, with Joshua Halpern as the main author of the rebuttal piece.
-
JohnMashey at 14:26 PM on 5 June 2013Lu Blames Global Warming on CFCs (Curve Fitting Correlations)
1) The journal that published this also published Falsifiation Of The Atmospheric CO2 Greenhouse Effects within The Frame Of Physics, Gerlich, G. and R. D. Tscheuschner (2009). Needless to say, it did not accomplish that goal, but one has to wondre about the journal.
2) The most puzzling is why on Earth U Waterloo, generally a fine scholl in science and engineering, put out big press release on this. Professor ought to be free to publish what they can get accepted ... but I don't think a university is *required* to create a gushing press release for every paper. Sadly, this diminishes U W's reputation in my mind, anyway.
-
jyyh at 14:06 PM on 5 June 2013Lu Blames Global Warming on CFCs (Curve Fitting Correlations)
Thanks Dana for going by numbers dissecting this roadkill of a study.
Prev 916 917 918 919 920 921 922 923 924 925 926 927 928 929 930 931 Next


