


 Arguments


Recent Comments
Prev 945 946 947 948 949 950 951 952 953 954 955 956 957 958 959 960 Next
Comments 47601 to 47650:
-
Son of Krypton at 13:43 PM on 13 March 2013The educational opportunities in addressing misinformation in the classroom
Have to say it, I exploded laughing at the Yoda link
-
Jose_X at 11:42 AM on 13 March 2013Water vapor is the most powerful greenhouse gas
With a good grasp of the algorithms involved to calculate a forcing, we could probably just analyze that.
And if someone was actually going to carry out the computational experiment, perhaps limit the number of steps to avoid approximation error propagation from interferring. -
Jose_X at 11:34 AM on 13 March 2013Water vapor is the most powerful greenhouse gas
KR, calculating the forcing for CO2 early on in the process (near 0% CO2) and continuing, eg, using at each step the integration process you mentioned, is what I imagined might be done. But I am curious if that procedure would lead to the same total forcing result no matter in how many steps we calculate the increments.
As an extreme example, if we calculate the forcing of one additional molecule of CO2 at a time (assuming the standard model we use now applies, eg, ignoring quantum or other effects that might be present at very low concentrations or what not, and assuming that computation could finish some day), what total forcing would we get and would this value be the same if after an initial start we switch over to steps where we double the prior value.
Why do I care? I would like to know if the forcing calculations adhere to linear superposition like linear operators do with vector (tensor?) quantities (ie, partitioning into component parts arbitrarily, operate on these separately, and then combined back additively into a unique whole). The definition of forcing makes me a little nervous about that.
Does someone have software that can simulate several reasonable partitions for the current CO2 to test if each partitioning path leads to the same answer? [An example might be to calculate 1 W/msq of forcing at each step vs 2 W/msq at each step. In fact, there is no need to do this until the current atmosphere. We can just compare 1 W/sqm for 40 steps vs 2 W/sqm for 20 steps.][In these replies I giving, m^2 is same as mSq is same as sqm ...etc. I get lazy with the keystrokes sometimes.]
-
Jose_X at 11:26 AM on 13 March 2013Water vapor is the most powerful greenhouse gas
Tom Curtis, actually the equation should probably have been 6.6/33 = .2 (aka, 1/5) and then rather than divide the 5 into the 145.75 I would have multiplied the .2 and 145.75. Point is that 6.6 is 20% of the whole change as expressed in C so I wanted to find that same 20% of the whole change in W/msq.
-
Tom Curtis at 11:11 AM on 13 March 2013Water vapor is the most powerful greenhouse gas
Jose_X @146:
1) Because the CO2 modulates the outgoing LW radiation, it depends on the strength of that radiation, and hence on surface temperature. That does mean it depends on the strength of the incoming solar radiation, but only indirectly. In contrast, changes in aerosol opitical depth, which change albedo, are directly dependent on the strength of the incoming solar radiation for the strength of the forcing.
2) Across the range of temperatures and conditions experienced in the Phanerozoic (approx -6 to +8 C relative to present values) λ has been fairly constant, with changes in continental configurations having a much larger effect on changes in λ than variation withing the temperature range. In broader terms, λ becomes significantly larger as ice sheets approach 30o Latitude (North or South) due to the much enhanced albedo, and as temperatures rise significantly beyond 8 C above current values (due to enhanced water vapour feedback).
Other than noting that your second equation in section (3) should be 33/5 = 6.6, I will return to it when I have a bit more time.
-
Water vapor is the most powerful greenhouse gas
Jose_X - Some misconceptions here, if I might point them out (hopefully correctly).
"How do we calculate the total forcing by CO2 that led to this 29 W/m^2?"
If you start from zero CO2, the forcing per increase in CO2 concentration starts linear, and becomes logarithmic as various bands reach saturation (with increases coming from band widening, rather than peak increases), so the relationship is not consistent over concentrations. Methane (IIRC) is still in the linear region, CO2 is not. The accurate answer comes from line-by-line radiative codes such as MODTRAN using the HITRAN spectral database - essentially numeric integration. You have to do the math. There is no simple equation.
"My confusion is that forcings are defined at TOA yet TOA always reverts to about 240 W/m^2"
Yes, it does, as 240 W/m^2 is what is incoming from the sun. When enough time elapses for GHG forcing changes to come to equilibrium, energy out = energy in at TOA, although at a different surface temperature depending on those changes. The only reason for that equilibrium number to change would be changes in incoming energy, perhaps from albedo/land use or significant cloud percentage/distribution. I do expect that the melt of the Arctic ice cap, for example, will raise that equilibrium number somewhat by decreasing summer albedo.
-
Tom Curtis at 10:27 AM on 13 March 2013No alternative to atmospheric CO2 draw-down
Jose_X @48. the one disclaimer regarding the 20% "effectively forever" is that the percentage of emissions retained for thousands of years into the future depends on the total emissions. The 20% figure is the approximate value for 1000 Petagrams (1 trillion tonnes CO2), the achievable lower limit of CO2 emissions assuming no geoengineering:
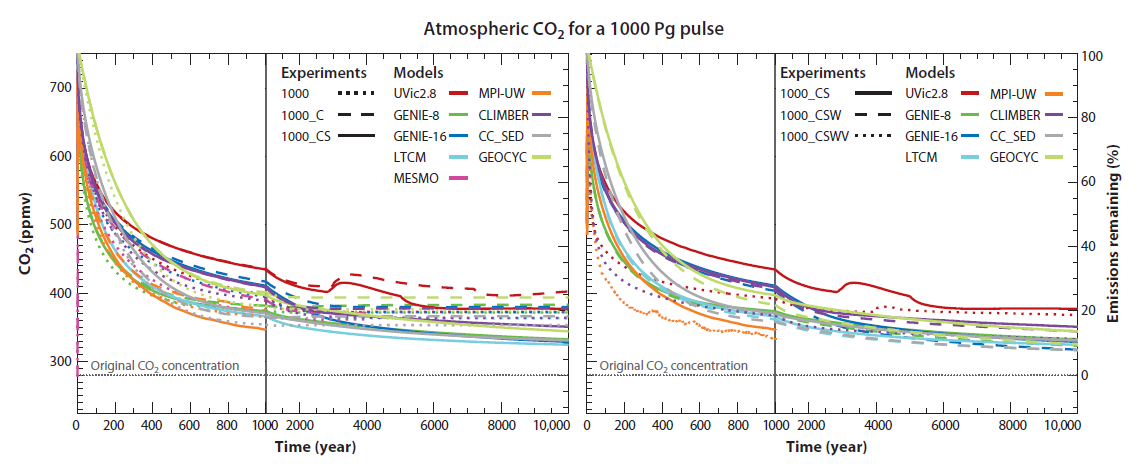
A more realistic figure for total emissions given current rates of mitigation would be 5000 petagrams, when retained CO2 is significantly higher, and perhaps as high as 30%:
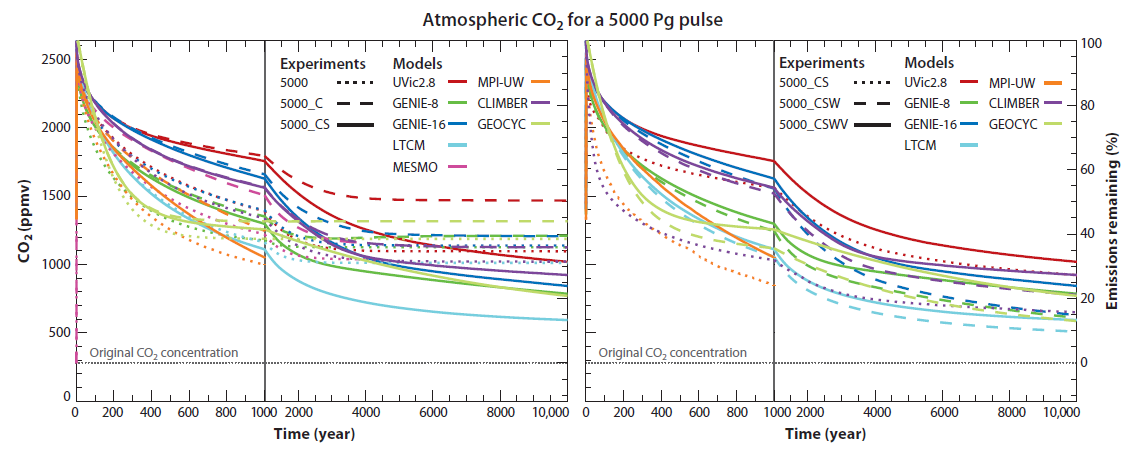
With the "drill baby, drill!" strategy of the Republican party in the US, and the Harper government in Canada (and the Abbot opposition in Australia) upper limits on emissions may be up to three times that, ie, around 15,000 Pg (15 trillion tonnes).
Even the best case scenario results in an increase in global temperature relative to the preindustrial of around 2 C (ie, 1.3 C increase relative to current margins) for the next 10 thousand years. The intermediate case increases that to around 5 degrees above the pre-industrial, while the worst case puts it out to about 16 C increase (all estimates having a error margins of about +/- 50%).
-
Hans Petter Jacobsen at 09:41 AM on 13 March 2013Does Norway lack political commitment to renewables?
The article in Apollon did not mention the magnitude of the hydropower production in Norway and the green certificates that Norway and Sweden have agreed on. The Apollon article could have done so to be more balanced.
The production of hydropower varies from year to year depending on the precipitation. The last years have been wet, and the years to come are also expected to be wet due to climate change. According to SSB the Norwegian hydropower production in the last 12 months was 142.0 TWh, and the total consumption was 130.9 TWh. The surplus was exported to other countries in Europe. Thermal power plants produced 3.4 TWh in the same period. In dry years the production of hydropower is less, but on average Norway exports more electricity than it imports. According to Statnett Norway exported on average 3.8 TWh each year between 2000 and 2011.
Norway and Sweden have agreed on green certificates to support the production of renewable energy. It started in january 2012, and the goal is to stimulate the development of 26.4 TWh of new renewable power within 2020. Nortrade informs about it here in english. The green certificates are disputed in Norway. Some fear that this production of new renewable energy will further destroy the nature, and some argue that Norway does not need this extra energy and that it may lead to more waste of energy.
-
Jose_X at 09:17 AM on 13 March 2013No alternative to atmospheric CO2 draw-down
MA Rodger, thanks for the reference and for the summary.
A related note from page 5:
> Finally, the 2007 IPCC report removed the table from the “Policymaker Summary,” and added in the “Executive Summary” of Chapter 7 on the carbon cycle, “About half of a CO2 pulse to the atmosphere is removed over a timescale of 30 years; a further 30% is removed within a few centuries; and the remaining 20% will typically stay in the atmosphere for many thousands of
years” (Denman et al 2007, page 501). -
Jose_X at 08:56 AM on 13 March 2013Water vapor is the most powerful greenhouse gas
Are the following observations correct?
And does someone have an answer for the two questions at point 3.
1. The forcing value depends on the reference sun intensity. If the sun was providing approximately a stable 50 W/m^2 TOA, then the CO2 forcing calculations would yield different numbers.
2. For the lambda (climate sensitivity proportionality coefficient) between forcing at TOA and (yearly global mean) temperature on the surface to be approximately constant, we should use a reference point for forcing such that the delta temperatures involved are at most a few K. [This criteria would include a "near" constant solar intensity requirement that has easily been met by sun+albedo across spans of a few centuries.] This would allow, for example, the relevant Stefan Boltzmann relationships to remain in an approximately linear region, eg, where each degree change in temp would correspond approximately to a constant change in W/m^2 (currently approaching 5.4 W/m^2 per C at ground level).Also, I was guessing that, although the lambda and forcing values might be determined from computer programs that may potentially take a long time to run in order to achieve a high level of accuracy, that using simple models (esp linear) afterward with those derived values allows researchers to ask and answer many questions involving lots of combinations of forcing agents and quantities without having to run involved simulations for every such combination of values. The simple models also help us understand the main factors in climate change and together with all models used help keep a sanity check on each other.
3. Calculating the contributions from CO2 to the greenhouse effect (using data from KR's recent comment):
287.5 - 255.5 = 33 (relevant temperature values to nearest 0.5 C)
33 / 6.6 = 5 (aka, 20% contribution by CO2)
387.38 - 241.63 = 145.75 (Stefan Boltzmann W/m^2 at surface corresponding to 33 C increase and e=1)
145.75 / 5 = 29.15 (contribution by CO2 to total W/m^2 at surface)
So there have been 29.15 W/m^2 of warming due to CO2 for its 6.6 C contribution to the total greenhouse effect of 33 C.
Question 1: How do we calculate the total forcing by CO2 that led to this 29 W/mSq?
Put differently, if we revert to an atmosphere with almost no ghg effect, meaning that the TOA and surface are roughly at 255K, how many times will we have to apply a forcing of 1 W/m^2 (TOA) from CO2 additions to get to our current atmosphere? Can someone roughly (including hand waving) show the steps in unit increments that achieve this and so that we can see how the ground temp or ground irradiance change at each step? [For the purposes of addressing this question, on may optionally assume H2O is liquid all throughout the 33 C range.]
Question 2: Whatever approximation method is used to answer Question 1, will we get roughly the same answer if we go in 5 W/m^2 increments?
My confusion is that forcings are defined at TOA yet TOA always reverts to about 240 W/m^2. And there isn't to me an obvious way to derive that total forcing value (eg, from CO2.. or even from all ghg) simply from knowing how much change was experienced on the ground (the greenhouse effect). I can see how that question might be answered possibly by calculating in delta/differential steps and taking a limit in order to try and get a unique result (although I don't know how to make that calculation). Alternatively, it might not be possible to get sequence/limit convergence to a unique value on a "delta" analysis. I don't know, and before I spend more time thinking about this problem, I'm curious if someone has access to an online reference where I can get the answer or if they can provide the answer themselves.
Resolving these questions makes it easier for me to address more definitively some skeptical questions I have been getting related to "forcings" math (and in understanding this for its own sake). -
fatir.b at 08:29 AM on 13 March 2013Drost, Karoly, and Braganza Find Human Fingerprints in Global Warming
" ... there is a tendency for some models to overestimate the trend in GM and underestimate the trend in LO." I do not belive that is possible to estimate the influence of human on nature in brief period of time. Although I support the opinion for human influence.
-
MA Rodger at 08:06 AM on 13 March 2013No alternative to atmospheric CO2 draw-down
Jose_X @46
The increased concentration of CO2 in the atmosphere represents about 43% of accumulative human emissions from FF, cement production & land change, the remainder going into the oceans and the biosphere. This rather consistent % is purely a function of mankind's continually increasing emissions.Equilibrium is a long way off.A well quoted reference on atmospheric CO2 lifetimes is Archer 2009 who concludes that if we stop emitting CO2, after about 500 years the result of all our emissions would be an increase in CO2 above pre-industrial levels roughly equal to 20% of our emissions. This remaining 20% will then be left in the atmosphere for tens of thoudands of years.
(That is exepting the cement releases. The chemistry of cement/concrete reabsorbes its CO2 releases over about 1,000 years.)
-
dana1981 at 07:45 AM on 13 March 2013Drost, Karoly, and Braganza Find Human Fingerprints in Global Warming
Thanks for the update, Dr. Karoly.
-
Rob Honeycutt at 07:24 AM on 13 March 2013Drost, Karoly, and Braganza Find Human Fingerprints in Global Warming
CBD and HK... That blew by me. X-|... It makes sense now.
-
dkaroly at 07:22 AM on 13 March 2013Drost, Karoly, and Braganza Find Human Fingerprints in Global Warming
Dana, Thanks for your post on our paper from last year. An obvious question is why did the authors use the CMIP3 models, not the CMIP5 model runs, and the answer is that at the time the paper was completed, in early 2011, there weren't enough CMIP5 model runs to use. When data from the CMIP5 model runs became available, we redid the analysis and made use of the 20th century simulations with different forcings, including all forcings, greenhouse gas increases only, and natural forcing changes only, to verify that our fingerprints are not consistent with natural forcing. The results confirm and strengthen the conclusions you summarise and are available at http://onlinelibrary.wiley.com/doi/10.1029/2012GL052667/abstract
Drost, F., and D. J. Karoly (2012) Evaluating global climate responses to different forcings using simple indices, Geophys. Res. Lett., 39, L16701, 5pp, doi:10.1029/2012GL052667.
-
Jose_X at 06:53 AM on 13 March 2013No alternative to atmospheric CO2 draw-down
Ocean acidification aside, does anyone know what amounts of CO2 would be taken up by the ocean of man stopped releasing excess (unnatural) CO2?
When I see that the oceans take up some 1/4 of CO2 we release, I wonder if this brings the CO2 into near-term equilibrium with the oceans that fast and the oceans would take up very little more if we ceased CO2 releases or if the oceans are always behind and stopping CO2 releases would then lead to significant decreases in the atmosphere as the oceans continue doing their work. I don't know if the current year's 1/4 removal, for example, is a delayed lag off CO2 from long back or if it is closely tracking what we add on a yearly basis.
-
StBarnabas at 06:22 AM on 13 March 2013Does Norway lack political commitment to renewables?
I will need to chase some references, but I think that if the Norwegian hydro system was upgraded to a pumped system there would be sufficient pumped storage to back up the entirety of the EU electricity load for over a week. Of course this would need an EU supergrid. Should this not be a major Norwegian priority?
-
Drost, Karoly, and Braganza Find Human Fingerprints in Global Warming
Yes, CBDunkerson, that’s exactly my point!
So, I guess we can agree that the mass balance argument is a very elegant way to prove that the extra CO2 in the atmosphere has to be manmade.
-
Jose_X at 04:52 AM on 13 March 2013Water vapor is the most powerful greenhouse gas
I was not looking at "forcing" as something like a gravitational force value associated with a body on the earth (which tends to exist all the time) but more like (net) heat, a quantity defined as the summation of other (sign-dependent) quantities and which might frequently approach or be zero. I guess that was wrong.
So, to confuse everyone still further, I guess forcing is somewhat analogous to pressure in that it tends to be nonzero and significant whether the system is approximately in equilibrium or not and under a context where "pressure" would refer to partial pressure of a species or, more specifically, to the additional contribution to partial pressure that would be provided as the species moves from one reference concentration to a different target point separated from the first by a stadardized multiple (of 2). -
CBDunkerson at 04:36 AM on 13 March 2013Drost, Karoly, and Braganza Find Human Fingerprints in Global Warming
Rob, I think HK's point is that the mass of carbon emitted by humans each year can't just disappear. He brought up conversion to energy as a theoretical example of where someone might argue the mass had gone... but then noted that the amount of energy involved would be too great to have missed (thus disproving that possibility). He was never suggesting that the carbon really did or would transform into energy.
-
Water vapor is the most powerful greenhouse gas
Jose_X - It's a bit difficult to understand what you are discussing here. Are you asking for the current sum value of CO2 forcing? According to NASA numbers CO2 represents ~20% of the current greenhouse effect, water vapor and clouds ~75%, and other gases (methane, CFCs, ozone, etc) another 5%.
33C of greenhouse effect, or 6.6C directly attributable to CO2 by those numbers, means about 22-23 or so W/m^2 of total CO2 forcing at this time.
On the other hand, "forcing" is generally referred to as the change from previous conditions, usually 1750AD, in which case as of 2005 CO2 accounts for ~1.66 (1.49-1.83) W/m2 as a delta. Add in all the other factors +/-, and the total net anthropogenic forcing change since 1750 is about 1.6 (0.6-2.4) W/m2.
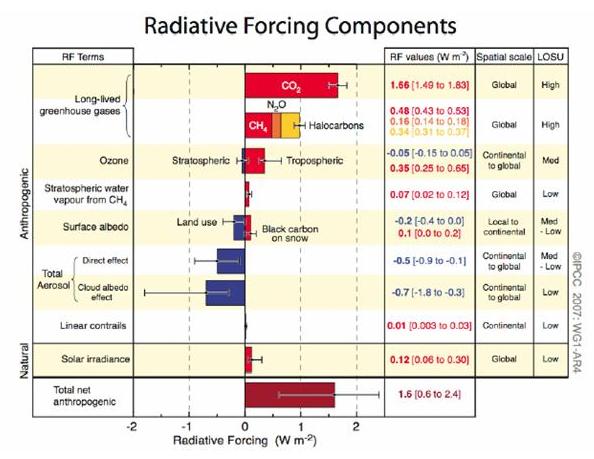
[Source]
But again, I'm not entirely certain what you are asking about.
-
Jose_X at 03:30 AM on 13 March 2013Water vapor is the most powerful greenhouse gas
Tom Curtis, thanks for the response, but I was thinking of "theoretical" just as you explained, meaning that if we could actually do 2x over night then we would observe the full forcing value.
Tom Curtis #142. Rethinking the meaning of the words now after your 142 comment, I see that you were right and I did mean hypothetical. I didn't mean that the value couldn't exist under any circumstance, but rather that it could but would not unless the CO2 were eg done "over night". I concluded this from the statement by the IPCC (quoted on Wikipedia) that a reference value is used to define the forcing ("with surface and tropospheric temperatures and state held fixed at the unperturbed values") so that perhaps a perturbation "forcing" is not an entity (theoretical or measurable) that is manifested in reality if there isn't an imbalance at TOA of that magnitude at any given point in time.
Let me ask something about the meaning of the word "forcing". Would "yes" be the answer to the question, "is the forcing at TOA from CO2 a value greater than 5 W/m^2?" [ie, is it clearly greater than the 2x forcing quoted by the IPCC because it would include contributions from all CO2 in the atmosphere today?] -
Rob Honeycutt at 02:51 AM on 13 March 2013Drost, Karoly, and Braganza Find Human Fingerprints in Global Warming
HK... You don't understand my question. I'm not asking about the math. I know the equation.
I'm asking, by what method are you converting the mass to energy. It doesn't just magically change by itself. There has to be a mechanism by which the mass is changed to energy.
More to the point, I'm saying you can't just randomly change mass to energy. That is what you do in a nuclear explosion or a nuclear reactor. You can't say "if" that mass were converted to energy because you can't change the mass of 10 GT of atmospheric carbon into energy.
I'm telling you that you're making a completely meaningless point.
-
Drost, Karoly, and Braganza Find Human Fingerprints in Global Warming
Rob Honeycutt
E (energy in Joules) = m (mass in kilograms) x c2 (speed of light in meters/sec)
When mass is multiplied by (3 x 10⁸)2 you get a lot of energy!
That’s why 4.3 million tons of mass converted to energy every second is able to power the Sun.
Maybe this has got a little off-topic, but it should make it obvious that many gigatons of manmade carbon can’t disappear without a trace every year and that nature has been a net carbon sink for many decades.
-
Rob Honeycutt at 01:34 AM on 13 March 2013Drost, Karoly, and Braganza Find Human Fingerprints in Global Warming
HK... Let me ask a question. How did you suddenly convert all that mass to energy?
-
Drost, Karoly, and Braganza Find Human Fingerprints in Global Warming
8 Chriskoz & 10 CBDunkerson:
It seems that we pretty much agree!
I was also considering the mass balance of carbon, but left it out because it wasn’t included in figure 1. If nature was a net emitter of CO2 it would of course be very hard to explain how 10 gigatons of manmade carbon can disappear without a trace every year, unless we assume that it is converted into energy according to Einstein’s famous formula E = mc2. (a new climate myth?)
The only problem is that if we put 10 gigatons of mass into that formula, we end up with about 9 x 1029 Joules of energy, enough to boil away the oceans nearly 250 times! JJ
-
CBDunkerson at 21:48 PM on 12 March 2013Drost, Karoly, and Braganza Find Human Fingerprints in Global Warming
HK, rather than needing a combination of all the listed factors I'd say rather that none of the items listed proves AGW by itself. Rather various combinations of them do. As chriskoz said, mass balance plus item 7 is one proof. As are 5, 6, and 7 together. Or 4, 5, and 6. Or 1, 2, 3, and 7. Et cetera.
Each of the fingerprints rules out various other possibilities and together different sets of them rule out every possibility except AGW.
-
bill4344 at 11:49 AM on 12 March 2013Drost, Karoly, and Braganza Find Human Fingerprints in Global Warming
Wow, chriskoz - that's a bright kid! ;-)
-
Dave123 at 11:28 AM on 12 March 2013Skeptical Science launches PDF
I've got Personal Brain software, and I agree it would take a huge amount of time, and this sort of mind mapping is intensely personal. How one person sets it up isn't how someone else would feel comfortable navigating- that's why they call it Personal.
-
chriskoz at 11:21 AM on 12 March 2013Drost, Karoly, and Braganza Find Human Fingerprints in Global Warming
HK@7,
You missed the simple accounting of C mass balance in the atmosphere: emissions vs. ΔCATM, after Cawley, 2011 and from the Keeling curve. A preschool child can calculate it (well, if told that ΔCATM = Δppm*earth surface) concluding that at least since 1958 (when Charlie started measuring Δppm) and likely for much longer, nature has always been the net sink of CO2. Therefore nature has always been helping to get rid of humen CO2 in the atmospher and not adding to it.
That, combined with your point 7) is the bottom line of evidence concluding the causation of AGW. The rest of your points (as well as this study) is just an icing on the cake. That's it, you don't need any knowledge beyond primary school arithmetics to understand that.
-
Drost, Karoly, and Braganza Find Human Fingerprints in Global Warming
Maybe this is a little pedantic, but I just want to point out that none of the "fingerprints" in figure 1 is a proof of human-caused global warming by themselves, and that each of them in theory could have a natural cause. It’s the combination of all these factors together that represents a huge, clear-cut AGW-fingerprint.
1) The shrinking and cooling upper atmosphere could be caused by reduced solar activity, but that option is excluded if we accept that the ongoing warming is real.
2) The rising tropopause could be the result of any warming, whether this was caused by increased energy from the sun or decreased energy-loss to space, but 1) rules out the sun as the cause for warming.
3) The pattern of ocean warming (most in the upper layers) rules out geothermal heat, even if it had been physically possible for GH to change significantly during a few decades.
4) Winters and nights warming faster than summers and days, less heat escaping to space and more heat returning to Earth is a clear fingerprint of the greenhouse effect, but it could be the result of a natural increase of CO2 and other GHGs, which has happened several times in the distant past.
5) Less oxygen in the air clearly shows that the extra CO2 comes from burning of organic matter, which rules out volcanoes and oceanic out-gassing. It could in theory be a result of widespread forest fires and other natural decay of organic matter, but would there be any forests left on Earth today if that was the source of about 500 gigatons of extra carbon in the atmosphere and oceans since the industrial revolution?
6) More fossil fuel carbon in the atmosphere, trees and so on (if that refers to the increased C12/C13 ratio) could also be the result of widespread burning and decay of organic matter, but again, we still have a lot of forests on this planet. And I guess the lack of C14 proves that the source for this extra carbon has to be very old organic matter, not recently dead trees.
7) And finally, we know with absolute certainty – as far as anything can be certain in science – that CO2 is a heat-trapping gas, which is nicely demonstrated by John Nielsen-Gammon here.
-
scaddenp at 06:52 AM on 12 March 2013Extreme weather isn't caused by global warming
Snafu - lets get this clear. Science works like this - you build hypotheses into models from which you make predictions. You test these predictions against the real data. Now you think you doing this. "Look AGW says xyz, and he is abc which shows its wrong". However, what you are really doing is constructing a straw man agument because climate models predict no such thing and all the handwaving in the world doesnt change that. So instead of constructing your own wild ideas on what the science predicts you could instead see what is actually predicted and compare that with systematic analysis of global records.
So far you are sloganeering. Before we waste further time, perhaps we should ask whether data would change your mind or are you only looking for something to sure up an opinion that wasnt based on data in the first place?
-
DSL at 06:51 AM on 12 March 2013Skeptical Science launches PDF
TB, I thought about it, but it would take a pretty huge chunk of time -- too much for me.
-
TreeBanker at 05:55 AM on 12 March 2013Skeptical Science launches PDF
Are you guys familiar with 'Personal Brain' software? If so do you know if anyone has built a brain around your material?
-
Doug Bostrom at 05:43 AM on 12 March 2013Cherrypicking to Deny Continued Ocean and Global Warming
Jac: ...[Rose] allowed Tillerson to soft sell his "we have to balance economic growth" approach climate change ...
This is actually a tough feature of our dilemma; our nature and habit is to "balance" opposing requirements, think in terms of some kind of budget that allows supporting several notionally exclusive objectives. Rose isn't alone in faltering at this mental hurdle.The fact is, every gram of CO2 we emit now is like pushing a drowning man's head just that little bit deeper underwater. Meanwhile nothing less than "let him breathe air" will do; saying that my objective is to keep as much of my hand wet as possible while letting the man's head emerge from underwater is useless unless I allow the fellow to take a breath. My knowledge of anatomy tells me my hand will be entirely in air if I do so; how do I "compromise?"
In the following lecture (youtube) Tyndall Centre's Prof. Kevin Anderson explains better .
-
BillWalker at 05:14 AM on 12 March 2013Drost, Karoly, and Braganza Find Human Fingerprints in Global Warming
Of course, the climate "skeptics" takeaway from this will likely be "Although the range of trends as simulated by the models cover the range of possible trends as indicated by the observational data quite well, there is a tendency for some models to overestimate the trend in GM..."
I can see the headline now: "Models overestimate warming, says new paper!"
Sigh. -
dana1981 at 04:24 AM on 12 March 2013Drost, Karoly, and Braganza Find Human Fingerprints in Global Warming
John H @4 - climate models should anticipate these 'fingerprints' pretty well. I'm not aware of an example where an observation was determined after-the-fact to be an anthropogenic 'fingerprint', though there might be some examples I'm not aware of.
-
Rob Honeycutt at 03:25 AM on 12 March 2013Skeptical Science launches PDF
snafu... I would think you could do better than that! Try Aug 1998 of +0.83C and Jan 2012 of +0.32 (GISS LOTI). Yikes, we're headed for an ice age in the next 50 years! (/sarc)
-
jerryg at 03:06 AM on 12 March 2013Skeptical Science launches PDF
Are they only available from the articles themselves, or do you have a central repository where they can also be downloaded from?ThanksModerator Response: Not a bad idea. A direct list could indeed be incorporated into the "Arguments" menu item item at upper left. -
John Hartz at 03:05 AM on 12 March 2013Drost, Karoly, and Braganza Find Human Fingerprints in Global Warming
@dana #3:
You said: Something that we expect to see if humans are causing global warming.
Aren't we also seeing fingerprints that we didn't expect to see? (We certainly are seeing some fingerprints sooner than we had expected to see them.)
-
Composer99 at 03:03 AM on 12 March 2013Extreme weather isn't caused by global warming
snafu:
At the risk of being accused of 'cherry-picking' single events [...]
Got it in one.
A handful of individual weather events is not the equivalent of a global aggregate of extreme weather events over long time frames.
-
dana1981 at 02:49 AM on 12 March 2013Drost, Karoly, and Braganza Find Human Fingerprints in Global Warming
John @1 - 'fingerprint' is basically shorthand for 'evidence specific to or consistent with human-caused warming'. Something that we expect to see if humans are causing global warming. I didn't update any rebuttals with this one. I could probably update 'it's not us' with some of this info. I'll let you know if I do.
jsam @2 - thanks, typo fixed.
-
jsam at 02:42 AM on 12 March 2013Drost, Karoly, and Braganza Find Human Fingerprints in Global Warming
Typo alert, first line, "the physical reality that global warmig continues unabated" - warmig.
-
Rob Honeycutt at 02:30 AM on 12 March 2013Extreme weather isn't caused by global warming
snafu... You know that you're not making a lot of sense here. How do you come to the conclusion that weather events are getting more extreme but not because of global warming?
Moderator Response: [JH] Snafu is also skating on the thin ice of sloganeering.] -
John Hartz at 01:58 AM on 12 March 2013Drost, Karoly, and Braganza Find Human Fingerprints in Global Warming
Dana:
Kudos on yet another excellent post.
Question: In scientific circles, is "fingerprints" short-hand for "lines of evidence"?
Also, does your above article update any of the existing SkS Rebuttal articles?
-
Jac_RTP at 01:15 AM on 12 March 2013Cherrypicking to Deny Continued Ocean and Global Warming
It never seems to end. Just this morning, RedState, the conservative misinformation site, published this denier’s piece the author called: Alternate New York Times Headline: ‘Global Warming Saves Civilization’… http://www.redstate.com/2013/03/10/alternate-new-york-times-headline-global-warming-saves-civilization/
The MSM isn't that far behind the conservatives. Charlie Rose made sure his interview with Rex Tillerson last week was rose colored from the ExxonMobil POV. Charlie could've asked the tough questions, but didn't. Instead he allowed Tillerson to soft sell his "we have to balance economic growth" approach climate change with just enough cherrypicking and other denier rhetoric to make it palatable to average American's worried about climate change, but more importantly paying this month's bills... http://www.charlierose.com/view/interview/12808
-
Miriam O'Brien (Sou) at 00:54 AM on 12 March 20132013 SkS Weekly News Roundup #10
If anyone is interested (in light of snafu's comments), I made a gif animation of part of that incredible heat wave over Australia. (You probably need to know what's 'normal' in January to fully appreciate it. Definitely what happened was a long way from 'normal'.)
Not that what we're getting now down in SE Australia is 'normal' for autumn, either. It's too hot for this time of the year.
-
Robert Murphy at 00:36 AM on 12 March 20132013 SkS Weekly News Roundup #10
What Snafu is leaving out is the fact that,
"On average, Marble Bar experiences about 154 such days each year. The town is far enough inland that, during the summer months, the only mechanisms likely to prevent the air from reaching such a temperature involve a southward excursion of humid air associated with the monsoon trough, or heavy cloud, and/or rain, in the immediate area. This may sometimes be associated with a tropical cyclone or a monsoon low. In the record year of 1923-24 the monsoon trough stayed well north, and the season was notable for its lack of cyclone activity. (In fact, the entire Australian continent was untouched by tropical cyclones throughout the season, a rare event in the 20th Century)."
www.bom.gov.au/lam/climate/levelthree/c20thc/temp1.htm
This "great record" only broke the average number of 100+ days at Marble Bar by 6, and it was weather freakiness that year that did it. That's not much of a heat wave; that's just a touch above normal for Marble Bar. It says absolutely nothing about the relative global temps from back then and now. How coould it possibly?You'll have to do a lot better than that to even begin to make a case it hasn't been warming.
-
Miriam O'Brien (Sou) at 00:32 AM on 12 March 2013Conspiracy Theorists Respond to Evidence They're Conspiracy Theorists With More Conspiracy Theories
Just a quick observation on the silliness going on over at WUWT arguing over which is their current conspiracy theory. I see that Foxgoose was most put out because he reckons Lewandowsky et al got his conspiracy theory wrong. Foxgoose seems to have clarified to all what his actual conspiracy theory was and is (I think); and is still sticking to it apparently, despite indisputable evidence to the contrary.
I bet he's thankful to Brandon for clearing that up :D
(Before tackling that thread, make sure you put your head in a vice! Barmy is a good descriptor, if it's allowed. Otherwise Rob Honeycutt's "never have I run across such who are so self-unaware" will do.)
-
snafu at 00:30 AM on 12 March 2013Extreme weather isn't caused by global warming
I hope I have put this in the right place.
At the risk of being accused of 'cherry-picking' single events, I ask everyone to take note of these dates;
Typoon Tip -1979
Marble Bar - 1923-24
Furnace Creek Ranch (formerly Greenland Ranch) - 1913
Oodnadatta, South Australia - 1960...actually, instead of listing them, please go here;
http://en.wikipedia.org/wiki/List_of_weather_recordsNow open the SkS trend calculator, HADCRUT4, 1850-2013, moving average - 1 month.
I'm not interested in temps or trends as such, this is not a 'it's getting hotter or colder' question. I'd like you to take note of the 'extreme' weather events from the link above and see which period(s) the bulk of them occur in.
Have weather events become more 'extreme'? Yes...............and it's not because of Global Warming.... ;) .
Moderator Response: [JH] Please note that posting comments here at SkS is a privilege, not a right. This privilege can and will be rescinded if the posting individual continues to treat adherence to the Comments Policy as optional, rather than the mandatory condition of participating in this online forum. Moderating this site is a tiresome chore, particularly when commentators repeatedly submit offensive or off-topic posts. We really appreciate people's cooperation in abiding by the Comments Policy, which is largely responsible for the quality of this site. Finally, please understand that moderation policies are not open for discussion. If you find yourself incapable of abiding by these common set of rules that everyone else observes, then a change of venues is in the offing. Please take the time to review the policy and ensure future comments are in full compliance with it. Thanks for your understanding and compliance in this matter.
Prev 945 946 947 948 949 950 951 952 953 954 955 956 957 958 959 960 Next


