


 Arguments


Recent Comments
Prev 90 91 92 93 94 95 96 97 98 99 100 101 102 103 104 105 Next
Comments 4851 to 4900:
-
Evan at 00:15 AM on 7 November 2021The Keeling Curve: Part II
swampfoxh@1
"and like the above essay, such approaches are mere intellectual gymnastics in the understory of an ivory tower."
I won't disagree with you. I am merely clarifying what must happen to reach Net-0 Emissions so that people can monitor for themselves how well we are, or are not, translating talk into action.
-
cph at 00:09 AM on 7 November 2021It's the sun
HK@1290 -
"The only explanation making sense is that the Earth gives off less heat to space."
--- Another additional explanation would be the fact, that the earth absorbs more short-wave solar energy from space, although the solar constant(1360,5W/m²) tends to decrease actually.
Explained by the cloud and snow / ice albedo that has decreased in the last few decades (0,5W/m² which is a lot).
Moderator Response:[BL] The user cph has been confirmed as a sock puppet of the previously-banned user coolmaster. Until the admins can delete the account of cph, any further posts by cph wll be deleted as soon as moderators find them. Please do not respond to any comments you come across.
-
swampfoxh at 23:26 PM on 6 November 2021The Keeling Curve: Part II
The last sentence of this essay is the answer: A reduction in human population from 8 billion to 800 million. An additional answer would be to eliminate industrial animal agriculture, the elimination of which would allow the planet's sustainable number of humans to rise to about 2.2 billion (BAU). Then, various steps could be required to trim GGEs further.
Of course, none of this is going to happen...and like the above essay, such approaches are mere intellectual gymnastics in the understory of an ivory tower.
-
michael sweet at 23:18 PM on 6 November 2021SkS Analogy 25 - Emissions vs Accumulation
Cph:
A quick Google gives the flow of the Nile river as about 90 km3 per year. Where do you plan to obtain 1630 km3 of water for your wild scheme?
Build me a factory that can permanently sequester 10 gigatons per year of carbon dioxide and I can solve the climate problem. Too bad that is not a practical plan. Farmers already evaporate as much water as they can. Little excess water remains anywhere in the world. You cannot pipe the flow of the Amazon river to the middle of the Saraha dessert.
-
cph at 22:28 PM on 6 November 2021SkS Analogy 25 - Emissions vs Accumulation
Jim Eager@13
- "It has nothing to do with the radiative forcing of H2O, it has to do with the fact that you can not directly increase the amount of water vapour in the atmosphere... / ...it can only act as a feedback, not as a driver or forcing."
https://iopscience.iop.org/article/10.1088/1748-9326/aae018
The fact that H2O is understood primarily as a feedback constituent does not mean these forcings cannot be quantified, and the relatively new concept of "effective radiative forcing" allows for this to be done.

If you give me the volume of water from Lake Ontario(1639km³) - I could evaporate it in the Sahara within 20 days - to directly increase the amount of water vapour in the atmosphere (for a few days).
-
nigelj at 06:06 AM on 5 November 2021Discourses of Climate Delay
David Hawk. I dont understand what you are talking about. Could you please clarify your views in plain language and, without all the social science jargon and psychobable and without the confusing impenetrable ancient history about the dissertation.
-
David Hawk at 22:21 PM on 4 November 2021Discourses of Climate Delay
This article does seem insightful relative to personality type-castings and climate change results, but its implications leave the problem at the doorway of education or personality typologies and features. There are other approaches but they are less complementary to the species and its membership.
Another approach was used in a 1975-77 international project on environmental deterioration as a result of general human characteristics and a species attitude towards nature. It did not end in particulat personality profiles nor educational backgrounds and foregrounds.
The research began with concern in humans having a general distrust, even dislike, of nature and natural processes in psychology as measured in industrial processes. Nature was seen as implicitly systemic while humans prefered being seen as analytic. The analytic was shown to be reductionistic, segmented and absent of context, while having reverence for cause-effect conclusions as abstractions. Any reference to management as wrong in the longer-term, as comparied to factory workers proving to be more insightful, was said to be "ad hominem," whatever disbelievers, usually upper management but not CEOs, might mean each time they said such. This was endemic to the human approach to problems. In the research it was called legalism in search of finding a legal order.
The alternative posed from the research with twenty major international firms and six governments was a more natural, neogtiated order. This began in what had been learned in Prisoner's Dilemma with Rapaport. The three volume research conclusions appeared, with an ending with research from a participant on climate change if the human psyche did not find a paythway to appreciate the natural (Black was in the project). This approach to governance requied self-regulation of human relations to the environment, each other, and self.
In 1978 this was presented in a dissertation at the U of Pennsylvania. The cross-disciplinary professor-committee finally accepted it but asked for the "cimate-change" part be removed with more analysis as to why such was very questionable. They asked for traditional results that could be abstracted from "research details." They saw general systems thinking as anti-science? The Head of EPA was furious about the study and the dissertation, as was the Dean of the Wharton School. He saw no relation between environmental deterioiration and business. The author agreed, that dean did fail to see a relation, which made discussion more difficult. Forty years later the work was republished as "Too Early, Too Late, Now what?" A new chapter on this evolution will appear in Europe late this year which goes deeper into why its a human thing, not restricted to some types. That thesis is: "Short-term gain, Long-term pain." Its a very old story about a species with seroius limitations in its great ability to think.
Moderator Response:[BL] You seem to be making a habit of referring back to the same old work (or similar), in nearly every comment you make.
In your very first comment here, you were warned that this is not a forum for you to do nothing but promote your book. Disguising such promotion by avoiding mentioning that it is your own work - if that is what you are doing - is not appropriate.
Also note that the Comments Policy advises against excessive repetition.
Discussion is welcome, but treating this site as a free source of self-promotion is not.
-
plincoln24 at 20:05 PM on 4 November 2021The Keeling Curve: Part I
The moderator is free to delete my three posts if the moderator finds it useful. I recommend it, because it is otherwise a waste of time for people to read them.
Moderator Response:[BL] Others may make the same mistake, so we'll let them learn from you. :-)
-
plincoln24 at 20:04 PM on 4 November 2021The Keeling Curve: Part I
Oh, now I see it. They are footnotes. Not references to sources. I wrote to early for my own good.
-
plincoln24 at 19:51 PM on 4 November 2021The Keeling Curve: Part I
The above article uses source references 1,2,3 etc. But I have been unable to find the sources these refer to. Am I missing something or did the author forget these?
-
It's the sun
Chuck #1289:
Your stove analogy fails because the oceans are not cooling. If anything, their warming seems to have accelerated over the last few decades.
Here's the temperature anomaly of the upper 100 metres:
And here's the change of heat content in the upper 2000 metres:
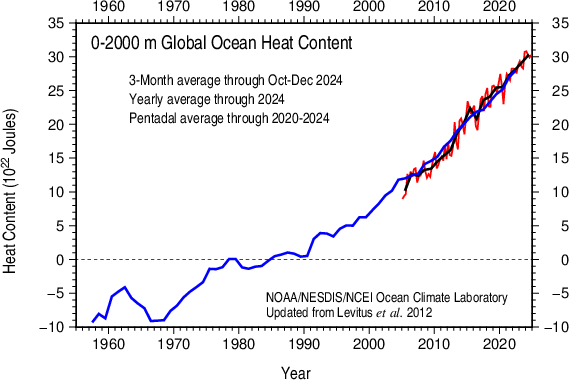
The Sun has cooled, but the atmosphere and the oceans keep warming. The only explanation making sense is that the Earth gives off less heat to space.
-
Jim Eager at 07:14 AM on 3 November 2021SkS Analogy 25 - Emissions vs Accumulation
Are you deliberately missing the point? It has nothing to do with the radiative forcing of H2O, it has to do with the fact that you can not directly increase the amount of water vapour in the atmosphere without first warming the atmosphere, otherwise the added H2O will simply condense out.
Thought experiment: Remove all other greenhouse gasses from the atmosphere except water vapour. What will happen?
The greenhouse effect will be reduced, cooling the surface and atmosphere. As a result the atmosphere will be able to hold less water vapour, so it, too, will be reduced by condensation and precipitation, thereby further reducing the greenhouse effect. As a result the atmosphere will be able to hold even less H2O. And so on. Pretty soon this will effect surface albedo as the precipitated water freezes into snow and ice, which will reflect more sunlight and reduce temperature still further.
The point is you can not directly increase H2O, which means it can not be a driver of greenhouse warming, only contribute to it as a feedback.
As for referring to Wikipedia as an authority on anything, you're joking, right?
-
cph at 03:43 AM on 3 November 2021SkS Analogy 25 - Emissions vs Accumulation
MA Rodger@10 - "H2O is a vey lazy gas and requires the presence of long-lived GHGs to get it doing"
- I would have described H²O rather as a very lively & busy GHG, which absorbs almost all IR bands (by the way, even without the presence of other greenhouse gases), - has a very short residence time in the atmosphere and as a rapidly changing & travelling medium between water - water vapor - ice or snow, - distributes powerful energy and radiation potentials inside the atmosphere. More clouds and ice with certainty could help us - in our self-made hell.
Jim Eager@11 - " it can only act as a feedback, not as a driver or forcing."
- Yet the global warming potential (GWP) and radiative forcing of emitted water vapor have not been formally quantified. The fact that H2O is understood primarily as a feedback constituent does not mean these forcings cannot be quantified, and the relatively new concept of "effective radiative forcing" allows for this to be done.
MA Rodger: "I'm not at all happy... "
Jim Eager: "This is shear nonsenese perpetuated by strident vegans..."
Wikipedia awaits your suggestions for improvement. I don't feel like counting all the cow asses of this world - I'd rather eat them up.
Moderator Response:[DB] Sloganeering and inflammatory snipped. Commenting on this page is a privilege, not a right, and that right will be rescinded if you do not abide by the comments policy. By placing comments on this page, you tacitly agree to abide by this policy and further to abide by any decision of the moderation staff to remove any comments not deemed to comply with this policy. Please read the policy in full, and make sure that you abide by these rules. Thanks for your cooperation!
-
Jim Eager at 01:13 AM on 3 November 2021SkS Analogy 25 - Emissions vs Accumulation
cph: "what do you think of H2O as the most strongest one"
While H2O is by far the main greenhouse gas, it is condensible at normal Earth temperatures so it can only act as a feedback, not as a driver or forcing. Why? To increase the amount of water vapor in the atmosphere the atmosphere must first warm by some other means, either by an increase in incoming sunlight, a change in surface albedo, or by an increase in CO2 and/or CH4 in the atmosphere, neither of which are condensible at normal Earth temperatures.
cph: "Cows and sheep livestock generate more greenhouse gases as measured in CO2 equivalents than the entire transportation sector."
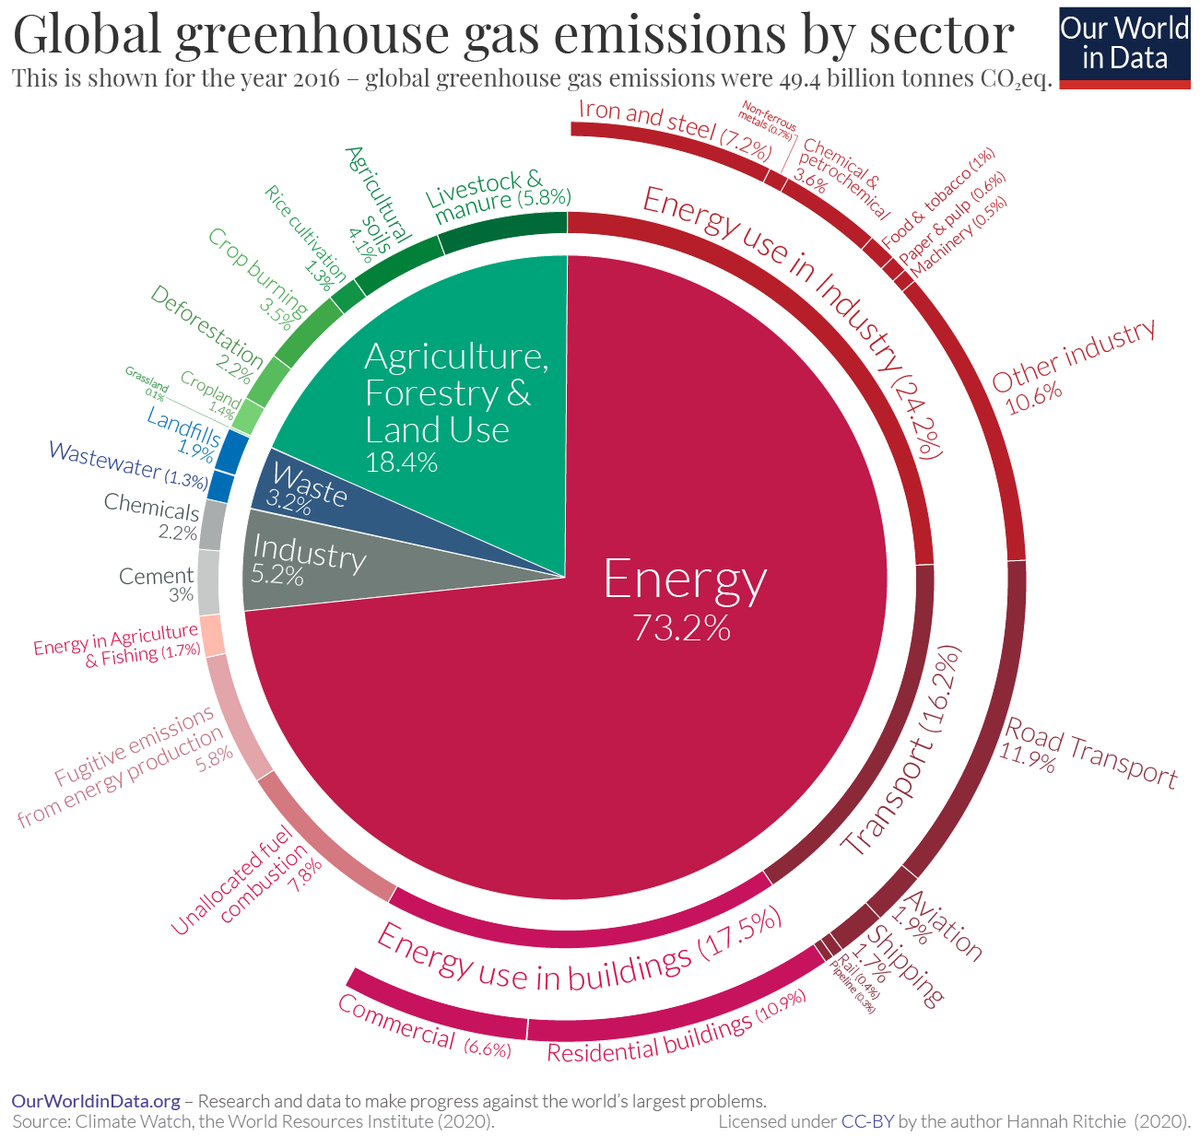
This is shear nonsenese perpetuated by strident vegans who have hijacked climate change to further their own agenda. See the sector graph MA Roger posted. One could commit the same slight of hand by combining portions of the mining, smelting, petrochemical, manufacturing, and construction sectors related to the tranport system into the transportation total. It is fundamentally dishonest to do that with livestock but not with other sectors, and it renders sector attribution meaningless.
-
Eclectic at 18:28 PM on 2 November 2021The Keeling Curve: Part I
Taurus @1 ,
welcome back! [ Er . . . are you Schwarzenegger ? ]
And thank you for the useful information you have freshly exposed.
Though it is disappointing that you omitted other similar vital information — such as the Queen of England being one of the shape-shifting Lizard People. Also the Chinese bamboo fibers in the Arizona 2020 voting papers.
Nor did you mention (for the sake of making an on-topic posting) that the annual up-tick in the Keeling Curve is caused by covert wildfires ignited by secret circumcised space lasers. (Did you see what I did there?..... mentioned the Keeling Curve!)
Moderator Response:[BL] Please refrain from responding to this user until we have had a chance to apply any necessary moderation. In this case, this includes checking for a sock puppet of any previously-banned users.
-
Taurus at 13:20 PM on 2 November 2021The Keeling Curve: Part I
Well AGW advocates, I'm back! But don't worry, I'm not here to challenge the wisdom of the infallible "experts". I just want to let you know there is no way the USA can possibly come even close to meeting the financial commitment to the "climate change" cause that the Democratic Party has supported for over a decade. At the COP26 summit now in progress in Glasgow, Scotland, it seems that Joe Biden has lost much credibility among the AGW community for lack of action on certain items promised by Obama in the Paris Agreement. This is because most Americans know full-well what Biden is up to in his "infra-structure" package, and our Congress persons aren't falling for it. In fact, we knew what he stood for well before the election, which is why it took the most massive election fraud in history to put him in office.
Aside from the climate change issue, however, there is another "crisis" in progess for which Biden is spending trillions of dollars, and that is the COVID 19 "pandemic". With what is being spent on vaccines that are neither safe nor effective and making them mandatory for more and more people as a condition for holding their jobs, our economy is sinking already. I'm afraid this is one time the AGW community will need to find funding resources other than generous "Uncle Sam". Otherwise, I guess we all roast!
Moderator Response:[BL] As this appears to be the first post by user Taurus, the claim to be back suggests a new account by a previous user. If this is the case, it violates the comments policy (no multiple identities).
In addition, the comment violates the policy that responses be on topic, and the policy against rants on politics.
[DB] Sock puppet confirmed.
-
MA Rodger at 01:51 AM on 2 November 2021SkS Analogy 25 - Emissions vs Accumulation
cph @9,
While it is correct that H2O does the heavy lifting when it comes to the GH-effect, H2O is a vey lazy gas and requires the presence of long-lived GHGs to get it doing any work at all. Thus it is the long-lived GHGs, and particularly CO2 that defines the temperature-boost of the planet's GH-effect.I'm not at all happy with your assessment of the GH-increase being caused by "cow & sheep livestock." Combining your numbers, that would suggest a 20% contribution which seem miles high. The OurWorldInData graphic below suggests just 5.8% from livestock.
Evan @5,
Beyond their source, I don't see reason to account for the anthropogenic climate forcing in any way other than the usual bar charts presented by say IPCC AR6 Fig SPM.2 below. Thus the talk of "GHG grade" or "quality" isn't advancing any analysis that I can see. CH4 from livestock is simply a climate forcing as it has elevated global CH4.
swampfoxh @1,
The CO2 breathed out by livestock is a component of that part of the carbon cycle represented by Primary Production and one of the fluxes shown in the graphic in the OP above, a carbon flux assessed by Haberl et al (2007) as having been reduced due to humanity (not just since 1750AD) by 10%, this surely through deforestation, forests being far better at Primary Production (and as a store of carbon) than a field of cows. -
cph at 21:53 PM on 1 November 2021SkS Analogy 25 - Emissions vs Accumulation
evan@5 -"We need to be concerned with more than carbon cycling."
OK. - CO2 & CH4 are the second and third most important GHG - but what do you think of H2O as the most strongest one ?
nigelj@4 - "The whole process looks carbon neutral to me."
CH4 emissions, which are reduced just as quickly as they arise, would be neutral. - ! That is certainly not the case.
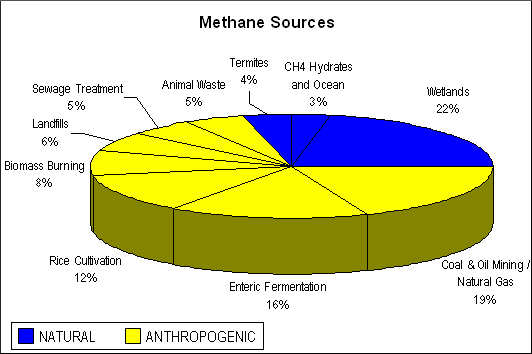
Cows and sheep livestock generate more greenhouse gases as measured in CO2 equivalents than the entire transportation sector. Livestock accounts for 9 percent of anthropogenic CO2, 65 percent of anthropogenic nitrous oxide and 37 percent of anthropogenic methane.
But these are not the only CH4 emitters:
en.wikipedia.org/wiki/Atmospheric_methane#Methane_emissions_monitoring
Natural and anthropogenic methane sources, according to the NASA Goddard Institute for Space Studies
-
Evan at 00:58 AM on 1 November 2021SkS Analogy 25 - Emissions vs Accumulation
wilddouglascounty@7 I get your point, but one of the problems with these pilot studies is that they hypothesize shifts that may only consider the resource demans of their single study subject, such as cows. The question is whether the proposed changes to feed and grazing patterns will collide with the recommendations of other pilot studies that propose using large swaths of land for BECCS or reforestation. Although I see your points, I remain skeptical that we will ever be able to fully implement the recommendations of all such pilot studies. What will it take to change the feeding/grazing habits of a billion cows or so? And a related question is this. Even if we know what to do, will we have the political/sociological will to follow through?
All the while cows are reprocessing carbon into higher GWP (global warming potential) gases. I hope you and the studies you cite are correct, but I am skeptical that we either will be able to implement these proposed changes, or that we will have the will to do so.
-
wilddouglascounty at 00:02 AM on 1 November 2021SkS Analogy 25 - Emissions vs Accumulation
I'm no biology expert but I can poke around journals to figure out enough to say that when determining the livestock net carbon impacts, more depends on how they are fed and maintained than what is the net carbon balance of the ruminant's physiology. The differences between the various food sources, containment practices, manure management and transportation puts these calculations anywhere from a net carbon sink to a net carbon emission source. Here are just a few sources--there are many more: https://www.cambridge.org/core/journals/animal/article/abs/mitigating-the-greenhouse-gas-balance-of-ruminant-production-systems-through-carbon-sequestration-in-grasslands/75C37264D0DBC0B6175DFA61574E3A6D
https://cbmjournal.biomedcentral.com/articles/10.1186/s13021-015-0040-7
-
MA Rodger at 09:35 AM on 31 October 2021SkS Analogy 25 - Emissions vs Accumulation
swampfoxh @3,
The 15 million years since the planet saw CO2 at today's level is what I would say as we are surely now well past the levels of 3 million years bp which likely didn't even reach 400ppm.
I would suggest your minimum of 240ppm over this 15 million year period to be too high. The usual value bandied about is 180ppm during an ice age while co2levels webpage gives a minimum value on its 800ky record of 172ppm back 670ky ago.
-
Evan at 08:19 AM on 31 October 2021SkS Analogy 25 - Emissions vs Accumulation
nigelj@4, although not the expert your were hoping for, here is another view. Hopefully an expert will chime in at some point. :-)
We need to be concerned with more than carbon cycling. We need to be concerned with GHG quality. As you pointed out and most people know, methane has about 25 times the warming potential of CO2. So as long as we have cows processing hydrocarbons and emitting them as a higher grade GHG, we have a problem. In this sense, it is not just about the carbon cycle, but also about the GHG grade.
We calm ourselves down by saying that as soon as we eliminate methane emissions, that methane will disappear in 10-20 years. But if we maintain our herds of cows, they will continue to reprocess hydrocarbons into higher grade GHGs.
We further calm ourselves down by saying that compared to big bad belching smokestacks that cow methane emissions are much less. But if we are successful eliminating the big bad belching smokestacks, we will find that the reprocessor cows, that increase the quality of GHGs, will represent an increasing larger, remaining part of the problem, even though they are theoretically just cylcing carbon through the system.
-
nigelj at 06:57 AM on 31 October 2021SkS Analogy 25 - Emissions vs Accumulation
Swampfox. For domesticated animals to survive they must be eating grass or grains or whatever plant life, and these plants absorb CO2. The whole process looks carbon neutral to me.
However the demise of the meat eating predators like lions and tigers and the surge in livestock farming over the last hundred years has presumably increased the quantity of methane emissions, a potent greenhouse gas.
I'm not an expert and would welcome some clear, precise, umambiguous expert, informed opinion from a biologist.
-
swampfoxh at 02:45 AM on 31 October 2021SkS Analogy 25 - Emissions vs Accumulation
Further, I think there is general agreement that CO2 in the atmosphere is the highest it has been in 15 million years, and for that matter, even the lowest it has ever been in that same 15 million years, it hovered around 240ppm. Does anyone, here, have better numbers?
-
swampfoxh at 02:37 AM on 31 October 2021SkS Analogy 25 - Emissions vs Accumulation
Sorry, the auto speller liked repired, reputed and other words, but I missed noticing that repired remained in my last comment.
-
swampfoxh at 02:31 AM on 31 October 2021SkS Analogy 25 - Emissions vs Accumulation
Domestic animal agriculture is a human invention. These animals would likely not survive in nature but for their protection by humans. Thus, the respiration by these animals contributes to excess CO2 in the atmosphere. The amount of respired CO2 by domestic animals is quite similar to the repired CO2 of 8 billion humans, so it is important to count this CO2 when determining the matter of disequilibrium now damaging the pre-19th Century planet.
-
One Planet Only Forever at 03:57 AM on 29 October 2021SkS Analogy 24 - Atmospheric Carbon Loans
RedBaron,
Great presentation regarding the "Production and delivery of what we consume" being an important part of the problem to be addressed. But there is more to consider than the Carbon impacts.
The Planetary Boundaries concept and understanding of impacts of human activity exposes many other important considerations.
One important point is the need to reduce consumption, especially reducing consumption of higher impacting things. And more holistic evaluations of all impacts help identify the "bigger bang for the buck" alternatives to reduce consumption of.
A related important understanding is that richer people should be less harmful, leading by example. Being richer is a privilege to lead by example. It does not confer the "Right to be more harmful because a richer person can afford it". Richer people should be the ones who are most supportive of more expensive less harmful ways of producing things.
An example:
It is clear that free-range grazing cattle raising can be beneficial from a Carbon perspective. But clearing rain forest, or any forest, to expand grazing ranges for cattle is not helpful. And there are other impacts to consider.
Richer people should be the most aware. They should be rejecting and resisting activity that is more harmful and less helpful even if the more harmful less helpful ways are more popular and more profitable. The rich can still eat beef, but smaller portions less frequently. And the richest should only eat the least harmfully produced beef - to prove that they are truly superior to Others, truly deserving to be the richest.
-
Bob Loblaw at 03:26 AM on 29 October 2021CO2 effect is saturated
The approach described by cph - add absorbers one at a time, subtract one at a time - is indeed the methodology used in the Schmidt et al paper I linked to in comment #634.
-
cph at 02:59 AM on 29 October 2021CO2 effect is saturated
andrewhoward @628 - a more specific answer to your specific question could go something like this:
In terms of mass & volume, water vapour is much more prevalent (~80-90%).
However, the radiative importance is less due to molecule structure. One way to quantify this is to take a radiation model and remove each long-wave absorber and see what difference it makes to the amount of long-wave absorbed. This gives the minimum effect from each component.
The complementary calculation, using only each particular absorber in turn, gives the maximum effect. Generally these will not be equal because of overlaps in the absorbing spectra. The radiation at particular frequencies can either be absorbed by water vapour or any other GHG.
-
RedBaron at 09:35 AM on 28 October 2021SkS Analogy 24 - Atmospheric Carbon Loans
The kinds of food you eat have from little to nothing to do with Anthropogenic Global Warming (AGW) caused climate change, one way or the other. Rather, how and where what you eat is produced would have a much bigger impact. In fact being vegetarian worldwide could even be counterproductive in the fight to end climate change.
The reason for the confusion is what they call a “life cycle assessment” in calculating carbon footprints.
Product Life Cycle Accounting and Reporting Standard: This standard involves understanding GHG emissions related to a specific product, based on raw materials used, production, distribution, and disposal. [1]
Just to simplify things a little, lets break down the carbon footprint of a tomato.[2]
The primary importance in calculating tomato carbon footprints depend on the season and the type of production system as well as transportation, storage and refrigeration.
Basically you figure out the amount of fossil fuels used in the chain of supply from the farmer to the fresh market. Greenhouses need heated in winter, and cooled in summer. The fertilizer used could possibly be made from haber process nitrogen[3] which is made from Natural gas. Trucks deliver the tomatoes to markets and burn fossil fuels to get there. The market probably uses electricity made from fossil fuels to keep the air the ideal temp for storage and prevent them from spoiling. All of these factors added up together give us a quantified idea of the total fossil fuels used and a carbon footprint is calculated for each pound of tomatoes. Basically the tomato itself, like all food, has no global warming effect at all, but all the other things like fertilizers, production, distribution, and storage do!
So how do we fix this?
Well starting with fertilizers. Instead of haber process nitrogen used to make NPK fertilizers, we could use natural fertilizers like compost and manure. That would greatly reduce the carbon footprint of food production worldwide. Geothermal and solar heated and cooled greenhouses eliminate the need for fossil fuel use in out of season tomatoes.
Next is location. The backyard grown garden tomato has no transportation needed. A local organic farmer might have some fuel costs to drive to the local farmers market, but minimal if a close neighbor. Also electric vehicles, powered by electricity produced by hydroelectric, wind, solar, nuclear, have almost no carbon footprint. So transportation improvements and shopping local or growing a garden can reduce the tomato carbon footprint a lot. If you need a fresh tomato out of season, make sure the greenhouse growing the tomato is local. If it is an organic, geothermal heated, local greenhouse produced tomato, all the better!
One thing typically not included in calculating the carbon footprint of a tomato is soil carbon. It should be, but isn’t typically included because data is limited. Certain production methods (mostly organic and permaculture methods) have been shown to improve soil carbon dramatically. This soil carbon would need to be subtracted off the emissions side of tomato production. It is theoretically possible then to produce a tomato that has a negative carbon footprint, as long as the production method increases soil carbon more than the emissions caused by fertilizers, production, distribution, and storage.
Soils from organic farms had 26 percent more potential for long-term carbon storage than soils from conventional farms, along with 13 percent more soil organic matter (SOM).[4]
Better data would be needed to actually calculate carbon footprints based on soil carbon. But it is clear that some farmers have been able increase the carbon in their soils, and as long as the other side is not too high by using some of the above solutions to reduce emissions, we should be capable of mass producing tomatoes with negative carbon footprints! We are not now, not at any scale to speak of at least. But we potentially could!
Being a vegetarian could in fact be quite helpful in mitigating climate change, as long as the vegetables were fertilized, produced, distributed, and stored in these improved ways! Every bite you took of vegetables you eat could actually by a tiny amount mitigate climate changes caused by us humans! Not a lot mind you, but there are billions of people on this planet, and if enough of them did this, a little multiplied by billions of bites could indeed add up to a big improvement!
What about meat?
There is one thing that needs addressed though. Meat production is very similar to the above. Carbon footprints of meat production are all life cycle calculations as well! Most the carbon footprint for animal foods also lies in production, distribution, and storage! However, if what we feed a chicken or a cow etc has a positive carbon footprint, and the animal eats lots of that food to grow itself, then the carbon footprint becomes multiplied by how much food it eats![5] Some animals can actually eat so much that their feed conversion is as much as 10x! Certain industrialized production methods for meat production can have insanely huge life cycle assessment carbon footprints for this reason, as much as ten times higher than vegetable carbon footprints. That’s why you see so many campaigns to reduce meat consumption in the media these days. Keep in mind though, these are also life cycle assessments. The meat itself is carbon neutral or close to it, it's the fossil fuels used in production mainly to blame for the multiplied effect.
“The number one public enemy is the cow. But the number one tool that can save mankind is the cow. We need every cow we can get back out on the range. It is almost criminal to have them in feedlots which are inhumane, antisocial, and environmentally and economically unsound.” Allan Savory
But here is the nuance. If what we fed those animals had a negative life cycle assessment of carbon footprint for the feed we gave it, then we would be multiplying that number by as much as 10x too! So in theory we could produce animal foods with as much as ten times better NEGATIVE carbon footprints as vegetable foods! And by the way, people are doing that right now in fact. There actually are farmers raising both crops and animals with such improved NEGATIVE carbon footprints.
So you see? It's not the food, it's how that food is produced and distributed.
“Yes, agriculture done improperly can definitely be a problem, but agriculture done in a proper way is an important solution to environmental issues including climate change, water issues, and biodiversity.”-Rattan Lal
In that potential future case where all our future foods are produced, distributed and stored properly, then a vegetarian would not be helping end human caused climate change as much as a standard diet. But right now, that future does not exist. Right now being vegetarian does indeed help! However, changing the entire worlds dietary habits would seem to be much harder than just raising our food better to begin with! We had made that effort to produce the so called "green revolution" and that worked. We could do the exact same strategy again, this time emphasizing reducing carbon footprints in agriculture. It could work. And without the obvious dead end that simply forcing the world to become vegetarian has.
-
Evan at 07:58 AM on 28 October 2021SkS Analogy 24 - Atmospheric Carbon Loans
swampfoxh@5 Professor Kevin Anderson has some opinions worth considering on this subject. In his opinion, NET cannot offset our fossil-fuel carbon emissions, but maybe able to offset our agricultural-based emissions. Here is an interview with Kevin Anderson worth watching. Quite simply, it is very unlikely that NET will ever allow us to safely continue to burn fossil fuels as we currently are.
-
swampfoxh at 07:41 AM on 28 October 2021SkS Analogy 24 - Atmospheric Carbon Loans
It might also be said that global outlawing of Industrial Animal Agriculture is much easier than eliminating fossil fuels, since the human diet would not suffer from the elimination of animal flesh, while the loss of fossil fuels as an energy source probably demands considerable and wrenching changes in energy production technologies. What would NET look like if aimed at Industrial Animal Agriculture rather than fossil fuels?? (or aimed at both?)
-
Bob Loblaw at 07:29 AM on 28 October 2021CO2 effect is saturated
I have now read enough of the Coe et al paper to form an evaluationbased on its content, rather than its origin.
As MA Rodger says, they ignore emissions from the atmosphere - although they do use terms that suggest they've at least heard of it. The bizarreness of their model show up early,in section 1.4 "The Impact of Retained Energy". They are talking about IR energy absorbed by the atmosphere, and state (p31):
"What happens to this absorbed energy? Some will be retained by the atmosphere/earth system, and some will be re-radiated by the atmosphere through to space.
This is not even wrong. If the earth/atmosphere system were constantly retaining energy, it would be constantly warming. They have completely confused the effect of re-radiation downwards as if it is some permanent retention of energy. It is not. That energy joins the rest of the energy, to be re-radiated again and eventualy lost to space. At equilibrium, no "retention of energy" is happening and gains from the sun equal losses to space and temperatures are constant.
They intoduce n as an "energy retention factor", and start talking about atmospheric absorption fractions, but all of that is already built into the "earth emissivity" term they use in equation 1 (the standard zero-dimensional model). They have also completely ignored the fact that vertical energy transfer in the atmosphere includes convection - probably part of the "complex atmospheric thermodynamics" that they explicitly ignore.
All of these extra terms they introduce are smoke and mirrors. They argue that the real atmosphere is far too complex to model, and then create a simple model that is far too wrong.
The rest of their manipulations of HITRAN data and "atmospheric absorption calculations are all just hand-waving and not worth any further examination.
-
swampfoxh at 07:27 AM on 28 October 2021SkS Analogy 24 - Atmospheric Carbon Loans
No one, (on this thread), has yet pointed out that fossil fuels are probably the lesser troublesome contributor to global warming. The ecological damage and apparent adverse climate change generated by fossil fuel-burning is small compared to Industrial Animal Agriculture's contribution. There is a study, currently under peer review, that purports to show that Industrial Animal Agriculture contributes betweeen 19.2 and 30% of global GGEs. Similar evidence has been published before about Industrial Animal Agriculture's impact on the environment, including descriptions of other crucial climate disruptors like excessive water use, domination of arable lands for livestock feed and maintenenace versus plant food production for humans, eutrophication of the oceans, waste stream contamination of municipal potable water supplies, broadcasting of endocrine disruptors, antibiotics, hazardous chemicals...the list goes on.
-
nigelj at 06:49 AM on 28 October 2021SkS Analogy 24 - Atmospheric Carbon Loans
"Unsustainable financing (i.e., debt) is often used to establish strong foundations."
Strange choice of words. Its not clear why debt is considered unsustainable. Surely debt that is prudent, and time limited, and builds useful things is sustainable? In fact the rest of the article seemed to suggest this. However the overall analogy seems quite good to me.
-
Bob Loblaw at 05:31 AM on 28 October 2021CO2 effect is saturated
MA Rodger links to a 2005 RealClimate post that discusses the relative importance of CO2 and water vapor in IR transfer. A more recent journal paper on the subject is:
Schmidt, G. A., Ruedy, R. A., Miller, R. L., and Lacis, A. A. (2010), Attribution of the present‐day total greenhouse effect, J. Geophys. Res., 115, D20106, doi:10.1029/2010JD014287.
Gavin Schmidt is, over course, the one that wrote the RealClimate post, too.
Discussion of water vapour vs. CO2 belongs on the following thread, though:
-
Bob Loblaw at 00:59 AM on 28 October 2021CO2 effect is saturated
...and another comment on the Berry paper is here:
-
Bob Loblaw at 00:56 AM on 28 October 2021CO2 effect is saturated
As a quick follow-up, the same journal in a 2019 issue has the following:
Human CO2 Emissions Have Little Effect on Atmospheric CO2, Edwin C Berry
This paper has been previously discussed at SkS on the human emissions of CO2 post:
https://skepticalscience.com/argument.php?p=7&t=352&&a=16#137046
More evidence that the "journal" in question will accept all sorts of crackpottery.
-
MA Rodger at 00:49 AM on 28 October 2021CO2 effect is saturated
andrewhoward @628,
Concerning the 'nit-picking', back in September there was no sign of the Coe et al paper [full paper here] but instead another paper occupying those pages. It thus appeared at that time to be somewhat more than 'nit-picking'. There since has been some page re-numbering by the journal which isn't very professional and the side-bar buttons for 'Submit a Manuscript' and 'Become a Reviewer' and even 'Launch a New Journal' suggest a title that is more vanity publishing than serious science.This would not be the first time denialists have accessed HITRAN to produce a pack of nonsense. Their description shows them calculating how much surface radiation is absorbed by the various GHGs and ignoring the emissions from the atmosphere. It is the density/temperature of the GHGs where they emit into space that determines the GH-effect so the paper's calculations are simple nonsense.
In terms of their basic findings, they find H2O alone would provide 91.8% of the GH-effect, CO2 alone would provide 24.7% but when added to H2O, CO2 would provide an additional 7.7%. The CH4 & N2O alone value isn't expressly given while their additional contribution is 0.5%.
This is all very silly. This RealClimate post provides a more conventional set of findings but includes further contributions to the GH-effect. Thus the CO2 percentages do not look greatly different. But H2O alone is given as just 66% and while the 'Other GHG' (which would be more than just CH4 & N2O but they would be the lion's share) provide an additonal 2%.When Coe et al address ECS, they are entirely off with the fairies. It is well known that the forcing from 2xCO2 increases global temperatures by +1ºC. These jokers manage to find just +0.4ºC, a certain maker of 'idiots-at-work'. Coe et al say ECS estimates range from +1.5ºC to +4.5ºC. The usual best estimate is seen as +3ºC, thus a trebling of the CO2 warming through feedbacks. The statement by Coe et al that "More recent work, however, suggests ECS values of less than 1degC" is plain wrong - a cherrypick of fellow denialist work. Coe et al prattle through a pack of nonsense to turn the climate feedback from a best estimate +200% into just +12.4%. Of course, if such a crazy finding were in the slightest bit serious, it would need nailing down and strongly justifying. But Coe et al jump straight to what is the purpose of their task and so predictably conclude "There is no impending climate emergency and CO2 is not the control parameter of global temperatures."
-
Bob Loblaw at 00:31 AM on 28 October 2021CO2 effect is saturated
Andrewhoward:
I have downloaded the paper and will try to look at it. Michael Sweet has noted the lack of background of the three authors. Also note that the page you linked to provides received, accepted, and publication dates:
- Received August 2, 2021.
- Accepted August 11, 2021.
- Published August 23, 2021.
Nine days for an editor to look at a paper, send it to reviewers, get reviews back, evaluate the reviews, and get the authors to address any deficiencies in the paper and resubmit a revised paper, assess the revisions, and accept the final paper? I don't think so.
This tells me that the journal has essentially no review process in place, and will publish pretty much anything.
And the company that "publishes" the journal (Science Publishing Group, also known as SciencePG and SciPG) is on Beall's list of potentially predatory publishers:
The chances that this paper represents a noteable scientific advancement is pretty close to zero.
...but I will try to read the paper.
-
Evan at 23:37 PM on 27 October 2021SkS Analogy 24 - Atmospheric Carbon Loans
wilddouglascounty@1 Can't argue with your logic. Analogies usually have shortcomings, and this one is no exception. What I was trying to get people to understand is the delay between cause and effect. Another message was not to villify past fossil-fuel use, but to note that we need to move on to more sustainable energy use. I share your reservations about the use of NET, but because NET is a central component of current IPCC models, I thought it good to put them in perspective, in the sense that they are being proposed as a method to pay off our "debt".
But I agree with your reservations about NET.
-
michael sweet at 23:08 PM on 27 October 2021CO2 effect is saturated
Andrewhoward:
I just read the abstract you linked. I noted that the three authors have no experience in atmospheric sciences. They claim that doubling CO2 would result in a 0.5C increase in surface tempeatures with other human generated gasses being insignificant. Since the temperature has already risen 1C and we have not reached a doubling yet it seems to me that their analysis is obviously incorrect.
Why do you think that this example from persons unskilled in the art of atmospheric science is worth our time to analyze? The IPCC report is compiled by experts in the field, not beginners.
I continue to be amazed at conservative people in the USA who refuse to accept data from scientists and then dose themselves with dangerous drugs that have been shown to have no effect against covid. The same argument applies to "papers" by unskilled people like the one cited by Andrewhoward. MARodger can ddress what mistakes were made in the "paper".
-
wilddouglascounty at 22:35 PM on 27 October 2021SkS Analogy 24 - Atmospheric Carbon Loans
This can be a big picture metaphor that helps folks understand the issue, but it has oversimplified the issue considerably by seeing the carbon emissions and removal as a kind of loan and repayment. For instance the Negative Emissions Technologies include a very unsettled range of protocols that are highly speculative, have a wide range of social, financial, political and ethical consequences, some of which is explored here: https://media.nature.com/original/magazine-assets/d41586-018-06695-5/d41586-018-06695-5.pdf as just one example. There is some question about how the impacts of some NETs could have adverse impacts on global ecosystems almost as great as the problem it is supposed to solve. Finally, the financial barriers to large scale implementations of NETs is explored here: https://direct.mit.edu/glep/article-abstract/20/3/70/95059/Large-Scale-Carbon-Dioxide-Removal-The-Problem-of?redirectedFrom=PDF leaving in question the viability of large scale deployment of many of these technologies, let alone the sustainability of doing so for very long.
In other words, to oversimplify, if NETs is seen merely as a carbon cash source for paying off the carbon debt, this is akin to accepting bank robberies, drug sales, kidnapping, bogus investment and Ponzi schemes as viable carbon cash sources for the repayment of our carbon debt.
-
andrewhoward at 20:28 PM on 27 October 2021CO2 effect is saturated
MA Rodger @626
I am brought to this site/thread by searching on the Coe, Fabinski, Gerhard paper http://www.sciencepublishinggroup.com/journal/paperinfo?journalid=298&doi=10.11648/j.ijaos.20210502.12
This does indeed seem to have been published, albeit in an open access "journal" - so I am slightly puzzled by what you wrote - indeed your link takes me not to pages 29-41 as writ, but to different pages (and indeed to a different article). The "climate change denying" article does indeed appear at pages 29-40 in the same journal. The author list is shorter.
The publication status and page numbering is all nit-picking (by me) - I mention it just for completeness. I am more interested in knowing whether there is a simple rebuttal to the analysis in said article. I am not a practising scientist and my maths and physics are rather rusty. I can see that the claims in the article fall into the "CO2 is saturated" category. It appears to present a sophisticated numerical demonstration of this saturation and I'm interested to know where it might be wrong (or not). Can anyone oblige?
Moderator Response:[BL] Link activated.
The web software here does not automatically create links. You can do this when posting a comment by selecting the "insert" tab, selecting the text you want to use for the link, and clicking on the icon that looks like a chain link. Add the URL in the dialog box. -
Bob Loblaw at 06:26 AM on 26 October 2021It's albedo
MAR:
The graphs are a bit hard to read, but your link to the paper at ResearchGate provides a way to download the entire paper as a PDF, and the graphs (and others) can be easily read there.
The most interesting aspect of the graphs in that paper (in the context of the horribly over-simplified views of the insistent commenter) is the complexity they show. Both the diagrams such as the ones you point to, where we see zonal averages (function of latitude), and in the maps that they provide (showing two-dimensional variability).
Of course, several people tried to explain some of that complexity to the insistent commenter, to no avail. The insistent commenter's claim of increases in surface evaporation leading directly to proportional increases in cloud cover and changes in radiative forcing (based on a global diagram), remind me of this well-know cartoon. (Hint: the insistent commenter is the one that is trying to foist the miracle as as if it is a proper explanation.)

-
MA Rodger at 01:40 AM on 26 October 2021It's albedo
I was reluctant to look into the values of Cloud Radiative Effect by location as up-thread the idea that added cloud & associated albedo came without added warming from water vapour seemed to be too difficult to accept by an insistent commenter and I wasn't sure how supportiive the result would turn out to be.
However, Calisto et al (2014) does provide in its Fig 7 the positive and negative components of CRE by latitude for both Land & Ocean and they can be easilyare here adapted to show net CRE as in the following graphic (assuming the graphic is visible to others when I link to it). The net CRE by latitude is the gap between the bold red trace & the green/blue trace in the upper panels.
-
David-acct at 07:31 AM on 24 October 2021The scientific consensus on climate change gets even stronger
Jim - Tol's comment seems to be Tol's way of stating that he thinks both the denominator and the numerator are invalid for purposes of the caluclation
-
Jim Hunt at 21:09 PM on 22 October 2021The scientific consensus on climate change gets even stronger
In a perhaps surprising recent development regarding the change in consensus among economists, Professor Dr. Richard S.A. Tol MAE endorsed the Cook et al. approach:
https://twitter.com/jim_hunt/status/1450569971378106378 -
michael sweet at 21:51 PM on 21 October 20212021 SkS Weekly Climate Change & Global Warming News Roundup #42
Greta Thunburg has an opinion piece inThe Guardian today. She says actions that have been proposed are insufficient and calls for one leader of a major country to step forward and take real action. It is well written and informed.
-
One Planet Only Forever at 06:20 AM on 17 October 2021Overconfident Idiots: Why Incompetence Breeds Certainty
Dunning-Kruger types of over-confidence and misunderstanding do indeed affect everyone - constantly.
As a Professional Engineer I appreciated having my work checked by a peer. Occasionally they would find something that was an obvious error that I missed even though I had set the work a side and then reviewed it again before sending it to be checked. Constantly being reminded about how easy it is to miss something obvious was sobering.
An additional measure to reduce the potential for Dunning-Kruger misunderstanding by Professional Engineers in Canada is a requirement for Professional Engineers to be Constantly Learning about their area of expertise, and other topics related to the work they do. That increased awareness increases the chances of noticing something unusual.
A related concern is the mistake that can be made when a computer analysis produces an unusual result but the person who ran the analysis does not sense that the result was unexpected. Inexperience, or an incorrect faith that a computer analysis must be correct (computer results are better aren't they?), can lead to a Dunning-Kruger type of result.
The number of Serious Climate Scientists producing results confirming the consensus understanding creates a basis for questioning unusual analysis results ... leading to more investigation, not dismissing the results.
The smaller number of people trying to claim the consensus understanding is wrong appear more likely to suffer from motivation to believe something that does not make sense, which is a form of the Dunning-Kruger syndrome. And of course there are the misleading marketers who likely understand that they are being misleading - nothing Dunning-Kruger about that. That is intentionally harmfully misdirected intelligence (but very hard to prove the harmful misleading intent).

Prev 90 91 92 93 94 95 96 97 98 99 100 101 102 103 104 105 Next


