


 Arguments


Conservatives are again denying the very existence of global warming
Posted on 10 July 2017 by dana1981
As we well know, climate myths are like zombies that never seem to die. It’s only a matter of time before they rise from the dead and threaten to eat our brains. And so here we go again – American conservatives are denying the very existence of global warming.
Working backwards from a politically-motivated conclusion
The claim is based on what can charitably be described as a white paper, written by fossil fuel-funded contrarians Joseph D’Aleo and Craig Idso along with James Wallace III. Two months ago, D’Aleo and Wallace published another error-riddled white paper on the same website with fellow contrarian John Christy; both papers aimed to undermine the EPA’s Endangerment Finding.
The Endangerment Finding concluded that the scientific research clearly shows that carbon pollution endangers public health and welfare via climate change impacts, and therefore according to the US Supreme Court, the EPA must regulate carbon pollution under the Clean Air Act. Conservatives who benefit from the fossil fuel status quo and oppose all climate policies have urged the Trump administration to go after the Endangerment Finding.
Both papers are rife with flaws because they start from a desired conclusion – that the science underpinning Endangerment Finding is somehow wrong – and work backwards trying to support it. In this paper, the contrarians try to undermine the accuracy of the global surface temperature record, which has been validated time and time again. They don’t bother trying to hide their bias – the paper refers to “Climate Alarmists” and speaks of invalidating the Endangerment Finding.
The errors in the white paper
The paper itself has little scientific content. Using charts taken from climate denier blogs, the authors claim that every temperature record adjustment since the 1980s has been in the warming direction, which is simply false. As Zeke Hausfather pointed out, referencing work by Nick Stokes, roughly half of the adjustments have resulted in cooling and half in warming. Moreover, the net adjustment to the raw data actually reduces the long-term global warming trend:
Additionally, a peer-reviewed study last year led by Hausfather verified the validity of the temperature adjustments by showing that they bring the data in closer agreement with that from pristinely located temperature stations.
The white paper also claims that the adjustments remove a “cyclical pattern” that appeared more clearly in early versions of the temperature record. As Hausfather told me, that’s simply because we now have more data that better represent the planet as a whole:
What they don’t tell you is that the 1980 record in question only comes from around 500 land stations almost entirely in the Northern Hemisphere and does not include any ocean data at all. There is a well-known warm period in the mid-to-high latitude land areas of the Northern Hemisphere in the 1930s and 1940s, but it does not really show up much in the oceans and not at all in the Southern Hemisphere. As scientists have collected more historical temperature records from around the world in the past 35 years, we have created more complete records that show less warmth in that period simply because they cover more of the planet.
And of course natural thermometers validate this global warming as well. Ice is melting, species are migrating, spring is arriving earlier, sea levels are rising, oceans are warming, humidity is rising, and so on. The contrarian white paper also references satellite estimates of the temperature of Earth’s atmosphere – estimates that one group recently found are in close agreement with the global surface temperature record.
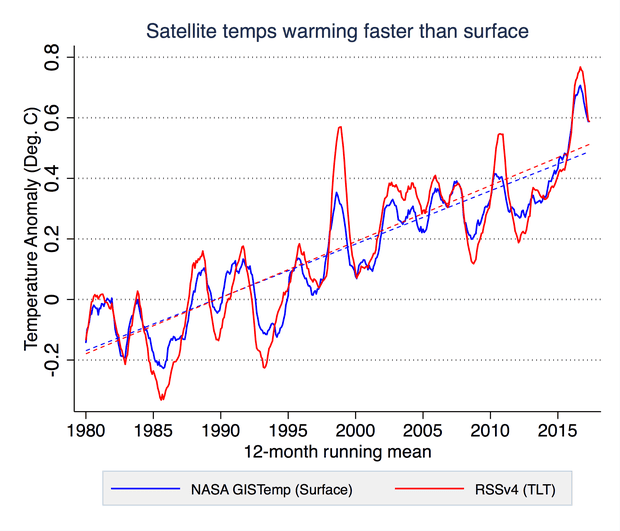
Comparison of NASA surface temperatures with RSS satellite temperatures. Illustration: Zeke Hausfather, Carbon Brief.
The white paper authors admit that some adjustments to the raw data are necessary (for example, to correct for changes in instrumentation technology, time of observation, moving station locations, and so on), and they don’t dispute the accuracy or necessity of any of the adjustments that climate scientists have made. Basically, because they don’t like the end result of global warming, the authors assert that the adjustments must somehow be wrong, but fail to support that assertion with any real evidence. It’s not worth the paper it’s printed on.
Picked up by the right-wing media
Predictably, a number of conservative media outlets like the Daily Caller and Climate Depot picked up on the white paper. The Daily Caller even went as far as to call it a “peer-reviewed study.” In a sense that’s true – a number of other fossil fuel-funded contrarian scientists who are technically the authors’ peers signed onto the paper. But of course that’s really pal review, not peer review; the white paper was not published in a peer-reviewed journal because it obviously would not withstand scrutiny by scientific experts.
It’s telling that these contrarian white paper efforts to undermine the established climate science supporting the EPA Endangerment Finding are so poor. They’re forced to resort to conspiracy theories, implying that climate scientists from around the world are all falsifying data, adding a global warming signal to the temperature record that we also happen to see in nature and in satellites. As Hausfather put it:


Noam Chomsky - "The Most Dangerous Organization in Human History"
www.youtube.com/watch?v=O34JM4Xdf3g
It's certainly false to claim everything or most things are adjusted up. The following link is a good explanation of why temperature adjustments (corrections) are made. I tracked this down to figure out whats going on.
theconversation.com/why-scientists-adjust-temperature-records-and-how-you-can-too-36825
It's the raw data thats "unreliable" to some extent (although not hugely). Urban heat islands bias things up, stations are moved, often biasing things down, thermometers sometimes break, or are old and less reliable, etc. These are corrected, and are easy enough to quantify. It would be crazy not to correct for these issues.
The following link shows raw and adjusted data for global land, ocean and land ocean combined temperatures.
variable-variability.blogspot.co.nz/2015/02/homogenization-adjustments-reduce-global-warming.html
Land temperatures are adjusted up slightly, but ocean temperatures are adjusted down, and combined land ocean temperatures are adjusted down! This is the most important and complete data set. This seems lost on the denialists.
The above cmments say it all, as does:
http://variable-variability.blogspot.com/2017/07/NOAA-NASA-Hadley-CRU-Global-Average-Surface-Temperature-Data-EPA-CO2-Endangerment-Finding-best-project.html?m=1
[PS] Fixed link. Please create them with link tool in the comments editor rather than wasting moderators time.
In a discussion with a pseudo-skeptic there was only one point that he made that I couldn't understand. It related to temperature adjustments and so I will ask about it here. He produced two global temp records from NASA that were quite different:
This one he says is from 2001
FigA.txt 2001 from GISS
And this one is from 2016
FigA.txt 2016 from GISS
I've not been able to find anything that would explain why there is such a difference. I'm assuming both data sets are from NASA. I also know there are more than enough reasons to know adjustments are doing the right thing but is there anyone here who has run across this one and knows what the reasons are?
[BW] Replaced link text to make it shorter
rugbyguy59 @4, if your pseudo-skeptic informant could navigate to those pages (linked from here), he could also navigate to the history page on the same site, where an explanation of the differences is given. Between 2000 and 2016 the major changes are:
In addition, NASA GISS switched to using satellite night light data to identify areas of increased urbanization for the urban heat island adjustment, and areas above sea ice had temperatures determined by air temperature rather than by underlying water temperatures (which in winter can be 10s of degrees warmer).
The effect of the changes from 2000 to 2016 was to reduce the trend from 1950 to 2000, ie, the end of the period of overlap, as can be seen in this graph:
As can also be seen, the effect of the changes over the years have been minor, except for that between 1987 and more recent versions. Of course, the 1987 version relied on just 2,200 stations (8.5% of the current number), and had no Sea Surface Temperature data.
Just wondering if your pseudo-skeptic also believes:
1/ glaciers cant be melting because somewhere there is one advancing
2/ Sealevel rise is caused by coastal subsidence
3/ NASA, JAXA, ESA are conspiring to doctor photos of the poles to make it look like ice is melting.
After all, if GW is just due to adjustments to the temperature record then it follows that ice cant be melting and the sea isnt rising.
I made an inadvertent error when I wrote @5, "...the changes from 2000 to 2016 was to reduce the trend from 1950 to 2000". In fact the reverse is the case, with the trend increasing from 0.11 C/decade to 0.15 C/decade. The reasons for the change, however, remain fully justified as detailed above. Sorry for the error.
waht does ocean temperature mean exactly? ... e.g. the whole ocean, the surface waters of the ocean or the air 1 metre or so above the ocean
John S @8.
Bar one instance, the talk of "ocean" data in this OP/comment-thread refers to SST (sea surface temperature). (Note, there is one statement in the OP saying "oceans are warming" which would sensibly refer to Ocean Heat Content.) The surface air temperature (SAT) above the ocean and also the skin temperature of the ocean will vary greatly with time of day. But unlike on land, it is impractical to monitor SAT at sea to obtain max/min daily values. SST is not greatly affected by time of day, averaging less than ½ºC (as per fig 2 of Kennedy et al 2007) although in still conditions this can be far greater.
Thanks, Tom. I greatly appreciate the effort, quick reply, and the hints about how to check these things. If one positive thing has come from the hours spent confronting these people it's that my own knowledge of science, climate, and the Internet continue to grow.
scaddenp @6 He's a lukewarmer and somehow the idea that small increases in temp "exaggerated by homogenization" can cause these big changes in the real world makes sense to him... without making him think; Wow, these are some big changes.....!
And then there is the hockey stick and the incriminating evidence "in writing" that damnably condemns the climate change sycophants; or would that be psychophants? There is no logical or scientific evidencial explanation for "the pause." Did man suddenly call on the cooling gods to reverse warming? It used to be that science was defined by theories based upon repeated experimentation and explainable from a formulated hypothesis. And even under that premise, honest scientists would admit, there is still a margin for error--possibly completely false--no matter the evidence. As is always the case: follow the money.
[JH] Blatant sloganeering snipped.
Oh, I see it is just fine that leftist wili violates policy with a radical leftist nutcase like Noam Chomsky. I am positive posting a "political" video of the informed and far more plausible right wing would be unacceptable: "Political, off-topic or ad hominem comments will be deleted. Updated Comments Policy..."
[JH] Blatant sloganeering snipped.
Climate Feedback published a scathing review of Delingpole's Breitbart article about this white paper.
Overall rating: -1.8 for Scientific credibility
Earthking doesn't refute the article in detail, and resorts to calling people names, and raising other issues to score points, and distract attention. However the issues he raises are all nonsense.
For example, we are not reliant on Michael Mann's early hockey stick study. Numerous other studies using different data and / or statistical techniques have found much the same hockey stick, eg Briffa or Espers studies.
The so called pause is insignificant, plainly obvious in the nasa giss global data as below:
data.giss.nasa.gov/gistemp/graphs_v3/
It's the long term 20 year plus trend that counts, and can be estimated. This is driven by greenhouse gases and fundamental quantifiable solar issues. Nobody can predict the wiggles along the way, or decadal length variability related to ocean cycles, because its partly random.
I live in BC, the forcast today is sunny with smoke from the wildfires that are all across this Canadian province, it has been this way for a week and is forecast for days to come.
NASA is detecting the smoke from the worst wildfires in Siberia in 10,000 years.
Siberian Wildfires
There are so many indicators like this that the climate in many places has been altered significantly already with more to come that denying human forced climate change is purely an exercise in marketing, not even marginal science. People make a living selling fossil fuels indirectly by denying the negative impacts in almost exactly the same way they sold so many cigarettes for so long long by concealing how dangerous they are.
Big tobacco and climate change denial
It's basically lying for a living in the interests of a product that is eventually going to kill off not just billions of people if left un-mitigated, it will take out a huge swack of the entire biosphere just like any carbon dioxide driven extinction event in the past. The tobacco industry used denial of the science to "recruit" replacement smokers for the ones their products killed.
We don't have a replacement Earth.
Doug_C, yes well said. The manufacturers of tobacco and oil / coal etc have a lot in common, including huge vested interests, and a historical tendency to deny the science, and blatantly misslead people. Both groups knew about the problem, and knew it was real, much earlier than they admitted.The book "Merchants of Doubt" documents some of this.
I have also often wondered if the users fossil fuel use also have a sort of addiction, or at least an ingrained habit and of course that includes many of us. In my view theres no real hard line defining what substances can form addictions, or when an addiction becomes a habit. I think it's all just matter of degree to some extent, and more a question of whether the addiction is causing more harm than good.
nigelj, I hadn't thought of the addiction aspects of fossil fuels but that does seem to fit. George W. Bush in a rare moment of honesty and clarity a decade ago talked of Americans being addicted oil, but that probably applies to many places and is spreading as the growth of person autmobiles in the most populated nations rapidly increases.
Billions of Chinese and Indians may also eventually share this addiction.