


 Arguments


Global warming is increasing rainfall rates
Posted on 22 March 2017 by John Abraham
he world is warming because humans are emitting heat-trapping greenhouse gases. We know this for certain; the science on this question is settled. Humans emit greenhouse gases, those gases should warm the planet, and we know the planet is warming. All of those statements are settled science.
Okay so what? Well, we would like to know what the implications are. Should we do something about it or not? How should we respond? How fast will changes occur? What are the costs of action compared to inaction? These are all areas of active research.
Part of answering these questions requires knowing how weather will change as the Earth warms. One weather phenomenon that directly affects humans is the pattern, amount, and intensity of rainfall and the availability of water. Water is essential wherever humans live, for agriculture, drinking, industry, etc. Too little water and drought increases risk of wild fires and can debilitate societies. Too much water and flooding can occur, washing away infrastructure and lives.
It’s a well-known scientific principle that warmer air holds more water vapor. In fact, the amount of moisture that can be held in air grows very rapidly as temperatures increase. So, it’s expected that in general, air will get moister as the Earth warms – provided there is a moisture source. This may cause more intense rainfalls and snow events, which lead to increased risk of flooding.
But warmer air can also more quickly evaporate water from surfaces. This means that areas where it’s not precipitating dry out more quickly. In fact, it’s likely that some regions will experience both more drought and more flooding in the future (just not at the same time!). The dry spells are longer and with faster evaporation causing dryness in soils. But, when the rains fall, they come in heavy downpours potentially leading to more floods. The recent flooding in California – which followed a very intense and prolonged drought – provides a great example.
Okay so what have we observed? It turns out our expectations were correct. Observations reveal more intense rainfalls and flooding in some areas. But in other regions there’s more evaporation and drying with increased drought. Some areas experience both.
Some questions remain. When temperatures get too high, there’s no continued increase in intense rain events. In fact, heavy precipitation events decrease at the highest temperatures. There are some clear reasons for this but for brevity, regardless of where measurements are made on Earth, there appears to be an increase of precipitation with temperature up until a peak and thereafter, more warming coincides with decreased precipitation.
A new clever study by Dr. Guiling Wang from the University of Connecticut and her colleagues has looked into this and they’ve made a surprising discovery. Their work was just published in Nature Climate Change. They report that the peak temperature (the temperature where maximum precipitation occurs) is not fixed in space or time. It is increasing in a warming world.
The idea is shown in the sketch below. Details vary with location but, as the world warms, there is a shift from one curve to the next, from left to right. The result is a shift such that more intense precipitation occurs at higher temperatures in future, while the drop-off moves to even higher temperatures.
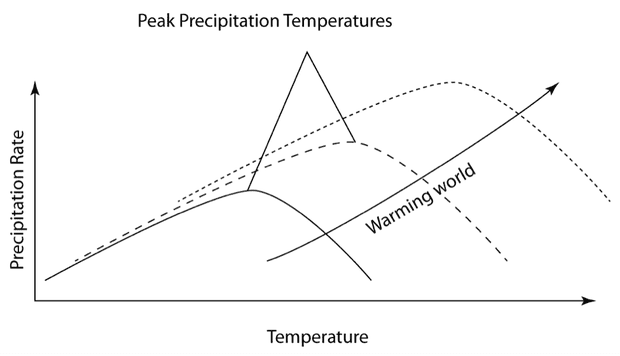
An idealized example of increasing precipitation curves as the world warms for the Midwest. Illustration: John Abraham
The authors also looked at how we characterize the temperature/precipitation relationship. Traditionally, we have related precipitation events to the local average temperature. However, it’s clear that there’s a strong relationship between the peak temperature and the precipitation rates. In fact, relations reveal that precipitation rates are increasing between 5 and 10% for every degree C increase. The expected rate of increase, just based on thermodynamics is 7%.
The authors find that in some parts of the globe, the relationship is even stronger. For instance, in the tropics, there’s more than a 10% increase in precipitation for a degree Celsius increase in temperature. This is not unexpected because precipitation releases latent heat, which can in turn invigorate storms.
From a practical standpoint, this helps us plan for climate change (it is already occurring) including planning resiliency. In the United States, there has been a marked increase in the most intense rainfall events across the country. This has resulted in more severe flooding throughout the country.
In my state, we have had four 1000-year floods since the year 2000! Two years ago, Minneapolis, Minnesota had such flooding that people were literally fishing in the streets as lakes and streams overflowed and fish escaped the banks. No joke, I actually observed fish swimming past me as I waded up a street. This occurrence is being observed elsewhere in my country and around the world.
It falls upon city planners and engineers to design infrastructure that is more able to accommodate heavy rains and manage water. This means designing river containment areas or flood plains, reinforcing buildings and houses, and increasing the capacity of storm drainage in urban areas, just to name a few. These modifications present costs but not preparing for increased flooding poses even greater financial and social costs. Moreover, storing water from times when there is too much for the inevitable times when we have too little (drought), results in better water management and multiple benefits.
This shows why climate science is so important. The US government is in the process of decimating our climate science infrastructure. The current US congress and our president have lost the battle of science – they have no reputable scientists to hide behind in their climate change denial. But, what they are doing instead is decapitating our ability to predict and plan for the future. By defunding organizations like NASA, the EPA, and NOAA, they are making us fly blind into a future.


Is the first letter of this article missing?
I'll call SkS readers' attention to a germane US National Academy of Sciences report, Attribution of Extreme Weather Events in the Context of Climate Change. You can order a printed copy for $71.10, but you can download the PDFs for free.
Peru is currently experiencing some record floods, in the sense of their intensity over very short periods, and are causing a lot of damage. The basic cause appears to be an unusual local el nino like phenomenon, that sometimes happens.
The high intensity would seem to be consistent with higher atmospheric moisture from a warming climate, possibly in combination with the local el nino generated weather phenomenon, which may or may not itself be influenced by global warming.
It also appears there's also a 50 / 50 chance of another full scale el nino later this year.
I agree with the concept of having a robust military, but I would have thought the USA spends ample already on it's military. It's hard to see how spending more will resolve the sorts of threats in the current global situation, and agreements with countries, and linkages by way of free trade would seem a better way of reducing tensions.
While countries owe a duty to their own citizens first, global connections would come a reasonably close second, I would have thought. Todays problems are global scale, and so require some degree of cooperation.
On a practical note. About two years ago I upgraded the rain guttering on our house so that it could handle about 3 or 4 times more water. Previously it was beginning to overflow when there was a heavy rainfall, the new guttering can now handle the climate change induced heavier downpours, at least for now! Trouble is, I am not sure the soak away and the ground will be able to handle the greater amounts of water in the future.
Not sure if new homes in the UK are designed to handle increased rainfall?! Developers/builders seem to be still using the standard sized guttering they have always used.
This makes intuitive sense. In an existaing world state if a region gets too hot then the precipitaion will likley occur somewhere else. If the world on average is getting warmer then this turning point will have to occur at a higher temperature for it to go somewhere else.
With more precipitation and with the precipitation more often occuring in strong downpours rather than gentle rain and with more of the precipitation falling as rain instead of feeding snow packs, our problem is to keep this water on the land, direct it underground and spread it timewise from times of rainfall (often the winter) to times of drought (usually the summer). We could create zillions of little concrete dams in all catchments but what a waste of money. Nature can do it for us.
https://www.youtube.com/watch?v=wI5AjJd00cM
http://mtkass.blogspot.co.nz/2011/05/erics-beavers.html
I remember reading a figure of only 1 to 3% increase in precipitation per degree C in average global temperature in Gavin Schmidt's book Climate Change: Picturing The Science. The guardian has written a much higher figure of "between 5 and 10% for every degree C increase".
Is this referring to in increase in average peak temperature or average temperature? Anyone have a source for this statement?
[PS] Fixed formatting. Use the tools in the editor for formatting and embedding link.
With apologies to the moderators, Wake in a post deleted for sloganeering, did refer to some data at the World Bank in an attempt to disprove the contention that precipitation levels are rising. Looking at the data in detail, it becomes obvious that it shows precisely the same decadal average for all data in a given nation, for every decade in which there is data. That is, according to the World Bank data, not only is their no trend, but there is no natural variability. Somalia, for instance, shows no evidence in their data of the 1980s drought in the Horn of Africa.
Needless to say, this complete uniformity in the data is very suspicious. If checked against local weather agencies, in this case Australia's Bureau of Meteorology, it is also shown to be false as regards decadal variability and overall trend. I do not know how it comes about that the World Bank is generating such spurious data, but while they do it is appropriate that a comment should be made on it (even if the original commentor here "has now recused himself").
It makes some sense that a warming world is relevant to precipitation changes, as is a warmer world.
Regionally, as we transition from winter to spring at mid latitudes there's reduced rainfall and increased evaporation, and the opposite is also true as we transition from summer to autumn.
A future world will be a warmer world with changed precipitation patterns, but as the global temperature begins to fall in response to falling CO2 levels in the atmosphere the additional accumulated vapor in the atmosphere will be slowly reassimilated into the oceans, lakes and glaciers.
Recently, one of our leading climate scientists in Australia was on television explaining that we can expect storms to be more severe due to the additional energy in the atmosphere.
Obviously this makes sense but it also made we think about how much extra energy there must be, and based on temperature alone the answer is about 0.3%, or about 0.5% with vapour feedback.
My question therfore is how does a 0.5% increase in energy result in a substantial increase in the severity of weather events?
Art Vandelay @10, my understanding is that the primary driver of the increased storm strength is the increased humidity. Storms cause precipitation results in the release of the energy stored as latent heat in the water vapour. That in turn drives the storm. Based on that, we would expect a 4% increase in the energy of storms per 1 C increase in temperature. That is very rough, however, as local humidity is driven by local temperatures rather than global temperatures, and there are other factors involved, some tending to make storms less energetic and/or less frequent.
Dear John Abraham:
This paper is specially interesting given the current disaster in my country (Peru). So far this rainy season was similar, if not worse, than the and 1982-1983 and 1997-1998 El Niño events.
There is a rare, localised warming along South America Coast (peaks of 5-10°C in the Peruvian Northern Coast), but weaker anomalies go all the way down to Chile and along the Southern Pacific Subtropics into the Australian Great Barrier Reef, were there is currently a severe bleaching event.
We call those events a "coastal El Niño", but I am unaware of the effects of the large "blob" of warmer water in the Pacific Subtropics. Perhaps this could be our (southern) version of the infamous "Blob" seen in Northern Pacific before the 2015-16 El Niño?
Perhaps you have a copy of the paper, where there could be any clues.
And what do you think of what is happening in the Pacific Ocean right now?