


 Arguments


Analysis: How could the Agung volcano in Bali affect global temperatures?
Posted on 28 November 2017 by Zeke Hausfather
This is a re-post from Carbon Brief. For more on this topic also see Global climate impacts of a potential volcanic eruption of Mount Agung by Flavio Lehner and John Fasullo
While human activity has been the dominant driver of climate change over the past century, natural factors can influence short-term variations in global temperature.
Major volcanic eruptions, in particular, can have a sizable cooling impact on the climate lasting for five years or so.
The Mount Agung volcano in Bali, Indonesia, has been showing signs that an eruption is likely to occur this year. Last time Agung erupted, back in 1963, it had a noticeable cooling effect on the Earth’s climate.
Here, Carbon Brief examines how volcanoes influence the climate, and suggests that a new Agung eruption would likely only result in a modest and temporary cooling of global temperatures.
Volcanoes and climate change
Volcanoes generally have a cooling influence on the Earth’s surface.
Eruptions send a cloud of ash and dust high into the atmosphere. The sulphur dioxidereleased combines with water to form sulfuric acid aerosols, which reflect incoming sunlight and influence cloud formation. When eruptions are powerful enough to reach the stratosphere (18 km or more above the surface at the equator), these sulphate aerosols can stay aloft for a number of years and have a strong cooling effect on the climate.
Volcanic eruptions also release CO2 into the atmosphere, meaning they contribute to warming by strengthening the greenhouse effect. But this influence is very small, and is outweighed by the cooling impact of the dust and ash.
The location of volcanoes also matter. Major volcanic eruptions near the equator are more likely to have a big effect on global temperatures, while high-latitude eruptions (like Laki) will have their effects more limited to the one hemisphere. Sulphate aerosols from high-latitude volcanoes generally will not cross the equator, while tropical volcanoes tend to cool both hemispheres.
The figure below shows an example of what might happen if the Agung erupted today.
The black dots represent the actual measured temperatures (from Berkeley Earth), while the grey shaded areas show the three major volcanic eruptions since 1960 (Agung, El Chichon, and Pinatubo). The red line shows Carbon Brief’s estimate of the warming that can be attributed to the combination of greenhouse gases, volcanoes, and changes in solar output, and blue dip after 2016 shows what could happen to global temperatures if the expected Agung eruption is of the same magnitude as the one that occurred in 1963.
Global mean surface temperatures from Berkeley Earth (black dots), major volcanoes (shaded areas), and estimated temperatures based on human and natural radiative forcing (red) with a 1963-size Agung eruption in mid-2017 (blue). The baseline period is 1961-90. See methods at end of article for details. Chart by Carbon Brief using Highcharts.
This projection, which is based on the historical relationship between volcanic eruptions and temperature, suggests that an Agung eruption would reduce global temperatures between 0.1C to 0.2C in period from 2018 to 2020, with temperatures mostly recovering back to where they otherwise would be by 2023.
There is no guarantee that an eruption of Agung today would be the same size as the one in 1963, however. A small volcanic eruption that doesn’t reach the stratosphere would have a relatively minor climate impact, as sulphur dioxide from the volcano would quickly fall out of the atmosphere.
On the flip side, we have records of much larger volcanic eruptions, such as Tambora in 1815 that may have cooled the globe by 0.6C or more and led to the “year without a summer”. Even in large eruptions this cooling only lasts a few years, however, as once sulphate aerosols eventually fall back to earth the climate quickly returns to normal.
How much will temperatures actually change?
The change in temperatures after the eruption is hard to predict precisely, partly because we don’t yet know what impact the El Niño-Southern Oscillation (ENSO) will have on the climate over the coming decade.
While a response of around 0.2C is expected in neutral ENSO conditions, if the eruption happens to overlap a sizable warm El Niño event or a large cool La Niña event, the impact could be quite different.
To determine exactly how ENSO and volcanoes could interact, researchers at the US National Center for Atmospheric Research (NCAR) have undertaken an analysis using the Community Earth System Model (CESM) Large Ensemble (LE). The CESM LE is a set of 40 different simulations of the same advanced climate model, with only very small differences in initial conditions. The long-term changes are the same in all the model runs, but emergent short-term variability – such as ENSO – differs for each.
The NCAR researchers used the CESM LE to look at the average temperature effect recent major volcanic eruptions: Agung in 1963, El Chichon in 1982, and Pinatubo in 1991, which you can see in black line the left-hand chart below. They found 58 model runs where El Niño conditions were neutral after the eruption. They also identified 32 cases where an El Niño followed the eruption (red line), and 30 cases where a La Niñ followed the eruption (blue line).
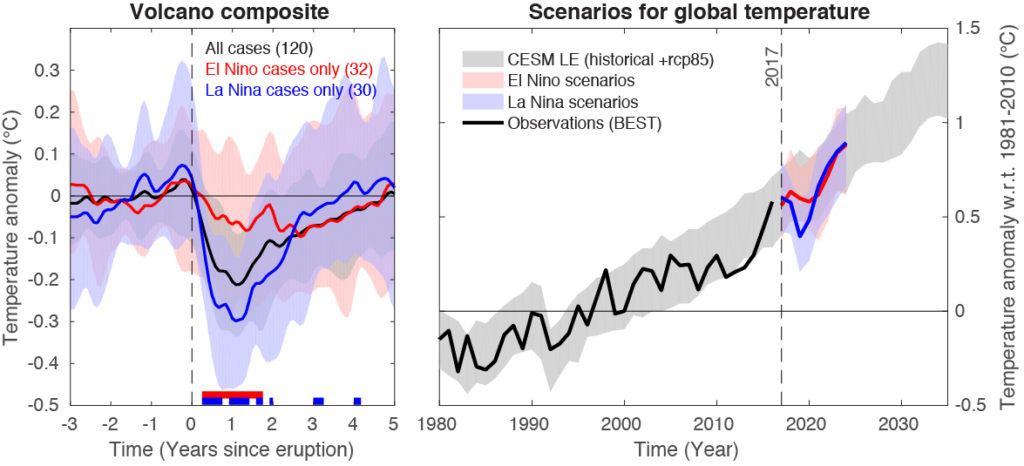
Mean temperature response in the CESM LE after Agung, El Chichon, and Pinatubo eruptions by ENSO condition (left). Estimated impact of a 2017 Agung eruption (of the same magnitude as the prior eruption) by ENSO condition (right), along with observations from Berkeley Earth. Figure from Lehner and Fasullo.
When eruptions occurred, the average cooling was about 0.2C, with most of the effect dissipating over five years as sulphate aerosols fell out of the stratosphere. When volcanoes were followed by an El Niño event in the models, however, the average cooling was only around 0.1C or less, while volcanoes followed by La Niña events saw an average cooling of 0.3C or more.
Projections of temperature change from an Agung eruption of a similar magnitude to the one in 1963 coinciding with either an El Niño (red) or La Niña (blue) are shown in the right panel. If the eruption coincides with an El Niño event, there may be little to no detectable cooling depending on the size of the eruption. However, if the eruption coincides with a La Niña event, we could witness substantial cooling based on the combination of the two.
Barring an eruption of the magnitude not seen for over 200 years, however, the total effect on the Earth’s temperature will be relatively small compared to the warming experienced over the past century.
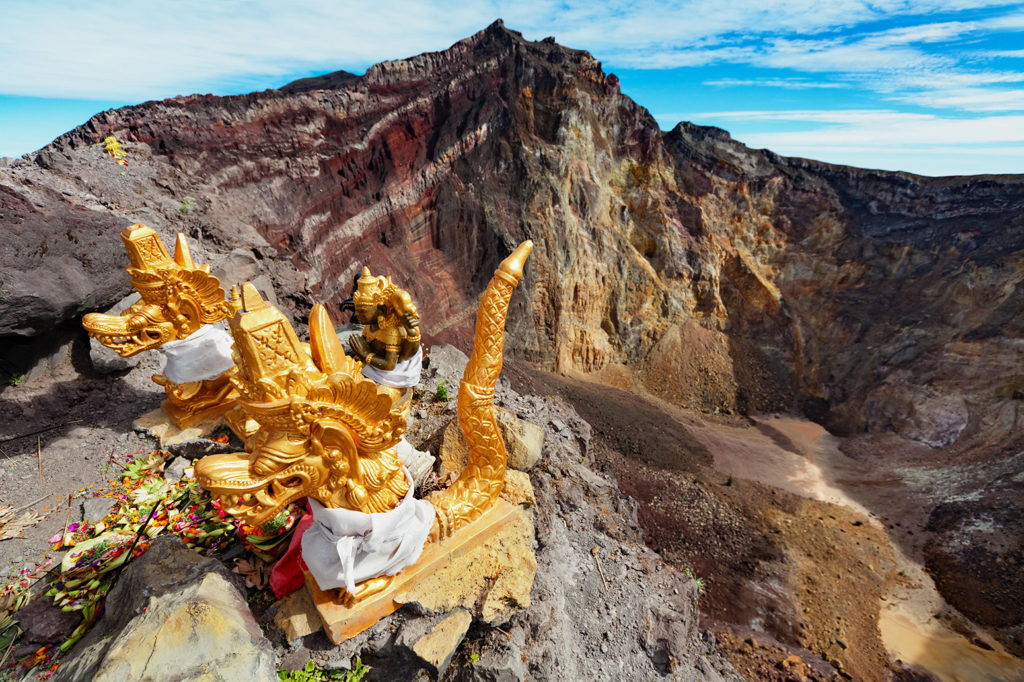
Shrine on the brink of the crater of Mount Agung, an active volcano, with traditional offering for spirits protecting against eruption, 02/08/2012 Credit: Denis Moskvinov/Alamy Stock Photo.
An Agung eruption similar to 1963 would only reduce temperatures for 2018 down to 2014 levels, all things being equal. It might postpone the date when a new record is set for the warmest year in recorded history, but it will not affect long-term warming driven by increasing atmospheric greenhouse gas concentrations.
Methodological note
A variant of Otto et al. (2015) method was used to estimate the efficacy of human and natural radiative forcing on global average surface temperature using a multivariate regression model. The regression model fit observed surface temperatures using both total anthropogenic forcings (greenhouse gases + aerosols) and natural forcings (volcanoes + solar). Thermal response times were adjusted for volcanic forcings to allow a more immediate impact of aerosol cooling.
Forcings were fit to a variant of the Berkeley Earth surface temperature record that had ENSO removed (as per the Foster & Rahmstorf (2011) method). Removing ENSO from the record before fitting forcings is necessary to accurately assess the magnitude of temperature response to volcanic forcing due to the overlap of volcanoes with ENSO events.
An Agung eruption scenario was created by assuming that the volcanic aerosol radiative forcings of the 1963-1966 occur from 2017-2020. Radiative forcing data was obtained from Meinshausen et al. (2011), with data available here.


The article quite convincingly describes the effect of volcano eruptions on the temperature of the atmosphere. However, some provisions seem disputable.
«The sulfur dioxide released combines with water to form sulfuric acid aerosols”. Sulfur dioxide can be converted to sulfuric acid in the presence of water and hydroxyl radicals catalyzing oxidation. Obviously, in the stratosphere, at temperatures much lower than the freezing point of water, sulfuric acid will not form. Apparently, in these conditions, sulfur dioxide itself (the boiling point -10 ° C) is liquefied and forms an aerosol. Subsequently, under the influence of gravity, it descends into the troposphere, where it interacts with water and is partially oxidized to sulfuric acid, and partially remains in the form of sulfurous acid (H2SO3). And, of course, “sulfuric acid aerosols” are not “sulfate aerosols”.
Influence of emitted CO2 as a greenhouse gas is very small. Naturally, the release of CO2 at the volcanic eruption is insignificant in comparison with the global technogenic emission. However, a local increase in concentration can be significant. It should be noted that along with CO2, water vapor and sulfur dioxide which also absorb IR-radiation fall into the atmosphere.
The first graph from Berkeley Earth seems illogical. The trend line has a relatively constant positive slope when there is no volcanic action, which is reasonable, all other forcings staying constant. When volcanic action does occur the slope changes (swings negative) which is also reasonable. But why does the trend line completely recover after the volcanic action is over, as if the volcanic action never occurred? Would not have the lower energy input into the earth's air, water, and land during the volcanic action caused a permananet "reset" in the trend line, still perhaps continuing on about the same positive slope, but at a lower starting point? I realize I am analyzing in a very basic and simplistic manner, but what am I missing?
Dwain - Note the observed global temperature response to the large volcanic eruptions of the late 20th century provided in the first image. Why would you expect a future eruption to behave any differently?
Good question, Dwain. During the temporary reduction in solar forcing due to its offset by reflective aerosols, greenhouse gases continue to accumulate. So those GHG forcings are on their original trajectories.
DwainS @2 , possibly the explanation you seek is involving the bigger picture of global warming. With 90+% of planetary heat gain going into the ocean (including deeper levels), then the thermal mass/inertia of the ocean provides a "smoothing effect" on the temperature fluctuations of the thin surface layer (the boundary layer of the atmosphere, plus a half-metre of soil/rock, plus a few metres of ocean surface).
In other words, the planetary surface temperature that you see recorded over the past half-century, is the result of the aggregating effect of ocean thermal mass — which includes the brief "negative heating" periods of Pinatubo, El Chichon, and other major eruptions. And so you would expect the graph line [representing planetary surface temperature] to appear to bounce back onto the original upward trend line.
If we were without 99.9% of the ocean's depth, then logically you would be right — and we would observe (after each major eruption) a sawtooth ratchet-like rising graph line, with the surface temperature re-setting to a lower point each time (before climbing rather steeply . . . until the next big eruption knocks things down a peg, once again).
In reality, all we are seeing is the smoothing interaction between the greater mass of the ocean, and the fast-responding thin surface layer (the thin layer we experience and record as planetary surface temperature — and which shows the visually-impressive "dips" with each eruption).
Thanks for yor explantions.
Rob-3, I agree that we should expect a future eruption to create the same effects as past ones, so I should have clarifed in my question why any eruption would not have reset the trend line. But your answer and logic is spot on.
Tom-4, I agree that the CO2 forcing would continue to accumulate during the eruption event, but I don't see how by itself it would necessarily generate a catch-up action that would put temperatures back on the same trajectory as before. I'll have to think about that some more.
Eclectic -5, I agree that the oceans would have a strong smoothing effect. I just didn't think it would be that profound, but in giving it more thought that has to be it. I suppose that idea supports the arguement that global air tempertures would continue to rise for some period even if all positive forcings were to stop.
Thanks again for your answers.
Tom-4, I have thought about it some more, and since CO2 would always drive tempertures back to an equilibrium state, perhaps that is the most straight forward explanation. Ocean thermal inertia would also be part of it in the big picture. I'll keep thinking...
Dwain: CO2 increases persist for a really, really, really long time. So an increase of CO2 during a short period of decreased insolation (due to reflective volcanic aerosols) still is trapping an increased amount of energy during and long after those aerosols have fallen out. In contrast, a pause in the increase of CO2 would have the sort of effect you were thinking should happen.
DwainS , I fear I expressed myself poorly. As you are doubtless aware, the nett global warming effect [currently two-point-something watts per squ.m, worldwide ] can only produce a slow rise rate in surface temperature, owing to the "braking effect" caused by the large thermal inertia of the ocean. ( If we had only an ultra-shallow ocean, then the rise rate would be quite steep. )
Two or three years after a major volcanic eruption, the planetary surface temperature "rebounds" to that slow rise rate [graph line], and appears to have returned to the original/pristine line of rise. You are right, in that the planet system has not received that two watts of input during the year (or three) — and so it must contain less heat energy than it would have had, without the eruption's interference. And the graph line must actually be running a notch lower than the pre-eruption line. But the large ocean mass means that the difference between the extrapolated graph line and the actual observed/measured line, is a difference which is too small to see.
Yet the brief/transient change in the "low-mass" shallow surface region, gives a spectacular but brief temperature dip during that year or so. Until pre-existing oceanic heat redistributes itself, and the shallow surface region (where we live) appears to have returned to its previous slowly-rising state . . . with obvious-to-everyone global warming & melting ice.