How does the Medieval Warm Period compare to current global temperatures?
What the science says...
Select a level... |
![]() |
![]() | |||
While the Medieval Warm Period saw unusually warm temperatures in some regions, globally the planet was cooler than current conditions. |
Climate Myth...
Medieval Warm Period was warmer
"For now, though, it is enough just to see the Medieval WARM Period shown to be global, and warmer than today." (Musings from the Chiefio)
One of the most often cited arguments of those skeptical of global warming is that the Medieval Warm Period (800-1400 AD) was as warm as or warmer than today. Using this as proof to say that we cannot be causing current warming is a faulty notion based upon rhetoric rather than science. So what are the holes in this line of thinking?
Firstly, evidence suggests that the Medieval Warm Period may have been warmer than today in many parts of the globe such as in the North Atlantic. This warming thereby allowed Vikings to travel further north than had been previously possible because of reductions in sea ice and land ice in the Arctic. However, evidence also suggests that some places were very much cooler than today including the tropical pacific. All in all, when the warm places are averaged out with the cool places, it becomes clear that the overall warmth was likely similar to early to mid 20th century warming.
Since that early century warming, temperatures have risen well-beyond those achieved during the Medieval Warm Period across most of the globe. The National Academy of Sciences Report on Climate Reconstructions in 2006 found it plausible that current temperatures are hotter than during the Medieval Warm Period. 
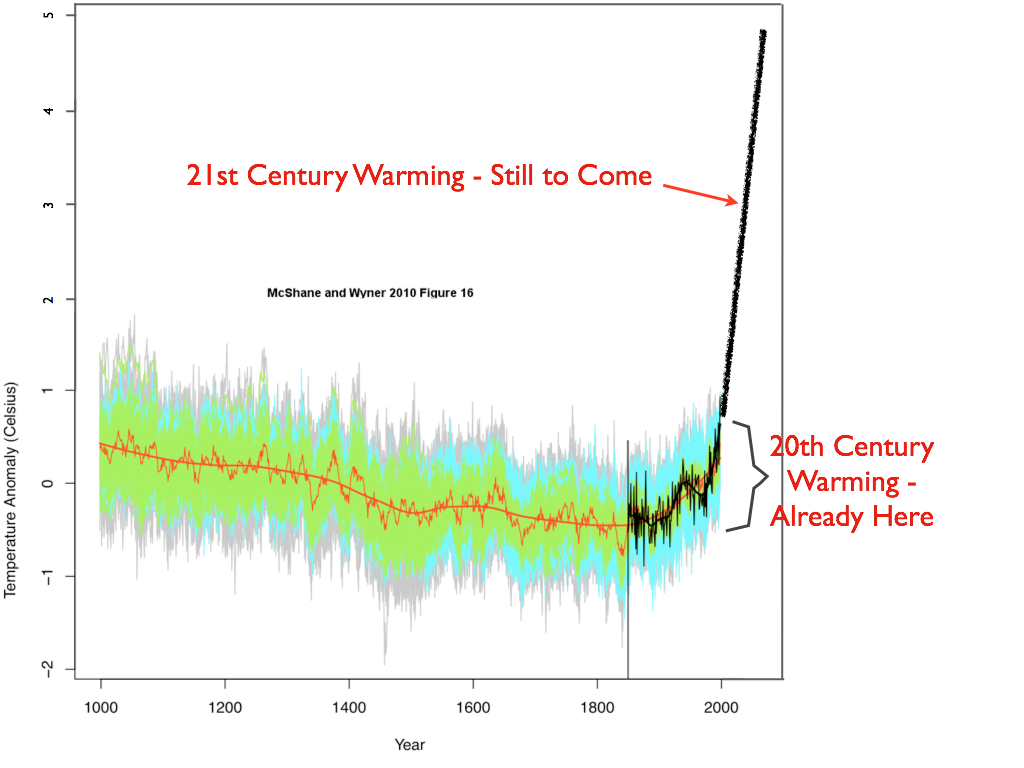
Further evidence obtained since 2006 suggests that even in the Northern Hemisphere where the Medieval Warm Period was the most visible, temperatures are now beyond those experienced during Medieval times (Figure 1). This was also confirmed by a major paper from 78 scientists representing 60 scientific institutions around the world in 2013.
Secondly, the Medieval Warm Period has known causes which explain both the scale of the warmth and the pattern. It has now become clear to scientists that the Medieval Warm Period occurred during a time which had higher than average solar radiation and less volcanic activity (both resulting in warming). New evidence is also suggesting that changes in ocean circulation patterns played a very important role in bringing warmer seawater into the North Atlantic. This explains much of the extraordinary warmth in that region. These causes of warming contrast significantly with today's warming, which we know cannot be caused by the same mechanisms.
Overall, our conclusions are:
a) Globally temperatures are warmer than they have been during the last 2,000 years, and
b) the causes of Medieval warming are not the same as those causing late 20th century warming.
Figure 1: Northern Hemisphere Temperature Reconstruction by Moberg et al. (2005) shown in blue, Instrumental Temperatures from NASA shown in Red.
Basic rebuttal written by dana1981
Update July 2015:
Here is a related lecture-video from Denial101x - Making Sense of Climate Science Denial
Last updated on 7 July 2015 by pattimer. View Archives
The argument is also logically invalid, even if the premise were true. Otherwise the following argument of the same form would be correct:
'The Black Death in the middle ages is estimated to have killed more of Europe's population than World War 2. This means that deaths during World War 2 were not unusual, and hence must be due to natural causes, not man-made'
They quote the paper "The Little Ice Age and Medieval Warm Period in the Sargasso Sea Lloyd D. Keigwin, Science, New Series, Vol. 274, No. 5292 (Nov. 29, 1996), pp. 1504-1508". I looked at it, and it seems that by using sediment cores he can give some evidence that at least locally, at the "Bermuda rise" in the Sargasso sea, the MWP was indeed 1 degree warmer. Of course that does not prove too much about global temperature, especially since there is a lot of evidence to the contrary which is not mentioned in the OISM advertisment.
What intrigues me is that Keigwin's paper is neither mentioned nor contested in the paper by Mann et al. which is the basis for the temperature map above. Is the Mann paper cherry picking and spitting out Keigwin's sediments at this point (which would seriously damage its credibility), or is there some good reason for dismissing Keigwin's results, and painting the Sargasso sea in cool colors on the world map of the year 1000? (There is also a map in fig 2 of the paper that makes it clear that sediment records from the Sargasso have not been used).
Or am I just missing something obvious here?
Jones & Mann 2004, and Crowley & Lowery 2000.
Jones, P. D., and M. E. Mann (2004), Climate over past millennia, Rev. Geophys., 42, is in about the only volume of Rev. Geophysics I can't access, maybe you could tell me why it is important?
http://www.sciencedaily.com/releases/2009/08/090827131832.htm
Looking at the temperature graph for the MWP, it shows that it wasn't 1 degree warmer. Infact it shows it's average. Which to me means that the graphs that relate to earlier times are not accurate at all. it doesn't make sense to me that just the northern hemisphere would be warmer than everywhere else. For that to happen it seems that the earth would have to tip over on it's axis pointing the northern hemiphere directly at the sun.
And I sure wouldn't give Mann much credibility due to his "hockeystick graph" as a global temperature, which no other scientist was able to reconstruct.
Needless to say, I don't have much faith in the science lately. There's too much money at stake for a bias not to be considered. Is there any science organizations that are not recieving government funds that have come to the conclusion that the warming of the planet is man-made?
As for the Northern Hemisphere being warmer than the Southern Hemisphere, have a look at this NASA GISS graph to see the difference between Northern and Southern Hemisphere temperatures in recent times. I'm not directly comparing between now and then but it shows that there is/can be a difference (without the Earth necessarily tipping over too much), particularly due to the amounts of land and sea surfaces.
KR has already given you the evidence for the extra reconstructions produced by others apart from Mann.
Finally, can you give any other more representative examples as to why you 'don't have much faith in science lately' ?
In the meantime, would you know whether the Geological Society of America (Climate Change statement) receives government funds ? If so, how much do they receive ?
You say it's based on ice core samples, tree rings, coral reefs, and other proxy measurements but how do those work to generate believable information? How can an ice core, for example, tell you the temperature of the earth a thousand years ago?
I hope you aren't pulling your hair out right now. It's basic but I get challenged all the time on this in conversations with bright, well-informed, educated people who don't believe in climate change because they don't believe the data.
It would be great to have a non-super-technical explanation of why scientists know we are experiencing something truly unique climate-wise; an explanation of the way you measure and why it's accurate. Thanks!
1/ Something is dependent on temperature in a known way
2/ Some way of dating the proxy.
Now ALL proxies have problems. A temperature reconstruction is no good without estimates of uncertainty which are large. Problems with both the temperature relationship and dating dog both. However, that does not mean they are no use. You can test theory to see whether the proxies match within the uncertainties
As to individual proxies - best to look up detail. Ice cores, tree rings, stalagmites etc. have excellent time resolution. The oxygen isotope ratio in ice is an excellent thermometer so ice core is probably best we have - but only tell the temperature of places that accumulate ice. Tree rings and stalagmites are more problematic. Sediments, corals etc add in a dating problem.
However, I wouldn't get carried away on paleoclimate - its skeptic fun park because of the uncertainty. AGW is founded in physics but tested against paleoclimate.
Normally this is not a problem. I can give you a broad brush treatment of how a parachute works, I can point to the success of parachutes. You could walk away from such a conversation w/a reasonable degree of confidence in parachutes based on a lossy description. But such a treatment is not durable against concerted resistance. Compared to climate research, I don't have to worry about a bunch of parachute skeptics insisting that parachutes don't work because you and I do not have understanding of their aerodynamic principles up to NASA-Ames standards.
The majority of people in this world are quite rightfully concerned with such mundane things as a roof over their heads, jobs that put food on the table, the health of their children or aging parents or just being frightfully occupied with the fight for survival itself.
And I do not blame them for those preoccupations. John specifically spells out the goals of this website here. Not to put words in his mouth (but since the vast majority of infrequent visitors never click on links provided), but this site exists as a repository for the truth about things climate. There exist so many active disinformation sites that exist solely to deceive the unwary and uneducated that there must exist some bastion of truth to fight against the darkness being imposed on science.
Those seeking the truth on various matters related to climate can come here, examine the evidence (pro and con), and make up their own mind. What they do with the information they take away is up to them.
Significant policy change would be nice, but is only achievable if enough sleepers awake to fight back and make a difference before it is too late to do so.
But, hey, a journey of 1,000 miles starts with but a single step, right?
The Yooper
1 - The map appears to have around 3500 Pixels. I can easily understand how it is possible to get accurate data for today, but I am unsure how anybody can seriously expect to produce a credible version using 'over 1000 tree-ring, ice core, coral, sediment and other assorted proxy records'. That would be enough to cover 1/3 of the map (assming the proxies were remotely accurate). Where did the other "data" come from ? (Please don't tell me it was extrapolated from the other points!)
2 - It is often argued that it is impossible to get funding for "skeptical" research. Who are "the powers that be" who decide which research is to be funded or not ? In the US I assume it primarily is 'big business' and in Europe, Government, is this correct ? How did a bias creep in ?
There is only research applying normal 'sceptical' analysis and review type science.
Funding is or isn't granted on the basis of dribs and drabs (very big dribs and drabs for multi purpose satellites) of funding allocated to projects on varous criteria.
If someone wants to write a paper, they're best off using commonly available data with good methods and
r.o.c.k. s.o.l.i.d maths, physics and stats. And then there's the language.
If you want scientists and science at large to take notice of your work, get the language right. Claiming that you've overturned the whole of physics of gases or the thermohaline circulation model is not the way to et a hearing. Use standard "we did this, then that. when we analysed the data, this is the result."
Dry as dust language backed up by impeccable observations and calculations is the only way. If the claims really are spectacular, save the hyperbole for the press release.
http://www.co2science.org/data/timemap/mwpmap.html
it appears to me that the MWP was worldwide a warm period and not limited to the northern part of the globe or am i missing something?
Welcome to Skeptical Science, wherein we debunk crap climate science, on both sides of the aisle. If you have an open mind and are here to learn (why else would you be here?), then Enter! This Door is always open.
In order for the MWP to be considered a global event, there would have to be global data showing that it's effects were felt simultaneously around the globe. Unfortunately, while some regions were warmer at some times, other areas were cooler. While those other areas were warmer, yet other areas were cooler. The best understanding at present is that of a multi-century period of regional variation.
We have a pretty good understanding (from multiple lines of converging evidence, independent of tree ring data) of forcings and feedbacks and the resulting overall temperatures going backwards in time into deep into the paleo record. So the MWP, the Roman Warming and the LIA are pretty well understood.
Here's a good discussion of the MWP.
The thing that differs today is the injection of the massive slug of CO2 long-sequestered from the carbon cycle back into it. And these effects are (and will be) truly global:
The Yooper
I am a bit familiar with the most common explanations about GW and as i scientist i am find the arguments in favor of an antropogenic gw effect more convincing than the against-arguments.
However, in a discussion about the MWT someone gave me the linkt i mentioned here. If those data are correct (and they appear to be so as they are collected from lots of different articles) the MWT seems to have been a global warm period. So, what I think that the explication can be :
- MWT was indeed a global warm time so there is something wrong with the graph you gave me
- The data sets given in that cited ref are almost 80 % situated in the northern hemisphere and so dominating the overal view (although even the points on the southpole display a warm period)
- the results are cherry picked to display a wrong image
- the results are not cherry picked but just (intentionally or not) wrong...
best regards
stefaan
Appreciate the response.
As a scientist, I'm sure you appreciate the value of peer-review in discerning the wheat from the chaff. As such, the purpose of the IPCC Working Group 1 is to establish the consensus of the available peer-reviewed literature in the field of climate science.
From the IPCC, an overview of the past 1,200 years:
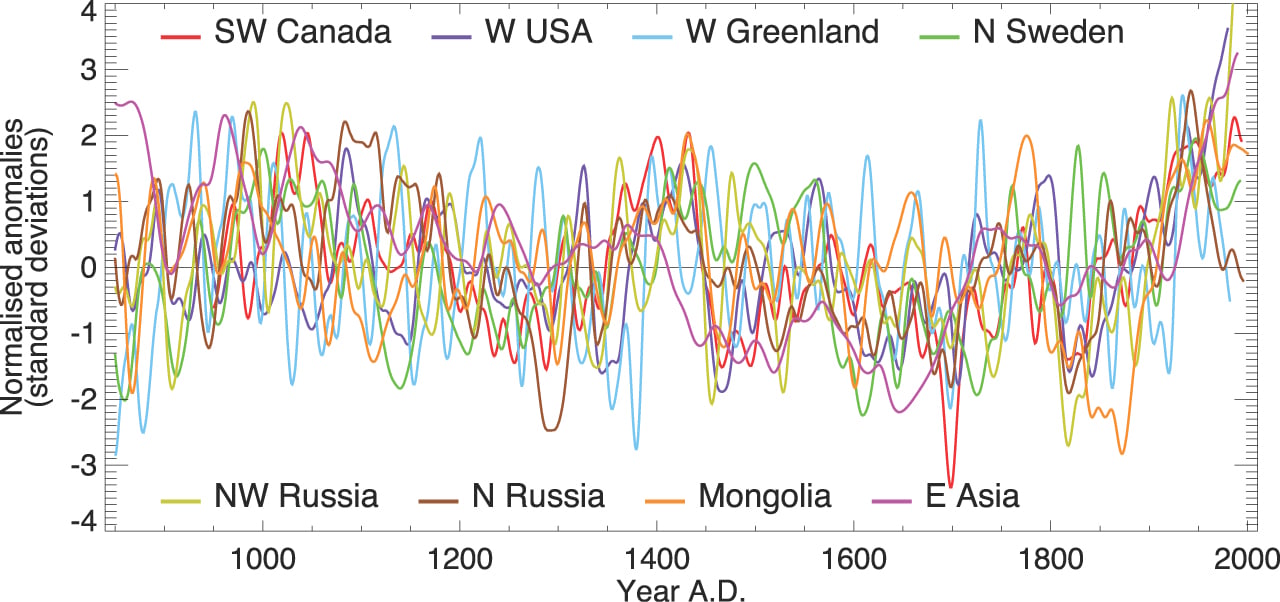
Examples of regional variability over that time period:
The IPCC's summary statement on the MWP: Source: IPCC WG1 Chapter 6.6 .
Weigh that against the CO2Science position statement on global warming, formulated in 1998.
As a scientist, I'm sure you also appreciate the need to first weigh all of the available evidence before formulating an explanation that best explains all of that evidence. And to revise that explanation as newer data becomes available over time.
The science says one thing about the human attribution of CO2 and its effects (known since the days of Tyndall and Fourier).
CO2Science says another.
What does your skeptical scientist mind say?
The Yooper
I think the theory about GW is rather solid.
In my opinion there are only 2 possible attitudes towards the effect of (extra) CO2
- it has little or no effect (this demands of course that you reject the idea of the natural greenhouse effect). Although even most "climate skeptics" reject this point of view, its often encountered in popular media. An argument which is often found in this discussion is that 'the moon is 60 K too hot' but its never accompanied by any proof
- or you recongnize the existence of the natural greenhouse effect and then its impossible for me to understand how people can think that doubling the amount of CO2 wont have (almost) no effect
Nevertheless its often difficult to sepparate the wheat from the chaff especially when i see rather well documented sites like the co2science site i gave earlier. I think they just gave the data that fit their story in this case.
best regards
stefaan
Hello again, sir!
I felt you were in agreement with the science end of it, but wanted to provide a framework of a response for the other readers to see. A logical evidenciary chain builds credibility. :)
As to: I believe you have the right of it. Not all have the ability to overcome cognitive bias and have the strength of mind to logically go where the data takes one, regardless of presuppositions.
The Yooper
Well if i have some time, i will look at the refs they give, cause a popular method is giving good refs but in a completely wrong way...
chairman : craig d. Idso
president : sherwood b. Idso
vice-president : Keith e Idso
a nice family business :)
Thanks; I'd known that, but didn't want to prejudice you in any way.
Makes one wonder, tho...
The Yooper
I don't know whether co2science had been selecting which bits of research to choose to include in their database or not but I know at least one instance where they misrepresented the results of the research. I'd felt for a while in their blog that they had been misrepresenting the results of published research, but I had no evidence so finally after I was pointed to another entry on the co2science website I decided to follow up and I read the original papers and contacted the lead author, I then wrote the results up on my own blog. You can read that here:
http://oxfordkevin.carbonclimate.org/?p=469
Basically the lead author stated that "Our figure does not lead one to conclude that past sea surface temperatures were warmer than today as is suggested on these websites"
My personal conclusion from this experience is that I cannot trust the work that they have done.
Kevin
Some time ago I went through as many of the co2science papers as I could bear. What I discovered was that:
1) Very many papers described a "medieval warm period", but differed from each other in actual dates by hundreds of years. Some would say 900, some, 1200, some 1400. Often there might be a period of some warmth for a few hundred years, but the period coming close to modern temperatures would be a peak covering a mere 20 span, and the peaks varied by hundreds of years from one study to the next.
So the site will quote papers as seeing the MWP from 900 to 1250, and exceeding current temperatures by 1.5˚C, any yet the actual period where temps were that high were a mere couple of decades, and never the same couple decades from one study to the next.
This would be the equivalent of taking the warmest annual temperatures from each country in the past three hundred years, and using each such maximum in concert to determine the temperature for the entire globe in that period. You couldn't even justify doing that in a single year, let alone ten, let alone hundreds.
2) I found several studies that were very selectively interpreted. For instance, one was based on a graph from a paper which showed warming in South American lake sediments. If you went to the paper, there were five other lakes in the study, all of which showed substantially cooler temperatures. They picked the one that showed extreme warmth and ignored the others.
In another study, it was clearly stated by the authors that they were not studying climate and that their results could not be taken to reflect the climate in the region. But that didn't stop CO2science.
In another case, the study only went back 500 years from the present (to 1500). That didn't stop them from including it in the MWP.
In many cases, there were very wide error bars on the temperature and/or period range, or both, but these were always interpreted kindly in favor of the preferred conclusion.
In other cases, the papers or graphics were so vague as to be worthless... they looked like they were scribbled on napkins. They either came from non-peer-reviewed articles and write ups (not studies), or else the subject of the study was not actual temperatures in the period in question, so any graphs included were worthless in that respect.
After too much time wasted, it became quite obvious to me that there was neither rigor nor honesty in the effort. If there were, it would be published as a comprehensive, meaningful study, such as Mann et al (2009) (which reached the opposite conclusion, by combining all available proxies and systematically determining that while there was regional warming, such warming was not global... but it did so out in the open, in a peer reviewed study, not on a web site with no rigor or honesty).
It says a lot, I think, when something is designed as a fun to use interactive map on a web site, yet can't make into the realm of peer reviewed science.
On the one hand SkS is saying the causes of the MWP are (largely) solar irradiance - the sun's output. On the other hand it is argued that the MWP may well have been a regional effect not global. How can these two arguments exist side by side? Greater solar irradiance would have an effect across the planet. In essence the intermediate answer to this Skeptic argument "To claim the Medieval Warm Period was warmer than today is to narrowly focus on a few regions... Globally, temperatures during the Medieval Period were less than today." negates the need for (and it could be argued unpicks) the basic argument
Was there a Medieval Warm Period?
There, you will find a link to :
Global Signatures and Dynamical Origins of the Little Ice Age and Medieval Climate Anomaly
There is also a link to the press release of the above paper, which may be worthing looking at before you look at the actual paper.
More reading, I'm afraid !
Abstract:
The Medieval Warm Period is an interval of purportedly warm climate during the early part of the past millennium. The duration, areal extent, and even existence of the Medieval Warm Period have been debated; in some areas the climate of this interval appears to have been affected more by changes in precipitation than in temperature. Here, we provide new evidence showing that several glaciers in western North America advanced during Medieval time and that some glaciers achieved extents similar to those at the peak of the Little Ice Age, many hundred years later. The advances cannot be reconciled with a climate similar to that of the twentieth century, which has been argued to be an analog, and likely were the result of increased winter precipitation due to prolonged La Niña-like conditions that, in turn, may be linked to elevated solar activity. Changes in solar output may initiate a response in the tropical Pacific that directly impacts the El Niño/Southern Oscillation and associated North Pacific teleconnections.
I keep hearing from the skeptic corner that the MWP isn't reflected by any of the IPCC's models and therefore the models are completely useless. Is there a page that examines this issue?
Today's warming is (relatively) much more globally uniform by comparison, and so there's much more of a signal in global mean temperature. Our best idea of climate forcings over these periods (solar/volcanic activity, then the recent CO2 spike) reflect these global patterns.
The overall pattern globally is one of relatively subdued changes over the MWP/LIA, then a large rise through the present, reflecting the forcings. Skeptics complain about the 'missing MWP' because they want it to be there, large and proud, in global temperature records. The evidence suggests that it's only large and proud in some parts of the world, some of the time, disappointing the skeptics... again.
Oh, and if that palaeo evidence were to be overturned and the MWP was globally really strong, what is the main implication? Very high climate sensitivity, not what skeptics want to hear!
[DB] In addition to using the omnipresent Search function in the upper left corner of every page here, one can also examine skeptic arguments by Taxonomy. However, much information is contained in blog post form here which may not be found in the rebuttals, so the search function is best overall.
For example, a search of the term "Medieval Warm Period" returns the following:
Search Results
Skeptic arguments matching the search 'Medieval Warm Period':
Blog posts matching the search 'Medieval Warm Period':
These same people will try to argue in the next breath/ paragraph/ thread that there's no problem with CO2 release because the climate has little or no sensitivity to forcing by GHGs. They fail to notice that an argument in favour of a global, higher-than-now temperature for the medieval period is also an argument in favour of (very) high sensitivity to any forcing.
You might not want to advance this point while you're still feeling your way through the science. But it's a handy reality check when you read such things.
Picking the warmest 10 years in the MWP would indeed be cherry picking, if someone used such evidence to claim that the MWP was warmer than now that would be bogus. However it would be a good way to show that current temperatures are warmer than the MWP, if it were the case even though you cherry pick the data that minimises the evidence in favour of the hypothesis.
Having said which, if you look at the magniture of the difference, I rather doubt cherry picking a ten year period in the MWP would make much of a difference anyway.
'They have not compared 300 years of AGW warming to the 300 years of the MWP'... obviously AGW hasn't been going on for 300 years and thus the data to perform such a comparison does not exist.
'They have not compared the 10 hottest years of AGW (thus far) to the 10 hottest years of the MWP'... proxy data resolution is not detailed enough to identify what the 10 hottest years (globally) of the MWP were with any confidence, let alone to generate a map of global variations for such a small time period.
In the realm of things which might be possible; A comparison of the last 50 years to ~1026-1075 would show less pronounced differences than the maps above, but the overall conclusion would be the same. A few small parts of the world were slightly warmer back then, but the vast majority of the globe is much warmer now.
« The observed patterns of change, even when averaged over multicentury intervals, are unlikely to be entirely forced in nature, as there is also a potentially important role for purely internal, natural variability. »
Reference to the unforced natural variability is unclear for me. I have often read that such an intrinsic variability cannot create any long term trend. This is a typical Tamino argument : energy is redistributed, not created, by (unforced) natural variability so you do not expect from it any decadal-to-century trend in surface temperature, just a season-to-year signal, up-and-down noise.
So, what are Mann et al alluding to when they mention such a « purely internal » variability which could explain part of the averaged multicentury pattern ?
The sentence you quoted comes from that discussion. Therefore the observed patterns are most likely the variations in spatial patterns of warming and cooling found in the models, rather than temporal variations in mean global temperature. It should be noted that changes in spatial patterns in temperature can make a small difference in TOA outgoing radiation, and hence there may also be some temporal variation in GMST, but it would be very small relative to the difference in temperature between MWP and LIA, ie, less than 0.06 degrees C (one quarter of the difference between MWP and LIA).
I find that a better way to understand it indeed. A while ago, I took a look at the litterature on the SHALDRIL cores, of which a chief researcher was Milliken.
He finds that "There is no compelling evidence for a Little Ice Age readvance in Maxwell Bay" and also asserts that "the current warming and associated glacial response in the northern Antarctic Peninsula appears to be unprecedented in its synchroneity and widespread impact."
So indeed LIA and MWP seem to have been more likely regional than global in nature.
However, there are non-quantitative proxies (like glacial advance or retreat) that help indicate whether a proxy is likely to valid for a large region.
The importance of paleoclimate is to constrain and test models. If the models are correctly reflecting real physics then estimated forcings acting at the time (which often have to be determined from another kind of proxy) should be compatiable with temperature proxies at the same time.