Climate Science Glossary

Term Lookup

Enter a term in the search box to find its definition.

Settings

Use the controls in the far right panel to increase or decrease the number of terms automatically displayed (or to completely turn that feature off).

Term Lookup

Settings


All IPCC definitions taken from Climate Change 2007: The Physical Science Basis. Working Group I Contribution to the Fourth Assessment Report of the Intergovernmental Panel on Climate Change, Annex I, Glossary, pp. 941-954. Cambridge University Press.

Home Arguments Software Resources Comments The Consensus Project Translations About Support

Bluesky Facebook LinkedIn Mastodon MeWe

Twitter YouTube RSS Posts RSS Comments Email Subscribe


Climate's changed before
It's the sun
It's not bad
There is no consensus
It's cooling
Models are unreliable
Temp record is unreliable
Animals and plants can adapt
It hasn't warmed since 1998
Antarctica is gaining ice
View All Arguments...


Username
Password
New? Register here
Forgot your password?

Latest Posts

Archives

Medieval project gone wrong

Posted on 30 April 2011 by Hoskibui

With regularity, you might hear skeptics mentioning a website called CO2 Science and its Medieval Project.  It is a front for a research center called Center for the Study of Carbon Dioxide and Global Change and their goal is to distribute:

…factual reports and sound commentary on new developments in the world-wide scientific quest to determine the climatic and biological consequences of the ongoing rise in the air's CO2 content.

The website is run by the Idso family (Craig, Sherwood, Keith and Julene).

Medieval Project

One of the Idsos' main projects collects temperature reconstructions of the Medieval Warm Period (MWP) that claim to show local warming and then posts them on their website with the Idsos’ interpretation. They conclude that current warming is not unprecedented since there were warm periods in the past in various geographic locations around the globe.

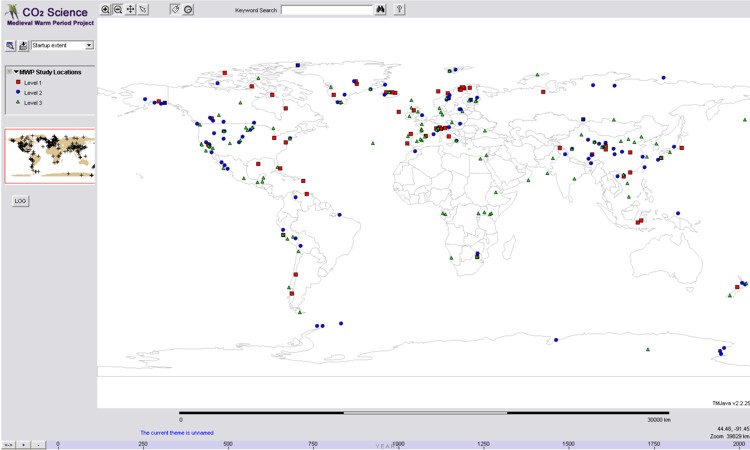
The site is flooded with lots of references, but do the references say the same thing as the Idsos? CO2 Science has a powerful interactive map and by clicking on the dots on the map you get to a page where a summary of that study is displayed - or rather the CO2 Science interpretation of the study.

Fig01-thumb_CO2_interactive.jpg
Figure 1: Interactive map from CO2 Science, part of the Medieval Project.

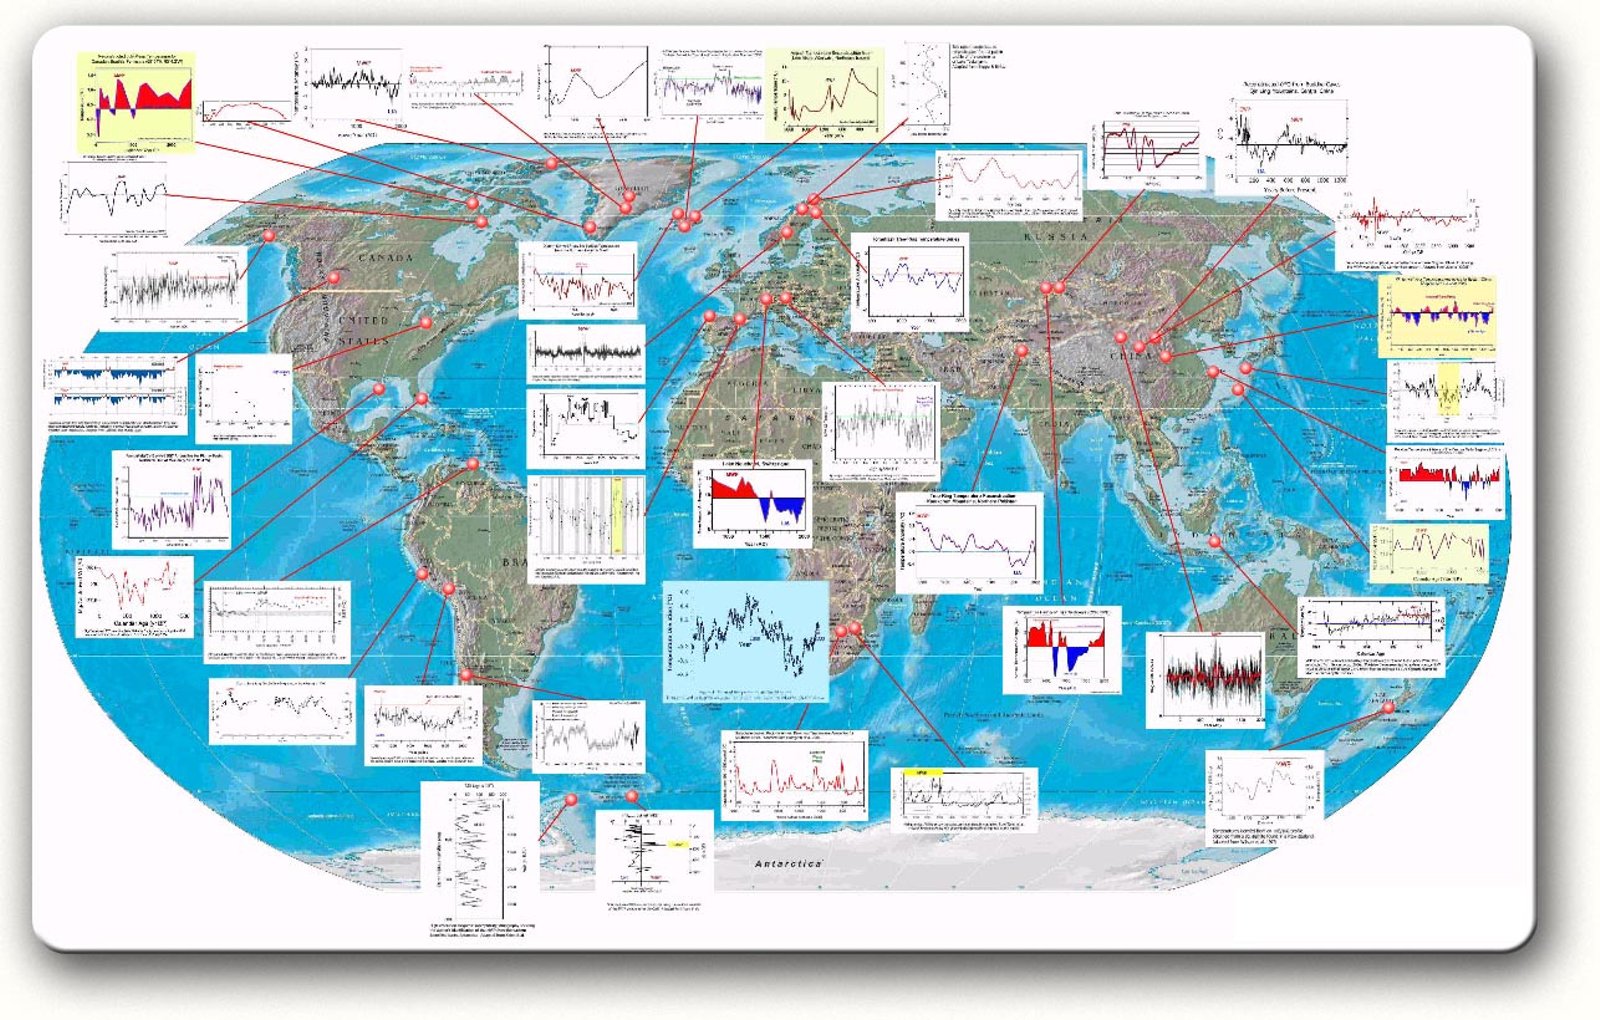
CO2 Science has also been a useful resource for other skeptics, see for example the Science Skeptical Blog * which has also available an i??nteractive map (pictured below):

Fig02-mwp_world_map_983979.jpg
Figure 2: Picture of an interactive map from Science Skeptical Blog. It refers to CO2 Science.
* Note: despite similarity in names, Science Skeptical Blog has nothing to do with Skeptical Science.

This interactive map is useful to view the alleged global warming during the MWP in graphical form. You can click on the images and see a temperature reconstruction (or other proxy, see below) of that location.  There you can also find sources for each graph, with abstracts.

Interaction for healthy skeptics?

For people with healthy skepticism these interactive maps are quite good. It is crucial that those maps are viewed with a critical mind. On Skeptical Science (as opposed to Science Skeptical Blog) we have looked before at common graphical tricks used to exaggerate the Medieval Warm Period, which include the following:

  • Hide the temperature scale and/or the temperature values
  • Pick one area or location of the world
  • Cut out or ignore recent warming

The total effect of those maps is what is most effective for the casual reader. All of the selected articles on the map show at some point a period that can be interpreted as "Medieval Warming".  The quotation mark is because in some cases the research is only about the period itself - but not the temperature. For example we can find graphs showing changes in precipitation, like, Zhang et al 2003 - astudy from Tibet, which states in its abstract (emphasis mine):

... We find that the annual growth rings mainly reflect variations in regional spring precipitation. The greatest change in spring precipitation during the last two millennia seems to occur in the second half of the 4th century. The North Atlantic MWP was accompanied by notable wet springs in the study region during AD 929–1031, with the peak occurring around AD 974. ...

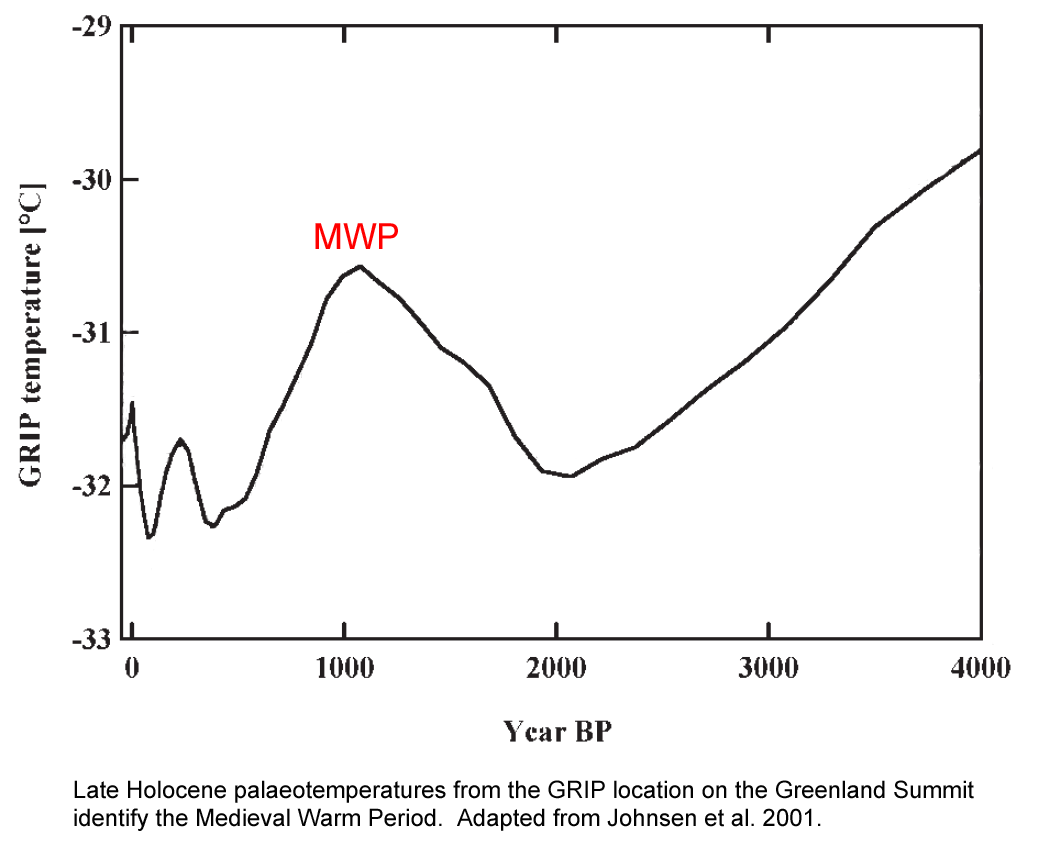
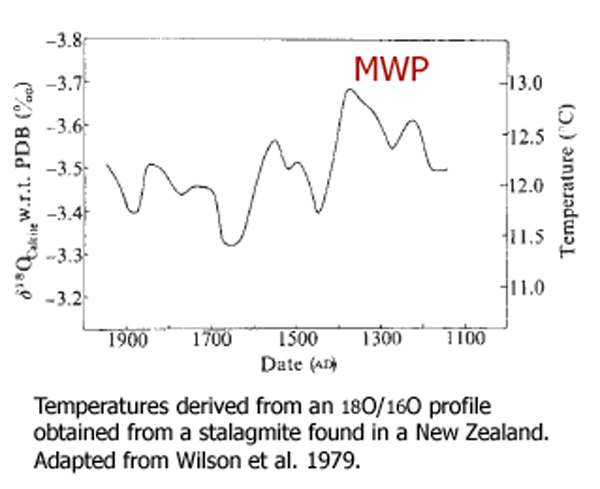
Few of the graphs in Figure 2 contain temperature data past the mid-20th Century, and thus do not reflect current temperatures; in addition the MWP is rather ill-defined. Usually the MWP is the period between 950-1250, but when you look at the graphs you see some inconsistency. In it you see a warm period during 800 AD, 1100 AD or even 1400 AD; that warming is - by their opinion - indication of a global warming during the MWP. For example if you take graphs from two separate locations you can see some difference. Here we have one graph with a proxy for temperature in Greenland (Johnsen et al 2001) and the other one for New Zealand (Wilson et al 1979):

Fig03-Johnsen-2001_2.gif
Figure 3:  The Medieval Warm Period in Greenland, according to Johnsen et al. 2001, was quite strong around 1000 AD.
Wilson-1979.gif
Figure 4:  The Medieval Warm Period in New Zealand, according to Wilson et al. 1979, was strongest between 1300 and 1400 AD.

Looking at those two graphs it is clear that the warming is not at the same time.

Another flaw is evident when looking at those graphs: the insistence on using old data. Many of the articles used has data that is old and outdated. It is difficult to imagine that there are no better and newer data on paleoclimate in New Zealand then a study of oxygen isotopes from the year 1979. There is also a tendancy to ignore corrected version of data. In the case of this map, they use for example Loehle 2007 instead of Loehle 2008 (See Kung-fu Climate).

CO2 Non-Science

On CO2 Science the problem is not just the way they pick the graphs, but how they change them and interpret them. As an example, there is research from the Alps ( Mangini et al 2005) which CO2 Science interpret in a strange way and conclude that the MWP was warmer than today. The CO2 Science summary of the study says:

… at three different points during the MWP their data indicate temperature spikes in excess of 1°C above present (1995-1998) temperatures of 1.8°C.

In contrast, it states in the abstract of the paper:

…maxima during the Medieval Warm Period between 800 and 1300 AD are in average about 1.7 °C higher than the minima in the Little Ice Age and similar to present-day values.

Another misinterpretation of data can be seen by looking at the sea temperature data from the Indian Ocean (Oppo et al 2009).

The CO2 Science interpretation reads:

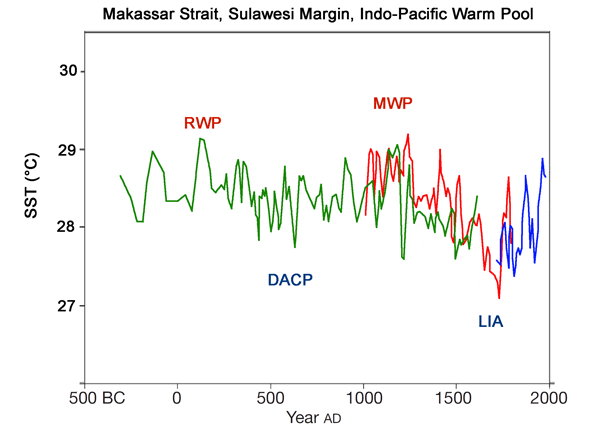
Reconstructed SSTs were, in their words, “warmest from AD 1000 to AD 1250 and during short periods of first millennium.” From the authors' Figure 2b, adapted below, we calculate that the Medieval Warm Period was about 0.4°C warmer than the Current Warm Period.

Then they change the image 2b from the article and make it look like the medieval warming was 0.4 ° C higher than the current warming:

Fig05-Oppo-2009-Co2-science.gif
Figure 5: Graph from CO2 Science - derived from the Oppo, et al. 2009, which is said to show that MWP was 0.4 ° C higher than now.

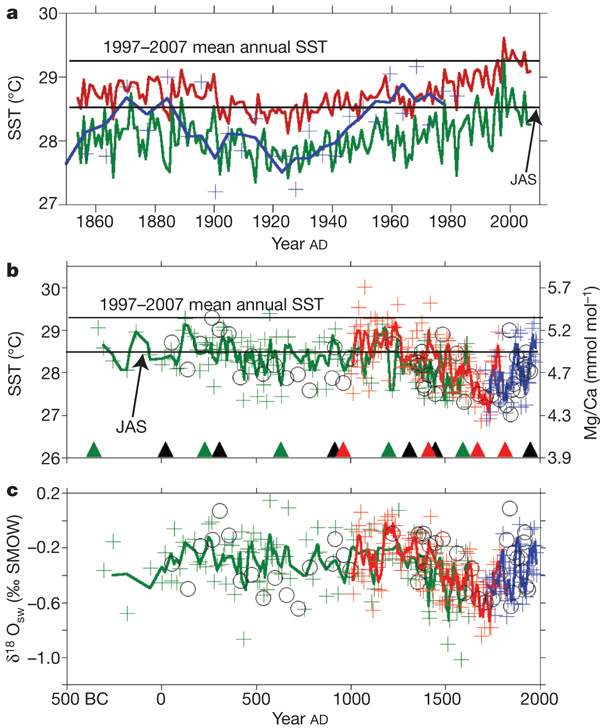
The original graph can be seen below (see graph b and the line representing the 1997-2007 mean annual SST):

Fig06-nature08233-f2_2
Figure 6: Graph from Oppo et al 2009.  Figure 2b in the center indicate that the current warming is greater than the Medieval Warm Period (graph from Nature).

As is evident from the 2b in figure 6 above, the mean annual SST for 1997-2007 was higher than the rest of the graph.

Conclusion

Both CO2 Science and its sister site Science Skeptical Blog use various methods or tricks to make the case for a global warm period during the medieval times. As can be seen with a critical look at the original papers and graphs, their conclusions don't hold water. In those pages we have a large collection of articles about paleoclimate, and we can't trust their conclusion or the graphs that we see because of many misrepresentations.

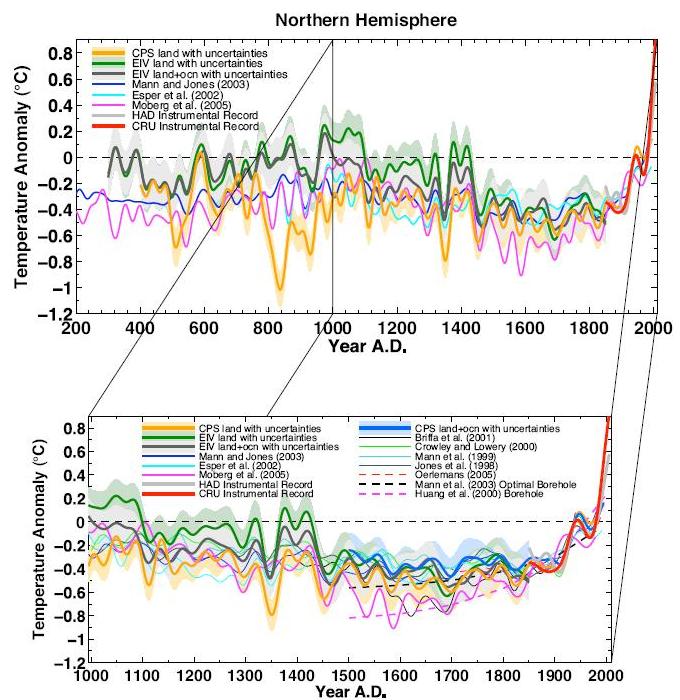
The story is half-told by pointing at a large set of data. Some scientists have actually used some of this data to make comparisons between current warming and the past (Mann et al 2008):

Fig09fig3
Figure 7: The new hockey stick (Mann et al. 2008). Temperature proxies for the last 1800 years. The red line shows direct measurements and various indirect measurements (ISPs) are in different colors.

Further reading

Other reviews of CO2 Science and its false interpretations can be found at Climate Shift, on Kevin Oxford and Climate Feedback

0 0

Printable Version  |  Link to this page

Comments

1  2  Next

Comments 1 to 50 out of 59:

  1. Howard Duff's marvellous little classic, "How to Lie with Statistics" also had a brilliant expose/exposition of these "common graphical tricks". I wish I could cut and paste them here, but mine is a paper copy, and I am no good with computer drawing:( But his illustration of the 'trick's is persuasive, memorable, and concise. It boggles the mind to think how timely his little book still is. The deceivers have not even had to bother to think up new techniques since the 50s when he wrote his book!
    0 0
  2. With regard to the Mangini paper do you think the CO2 Science people are taking their lead from this part of the paper? "We observe the lowest values in the section formed during the Little Ice Age (AD 1400–1850), and maximum values in the section corresponding to the MWP (approx. AD 800–1300). These latter values are even slightly higher than those of the top section of the stalagmite (1950 AD) and higher than the present-day temperature of 1.8oC." It just seems the CO2 Science people have quantified 'slightly'. Fig3 suggests they have done that correctly. Just as a side point when a scientist publishes that doesn't give them exclusive rights to describing the implications of their data. Falsehoods about the data is obviously unacceptable but reappraisal of conclusions and interpretations seems OK. I don't see how what the CO2 Science people did with the Mangini paper constitutes a 'trick'
    0 0
  3. HR:
    Just as a side point when a scientist publishes that doesn't give them exclusive rights to describing the implications of their data.
    Fair enough, but even if your interpretation is right, their point is that their data implies solar variation appears to be responsible during the MWP detected by their reconstruction. I'm sure HR read that part and understand it, so won't bother reproducing it here. We know from observations that this is not true today, so any suggestion that this study points to a low sensitivity to changes in atmospheric CO2 concentrations is just bull pucky.
    0 0
  4. I love CO2 Science and Science Skeptical. Those were the two sites that really sold me on how far the denial camp would go in misrepresenting facts. I got there shortly after I'd begun to realize that "skepticism" was all smoke and mirrors, all the time. The sites pretty firmly opened my eyes to the difference between science and snake-oil sales. I went through every citation on both sites at the time (looking directly at the real source study, whenever available) and was shocked at what I saw. My very favorite was when they quote Thomspon et al (2003). That paper presents a wide overview of ice cores around the globe... I count a dozen. Our skeptical friends picked the one graph of twelve (one of three from the SA Andes) that barely showed warming around 1100. No mention of the other 11 that directly contradict that single entry, even though two of them are in close physical proximity to theirs, demonstrating that not only wasn't their choice a good global proxy, but it wasn't even a very good local proxy. Other favorites included a paper whose data only went from about 1600 to the present, one hand drawn graph with no units of measure on either axis, one paper repeated twice, and a paper that explicitly said that its data should not be used in any way as a global or even regional temperature proxy. The single biggest flaw that recurred over and over was the fact that any warming peak in a 1,000 year span was labeled as MWP, even if it only appeared to last 50 years, and differed from other studies by hundreds and hundreds of years. Really, the effort was/is shockingly disingenuous.
    0 0
  5. Sphaerica wrote : "Really, the effort was/is shockingly disingenuous." Agreed, but to what end, I wonder ? What do the Idsos get out of all this ? Actually, the CO2Science Medieval Project's list of so-called proof of a MWP, reminds me of another little list that some have used to vainly try and 'prove' peer-reviewed skepticism of AGW Alarm...
    0 0
  6. Nicely done. There appears to be a grammatical issue with this sentence: "They conclude that current warming is not unprecedented since there was a lot of warming during in the past at various places."
    0 0
    Response:

    [dana1981] Thanks, I revised that sentence.  Hoskibui is from Iceland, I believe, so we tried to help him with the translation to English, but may have missed a few of these.  But he gets the point across!

  7. Thanks for the post, Hoskibui. I have already come across this website, and indeed many of the studies they cite as "proof of MWP" are either not about temperatures, or not about the same period. I did not spot that on top of that they misrepresented others as well. I'm pretty confident that if they put this all together in a comprehensive global climate reconstruction study, going through all the statistic and geographical distribution issues, they'd get pretty much the same results the other reconstructions show. I did not get the conclusion about Figure 6b, though: it does look like it shows higher temperatures at the MWP than today. What am I missing?
    0 0
  8. None of the graph links seem to work for me.
    0 0
    Moderator Response: [DB] Sorry, JMurphy; should be fixed now.
  9. Alexandre, You're missing the 1997-2007 mean annual line. See figure 6a. Note that the blue line ends around 1980 (this is hard to tell from figure 6b, which is on a much larger timescale), therefore missing the sharp recent warming and the recent decade average. This is one of the common visual ploys sites like co2science rely on. One might assume from figure 6b that the end of the line represents modern temperatures.
    0 0
  10. NewYorkJ #9 Oh, now see it. Thank you.
    0 0
  11. Oh dear - that site is a bad one. I thought I'd follow up a paper from a region whose research and climate I know well (Iceland, coincidentally), and looked up what they said about Sicre et al (2008). Of course the website suggested that the MWP was 1C warmer than the 'modern warm period' according to Sicre et al. An interesting conclusion to reach, given that the Sicre record is truncated at 1950AD and so does not show the 'modern warm period'... It really is classic misinformation, and well done Hoskibui for the debunk.
    0 0
  12. Soon & Baliunas(2003) used these deceptions, and one more. They compared MWP temperatures to the average temperature for the 20th century, rather than recent temperatures. Craig Idso and Sherwood Idso (of the CO2 Science website) were co-authors when Soon and Baliunas published (three months later) a longer version of this paper in E&E. See Wikipedia: Soon and Baliunas controversy
    0 0
  13. I have to join Sphaerica. The "skeptic" blogs are the one factor that seriously tipped me. I was not initially under the impression that there was significant scientific debate about GW. Then I ran across those sites, which at first glance suggested that there was. When I started reading, I could hardly believe my eyes. There have been only a few things that truly shocked me since I moved to the States. One was the Jerry Springer show (I still have a hard time to believe that there are people who actually watch this stuff). Another was the tandem Climate-Audit/WUWT and other so-called skeptic blogs. There was all the stuff that I learned about in high school, when we analyzed marketing, advertisement, mind manipulating methods, the Eastern block state run media, etc, etc. It was so blatant, I could hardly believe that anyone would fall for it. Yet, it is quite successful, even with people who should know better. For me, it removed any doubt as to where the sincere pursuit of understanding is to be found. Even if the fundamental tenets of climate science turn out to be wrong, it won't be because of anything discovered by these fools. They don't discover anything anyway, just spread lies and misinformation.
    0 0
  14. Well investigated Hoskibul. My only quibble is with the title. This isn't a "Medieval project gone wrong", but a "Medieval project gone right". Does anyone seriously believe you could cherry pick and misrepresent the data like this by accident? And it serves its purpose, to obfuscate, confuse, give deniers easy ammunition for use in threads and on talk back radio, delay and delay and delay. And it's all working beautifully.
    0 0
  15. So the obvious citizen science project would be to replicate the map but do all the graphs correctly.
    0 0
  16. Sphaerica and Philippe Chantreau Add me to your ranks as well. The utter nonsense that was put forward as fact and conspiratorial tone made it impossible for me to take them seriously. Much like the Jerry Springer show actually, which for non-americans was traditionally viewed while drunk.
    0 0
  17. 15, scaddenp, I actually started that project, but I had access to so few of the actual papers (unless I was ready to shell out hundreds of dollars in purchases and subscriptions, just to prove a point) that I abandoned it. It was kind of fun, seeing the whole thing really crumble. In the end, though, I think Mann 2010 pretty much did what needed to be done.
    0 0
  18. I have to agree about that map in figure 2. I gave up 40 mins of my life I'll never get back just tabulating and cross-matching the time periods for each graph/ area. The so-called MWP arising from this data only works if you allow 800 years (700 to 1500, more if you include all of the SH records), and overlook the fact that some areas show cooling smack in the middle of the range. And the NH and SH are out of synch by at least a century. Couldn't be bothered turning it into anything worthwhile. The whole idea that the graphic demonstrates anything at all is just rubbish.
    0 0
  19. Hi y'all, While I have not spent much time here lately owing to pressure of work and an increasing involvement in "Brave New Climate" the MWP title caught my eye. One of the things I liked was this quote from Zhang et al. (2003): QUOTE ... We find that the annual growth rings mainly reflect variations in regional spring precipitation........ UNQUOTE I think this implies that dendochronology is affected by more than a single variable. If the above quote is correct April showers can have a greater effect on tree growth than average temperature. Likewise, studies of climate issues in 16th century Mexico use tree rings to track rainfall rather than temperature. Can any of you learned gentlemen explain why Michael Mann uses dendochronology to track average temperature?
    0 0
    Moderator Response: [DB] Your answer is here.
  20. gallopingcamel @19, trees ,like everything else, need a lot of factors in their favour to grow well. They need sufficient water, sufficient sunlight, a lack of too many boring or grazing pests, nitrogen in the soil, healthy root fungi to take in soil nutrients, and of course, sufficient warmth. (The list is not exhaustive.) Also like everything else, the thing which limits the growth rate most is the thing in least supply. Trees in the tropics rarely lack sufficient warmth, but lack of water, or too many pests can be major problems. In contrast, trees on the edge of a tree line due to latitude or altitude certainly lack warmth. In fact, they are restricted to so short growing season by lack of warmth that if, on average over a decade or so, it was any shorter, they would not grow at all. Hence the tree line. So, the factor which most determines the growth rate (and hence tree ring width) of trees varies with location, and even from tree to tree. Even the difference between being on the North slope or South slope of a hill can make a difference, due to changes in incoming sunlight. Or the difference between being on the East or West slope, which can modify precipitation and wind strength. The important thing is that these factors can be judged by carefully examining the local geography, and by checking the trees for signs of scarring that results from pests, disease or excess grazing. By doing so you can check if the primary factor is water, or disease, or temperature. Paleoclimatologists choose the trees which are suitable for what they are trying to study.
    0 0
  21. Each tree ring shows early wood and late wood. The early wood is the one more dependent on spring prescipitation. Gallopingcamel, you could have found this in a few seconds on Google. http://en.wikipedia.org/wiki/Dendroclimatology
    0 0
  22. 19, gallopingcamel, To clarify things for people that don't bother to follow the links on dendroclimatology: 1) Scientists are well aware of the many factors that affect tree growth (and other proxies), allow for the errors that may be introduced, and take steps to reduce that error. 2) Tree rings are far from the only proxy used in any study. 3) All proxies are compared with other proxies and when possible actual observations to calibrate and validate them. 4) No proxy is perfect... all suffer from some issues... scientists are trying to infer temperatures from hundreds to thousands of years ago, so what would you expect? But when many different proxies agree, it becomes fairly compelling evidence.
    0 0
  23. 19 gc: For extra amusement, this issue is touched on, all be it in parsing, in Mr. Sinclair's latest video.
    0 0
  24. GP:
    I think this implies that dendochronology is affected by more than a single variable.
    To add to the piling on, if dendochronologists trying to do paleoclimate reconstructions weren't aware of this mind-numbingly obvious fact, they wouldn't put so much effort into finding areas where there are long sequences available that *aren't* mostly impacted by spring precipitation. In particular, this is why all the tree ring proxies that are used are near their altitudinal or latitudinal boundaries, as the major impact on growth in such areas are summer temperatures. The bristlecones used, for instance, are those that are stunted in growth due to there only being a few short weeks where temps are warm enough for them to put down much growth. Bristlecones at lower elevations in the Great Basin look like "real trees" and don't live nearly as long as those that most people are familiar with (from them being the "oldest trees on the planet"). Those stunted, long-growing trees get as much or more precipitation than those 1000 feet lower on the slopes. April showers aren't the limiting factor for them (snow showers, typically, I might add). Ain't it grand how GP gloms on to one sentence pulled out from a paper and assumes that shoots down an entire field of scientific endeavor, simply because he disagrees with the implications of the work being done?
    0 0
  25. I think you're pushing it Dhogaza. GP mentioned Mann, so it seems more toward that particular individual, who has gathered the irk of so-called skeptics, thanks to Steve McIntyre. It seem that McIntyre has somehow made things more personal with Mann than anybody else, as if he was the only one doing reconstructions. Then, in true Rush Limbaugh or Beck fashion, he has managed to instill anger agaiinst Mann's person among crowds who barely understand the subject. As to what McIntyre is ready to do to try to discredit Mann, this gives a notion. It is painfully obvious to anyone really paying attention that Mann is far more trustworthy than the charlatans (Trenberth' word) attacking his work and his person.
    0 0
  26. Hi, thank you all for your responses. I think that most questions have been dealt with - questions of dendrocronology and wether or not it works I think is irrelevent of this post - but by the way, with or without the dendrocronology the new hockey stick works (I can make a post about that if you want :) With the help of google translator and many good people of the Skeptical Science I think the point of the post comes a cross - thank you.
    0 0
  27. GP mentioned Mann, so it seems more toward that particular individual,
    Mann doesn't generate his own dendro proxy series. Yes, Mann's McI's favorite target, but Briffa (the leading paleo climatology dendro guy) isn't far behind. Hoskibui:
    wether or not it works I think is irrelevent of this post - but by the way, with or without the dendrocronology the new hockey stick works (I can make a post about that if you want :)
    True, letting GP derail the thread through a one sentence cherry pick of a quote from a single paper distracts from your post, and of course you're right that there are more hockey sticks than we know what to do with ...
    0 0
  28. Spaerica - much of the data should be in these places While Mann 2010 might indeed do the job, it isnt really a counter to CO2"science" PR. If you wanted to pursue, I could probably get all the papers.
    0 0
  29. 28, scaddenp, I don't know how much time I could commit, but I don't think it would take that long to go through things, so I'd give it a shot. If you leave a comment on my occassional-blog with your e-mail address, I can reply by e-mail, and we can set something up whereby I tell you which papers I can't get, and you can try to e-mail them to me.
    0 0
  30. Another failing of that site is that it often fails to recognise that the term "Before Present", in Paeloclimatatic Science, means "Before 1950". Hence they often, either wilfully or foolishly, make very flawed comparisons.
    0 0
  31. Great post Hoskibui, shouldn't it be added to the arguments? e.g "Disproves global MWP the recent warming?"
    0 0
  32. Mangini et al. 2007:Persistent influence of the North Atlantic hydrography on central European winter temperature during the last 9000 years (more through than their 2005 paper) finds solar variation to be the cause of European winter warm periods. More interestingly, they say that their isotope methods record mainly winter variation, while tree rings record mostly spring and summer when warming is less. Thus the best comparison with their results is with recent northern hemisphere winter temperature trends (where is the graph of that?). Arrhenius already predicted that winters would warm faster than summers, and this has generally been the case in the recent warm-up. However, NH winters are also sensitive to everything from the Madden-Julian Oscillation to tropical volcanoes, and we have seen in the last two years that some NH areas can have cold winters while Arctic amplification is concentrated farther north.
    0 0
  33. Are we saying there was no MWP? Comments on the papers below would be appreciated.
    “….the current warming trend over Tasmania is still a significant event when viewed in the context of multi-decadal variability covering the past 2000 years. In that period it remains the warmest event to a marginal degree, although a much longer warm period is indicated in the AD 900±1500 interval…..)
    But that is the 50 years low pass reconstructed temperature, the ‘temperature reconstruction' indicates many peaks exceeding modern warming. (fig 7) Warm-season temperatures since 1600 BC reconstructed from Tasmanian tree rings and their relationship to large-scale sea surface temperature anomalies E. R. Cook á B. M. Buckley á R. D. D'Arrigo M. J. Peterson Climate Dynamics (2000) 16:79-91 Likewise, Liu Y, et al. also see a relatively warm period from 950 to about 1100 with no extreme cool periods until about 1200 (fig 1 and fig 5). (Though not as warm as current temperatures in the region) The LIA is evident too. Amplitudes, rates, periodicities and causes of temperature variations in the past 2485 years and future trends over the central-eastern Tibetan Plateau LIU Yu, CAI QiuFang, SONG HuiMing, AN ZhiSheng & Hans W. LINDERHOLM Liu Y, et al. Chinese Sci Bull October (2011) Vol.56 No.28-29 )
    “….This record is the longest yet produced for New Zealand and shows clear evidence for persistent above-average temperatures within the interval commonly assigned to the MWP……”)
    Evidence for a ‘Medieval Warm Period’ in a 1,100 year tree-ring reconstruction of past austral summer temperatures in New Zealand Edward R. Cook Jonathan G. Palmer Rosanne D. D’Arrigo For the Northern hemisphere, Actual temperature records from UK dating back to about 900 AD, show the average temperature (in the UK) from about 1100 to 1250 AD was more than 0.5 C warmer than today. (Lamb 1965)
    0 0
    Moderator Response: [AMB] Fixed tag
  34. markx @33: 1) Your claim about Lamb (1965) is false. Egregiously false. The Central England Temperature series, which continues to be maintained by the Hadley Center dates back to 1659 for monthly data, and only to 1771 for daily data. Indeed, it would have been very hard for it to extend back further, given that thermometers where not invented until the 17th century. Therefore, the high temperatures shown by Lamb prior to 1659 are subjective reconstructions based on anecdotal evidence. What is more, the anecdotal evidence is biased, being based on European sources only, and hence reflecting changes in North Atlantic (and surrounding land) temperatures only, not global temperatures. What is more, even those subjectively reconstructed temperatures do not exceed modern temperatures for the region, as can be seen below. Lamb's 1982 reconstruction is shown in red. The Central England Temperature series is shown in blue: Despite these many errors, this myth keeps on getting pulled out of the denier hat. 2) Having dealt with the claim that is rife with factual errors, we turn to the others. There I simply note that you appear not to have read the main article. Two key points that you need to learn is that Tasmania (or any other region) is not the globe; and the MWP needs to be a defined time. The later is important because many MWPs from particular proxies occur at different times in different locations. If you make a reconstruction using a range of proxies, the different time periods of peak warmth in different locations results in a lower average temperature over the entire globe over the whole period. Every such reconstruction done has shown MWP warmth equivalent to about 1980-1980 20th century temperatures, and hence below current temperatures. Allowing for error margins, it is possible that the peak global warmth in the MWP was warmer than today. It is also inconsequential. Known physics shows that current temperatures will be at the very low end of the range over the next 500 years if we continue at Business As Usual. However, although the matter is not relevant, the current evidence more strongly favours a MWP cooler than 21st century temperatures to date. Indeed, one little considered piece of evidence that that is true is the refusal of denier scientists (such as those associated with CO2 science) to perform a proper temperature reconstruction. They know that the non-synchronous warming across the MWP will result in lower temperatures in any such reconstruction. So they stay well out of that game.
    0 0
  35. Markx... You're making the same mistake that many people make with the MWP. There are hundreds of papers on the MWP. There are better than 300 listed on that CO2Science website alone. MOST of those papers are research into local records of temperature. The MWP is a very loose term applied to any warm phase occurring anywhere between 700-1300 AD. The key word to remember in any discussion on this subject is "heterogenous." Even the Ed Cook paper you quote states clearly that the MWP is NOT homogenous. It does not occur everywhere at the same time. In many places the warming is early, ~700-900 AD. Other places it occurs late, around 1000-1300 AD. AND along with that you have places that are cooling when other places are warming. This is the reason the hockey stick turns into a hockey stick when you start putting all the data together. Those offsetting events cancel each other out. But what we are left with is a clear modern global trend that is significantly positive, per Tom's second graph of NH temp reconstructions. What I always note about the CO2Science group (Idso's et al) is that, even though they've pulled together all this data for the MWP, they've never bothered to try to use it to construct a multi-proxy chart of their own. Or they have and they didn't like the result.
    0 0
  36. I appreciate the replies. (and I did read the original article: I hope you will forgive me or even commend me for not immediately accepting all I read. Hence the questions). Good points re Lamb 1995, thanks. The CET is discussed in Judith Curry’s page (a very interesting read, if somewhat rambling - that perhaps a function of apparently being collected as snippets over many months) http://judithcurry.com/2011/12/01/the-long-slow-thaw/ Re the MWP: Increased solar radiation and less volcanic activity are hypothesised as a likely cause of the MWP, but what is the explanation for the variations in the timing of this warming? It does seem strange. It is still interesting to me that these warming occurrences apparently did happen also in the southern hemisphere.
    MWP sensu lato in New Zealand adds an important new datum to the debate concerning its large-scale occurrence and supports Broecker’s [2001] argument that it was indeed global.
    SE bars on both the Tasmanian and New Zealand data both indicate the possibility of many ‘as high’ or higher temperature peaks over that recent 1000 year period
    ….it is apparent that the current warming trend over Tasmania is still a significant event when viewed in the context of multi-decadal variability covering the past 2000 years. In that period it remains the warmest event to a marginal degree, although a much longer warm period is indicated in the AD 900±1500 interval. The early 1900s period likewise remains a significant cold event, …………. little indication for a ``Little Ice Age'' period of unusual cold in the post-1500 period. Rather, the AD 1500±1900 period is mainly characterized by reduced multi-decadal variability.
    Indeed, the Tibetan data too shows several possible “much higher than normal” temperature peaks in “their” MWP of about 700 to 1100 AD. And I’m sure at least some of these would have made it onto the ‘extreme weather’ stories of recent times! With all this media attention on alarming weather stories, you surely can scarcely be surprised if the first question is, “ Has this ever happened before?”.
    0 0
  37. markx @36, very briefly, you are still treating regional temperature proxies as though they where at least hemispheric proxies. Below is a reconstruction of the geographical distribution of MWP warmth: Orange on the map represents the global average increase in temperature from the 1960-1990 baseline to current temperatures. In the actual case, some areas of the globe have warmed more, and some less than that. It should also be noted that a three century mean is not strictly comparable to the decadal means we can compare current temperatures to. Never-the-less you can see that regional warmth is no indication of global or hemispheric warmth. In particular the unusual warmth of New Zealand and the Tibetan Plateau both show up on the map, but as isolated regions in otherwise cold areas. This map is not, of course, the end of the science on the MWP. But until the anthropogenic global warming skeptics start publishing reconstructions like this in the peer reviewed literature, their denial of the validity of these reconstructions rings hollow. The best currently available science shows the MWP was probably cooler than current temperatures. There are those who deny this, but they conspicuously are unwilling to produce any science to back up their denials.
    0 0
  38. Markx - "With all this media attention on alarming weather stories, you surely can scarcely be surprised if the first question is, “ Has this ever happened before?” You are confused. A warming Earth doesn't mean we will see only unprecedented weather events, but rather that they are likely to become much worse. You appear to be arguing a strawman. Note that any further comments in this vein should be made on one of the extreme weather threads. It is off-topic here.
    0 0
  39. Something interesting I just now noticed. If you compare that CO2Science interactive map with the IPCC MWP map that Tom just posted... it looks very much like the Idso's cherry picked their way around the large areas of cooler MWP. I haven't done a detailed look into it but it sure looks like the skip over most of the Baltic region and into Siberia. They skip that swath across central Africa. They skip western Canada and the north slope of Alaska. The IPCC map makes it look like there IS data for those regions that the Idso's are not showing.
    0 0
  40. Thanks Tom #37. I'm not quite sure what the map is showing? It is titled "Temperature Pattern for the Medieval Warm Period" but you state underneath "...represents the global average increase in temperature from the 1960-1990 baseline to current temperatures...." I gather this map/chart is a three century mean of the MWP 'time'? The rise is then compared with which period? Given the doubts on the data we do have for that period, is all this information really available? (Sorry for all the questions, and I made some assumptions to keep the questioning to one post). Thanks Rob #30. Nothing being argued at all. Just commenting on perhaps the very reason the main topic of the article is of such interest to many, and why it will probably become more so as more such reports come out.
    0 0
  41. markx, the answers to your questions and more information about the map can be found in the article it came from; MWP article
    0 0
  42. Thanks CB! #41. Makes perfect sense with the pair of maps (MWP and today compared with baseline temps of 1960-1990) and the difference is dramatic! Still wondering about the source (hence accuracy) of the MWP data (ie, Tropical Pacific? Central Asia?, North America? ), and still wondering what could cause such a 'roving' temperature aberration.
    0 0
  43. Ah, paleoclimate proxies. (I just read the comments on the MWP page). Should have realized that myself, pretty obvious - sorry!
    0 0
  44. markx, if you want more information, the original paper and supplementary material are available online. The essential point is that "a proxy data set comprising more than a thousand" proxies is used to determine temperatures at particular locations. The number of proxies reduces as you go back in time, with only 20 screened proxies in 900 AD. Knowledge of weather patterns associated with ENSO events, PDO, NAO etc is then used to project temperatures for regions without proxies from the data available in other areas. Such a method has significant uncertainties. Consequently the map is marked with various hatch marks to indicate whether or not the projections in particular areas pass one of two tests of statistical significance. In areas with cross hatches, the projection passes both tests. Areas with neither cross, left, or right hatch marks fail both tests of statistical significance and should be considered dubious. The supplementary material includes a map showing the location of all proxies used (fig S1). Also of interest is figure S9 which shows the pattern or warmth for the interval 900-1100 AD.
    0 0
  45. Thanks Tom #44, for the references. I see Mann has maps there (original paper on both MWP (MCA) and LIA) showing the position and types of the proxies – and I see the maps were derived from the models (6 climate simulations with the coupled atmosphere-ocean climate model GISS-ER (S12) Following a control run to establish stable initial conditions, six transient runs extending from 850 to 1900) I must say it worried me a bit that there are not a vast number of proxies for the MWA, and those (especially the few ice cores) seem to be in areas which did tend to show warming. But it is certainly beyond me to discuss such modelling and such a detailed paper any further. I note Mann did provide some explanation of the pattern in some more good maps in figure 3, (showing the difference between the MWP and the LIA For comparison with model simulation results, it is useful to eliminate the influence of the choice of modern reference period by examining the pattern of the MCA-LIA difference itself (Fig. 3). The MCA-LIA pattern highlights the extent to which the MCA is both more “La Niña–like ……(and)…. suggestive of the positive phase of the North Atlantic Oscillation (NAO) and closely related Arctic Oscillation (AO) sea-level pressure (SLP) ……
    0 0
  46. markx - the critical take-away is that MCA was different from what we see today. While many more proxy temperature records would be a big help, it seems LIA was truly global (though much less pronounced in SH) and resulted from global negative forcings. MCA is reproduced reasonably well in models from known forcings, (see CH6 of AR4) but while there were global forcings, there was obviously also strong regional factors at play as well.
    0 0
  47. I'm currently debating a Climate Change "skeptic" (denier would be the appropriate term). He has been using "data" from the CO2 Science web site. So naturally, I've looked at the graphs he links to at that site. [He dismisses SkS and will not read articles here.] My take has been that the CO2 Science misrepresents the data and research done by the actual researchers, such as Mann and Jones, Moberg, etc. I'm happy to learn, by coming to SkS, that I am not imagining things. Still, my skeptic acquaintance clearly will never change his mind about AGW. I'll read this article again; there a strategy for dealing with such people. This comment is no doubt OT. If so, move it.
    0 0
  48. koyaanisqatsi, feel free to tell the interlocutor that SkS, one and all (doubters included, no doubt), say, "put up or shut up." That person will be treated with respect as long as the claims are evidenced and the mind is open. Evidence-free rants will be discarded or be the subject of mirth (and then discarded). As for me, I'd love to hear solid evidence for either "it's not happening" or "it's not bad." It would be the best news I've had in 16 months. I'm not holding my breath, though. People keep saying that stuff and they never deliver.
    0 0
  49. As far as I can see CO2 science depends on people believing their representation of the science papers, secure in the knowledge that their audience will not actually read the papers. Get him to actually read the papers instead. However, as to changing the mind of someone desperately looking only for confirmation of a bias, then good luck. We are all guilty and the only good trick we have against the bias is science. You could ask what data would change his mind. If he can imagine no data that would do that, then dont waste your time.
    0 0
  50. koyaanisqatsi, you are quite correct that CO2science misrepresents the results of papers in their database. Apart from the OP, I can say this from personal experience, as there's a paper of mine in their database, conclusions suitably misrepresented. The paper documented an observed warming of climate, CO2science suggest that this immediately means the climate is 'returning to normal' so there's nothing to worry about!! The paper actually made no discussion of the forcings involved (climate needs a forcing to change), and climate's not a pendulum, desperate to stay in one place, that will swing the other way when nudged one way. I asked them to remove the paper from their database, you can guess the result of that...
    0 0

1  2  Next

You need to be logged in to post a comment. Login via the left margin or if you're new, register here.


The Consensus Project Website

THE ESCALATOR

(free to republish)


© Copyright 2024 John Cook
Home | Translations | About Us | Privacy | Contact Us