Climate Science Glossary

Term Lookup

Enter a term in the search box to find its definition.

Settings

Use the controls in the far right panel to increase or decrease the number of terms automatically displayed (or to completely turn that feature off).

Term Lookup

Settings


All IPCC definitions taken from Climate Change 2007: The Physical Science Basis. Working Group I Contribution to the Fourth Assessment Report of the Intergovernmental Panel on Climate Change, Annex I, Glossary, pp. 941-954. Cambridge University Press.

Home Arguments Software Resources Comments The Consensus Project Translations About Support

Bluesky Facebook LinkedIn Mastodon MeWe

Twitter YouTube RSS Posts RSS Comments Email Subscribe


Climate's changed before
It's the sun
It's not bad
There is no consensus
It's cooling
Models are unreliable
Temp record is unreliable
Animals and plants can adapt
It hasn't warmed since 1998
Antarctica is gaining ice
View All Arguments...


Username
Password
New? Register here
Forgot your password?

Latest Posts

Archives

What's Happening To Tuvalu Sea Level?

Posted on 26 November 2011 by Rob Painting

Because the coral atoll of Funafati, Tuvalu is densely populated and generally less than 3 metres above sea level, this small island nation in the Pacific is often the subject of intense media speculation about the impact of rising seas. The atoll is likely to begin to be overtopped by the sea sometime between mid to late 21st century, however Tuvaluans have often featured in the mainstream media claiming to be already experiencing the detrimental effects of sea level rise. Scientific studies to support these claims has been have been hard to find, but now a recently published study vindicates what many Tuvaluans have insisted all along - sea level has risen rapidly around Tuvalu.

Becker (2011) has examined sea level rise in the western tropical Pacific Ocean using a combination of tide gauges, satellite-based measurements, ocean modelling and GPS, and found that the region is experiencing sea level rise much larger than the global average. At Funafati Island, the study authors found that between 1950-2009 'total' sea level, which also accounts for the rate of island subsidence or sinking, rose at 5.1 (±0.7) mm per year, almost 3 times larger than the global average over the same period.  
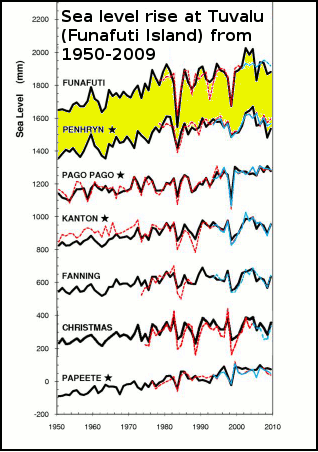
Figure 1- Sea level curves at tide gauge sites since 1950. Time series of reconstructed sea level (black), tide-gauge (red) and altimetry satellite in blue continue and in dash line (when tide gauge records were supplemented using altimetry data). From Becker (2011). Image cropped from original.

Sea level rise is not level

Of the many things about global warming misunderstood by the public at large, the irregular or lumpy distribution of sea level rise must surely be near the top of the list. When sea level rise is mentioned, this typically refers to the global average or mean, but this obscures the fact that not all areas of the ocean  are rising. In a few regions sea level is actually falling, while at others it is rising at a rate much larger than the global average. So even though the total volume of seawater from melting land ice, and thermal expansion from ocean warming are increasing, this isn't being evenly spread around the oceans. See figure 2 below.
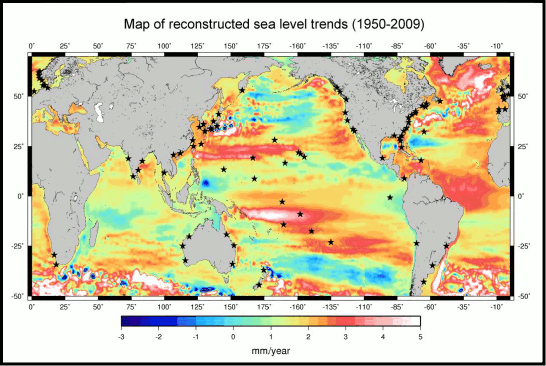
Figure 2 -Location map of the 91 tide gauges (stars) used in the global sea level reconstruction. The background map shows the sea level trends over 1950–2009 from DRAKKAR-based (an ocean model) reconstruction of sea level (uniform trend of 1.8 mm/yr included). From Becker (2011).

It just so happens that the western Pacific and Tuvalu in particular, are one such region where there is a large rise in sea level, much greater than the global average. See figure 3.
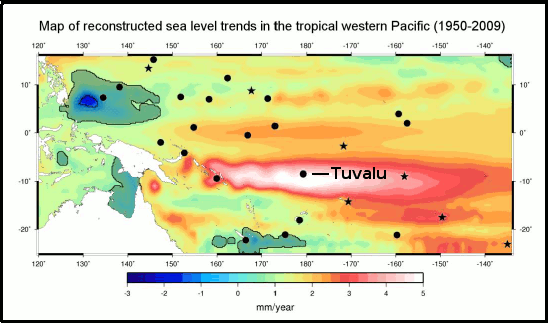
  

Figure 3 - Map of the Pacific Island region interannual sea level trend (linear variation with time) from the reconstruction 1950-2009. Locations of the 27 tide gauges (black circles and stars) used in the study are superimposed. Stars relate to the 7 tide gauges used in the global reconstruction. Dark areas relate to non-significant trends. From Becker (2011).

Mapping sea level rise in the western Pacific

Measuring ongoing sea global level rise, which results from the global warming-induced melting of land ice and thermal expansion, is a complicated business. This comparitively small long-term rise is often obscured because sea level can undergo large up-and-down fluctuations over seasonal, annual, and even decade-long time scales. This is especially true in the case of the islands of the western Pacific where the ENSO cycles El Niño and La Niña result in sea level fluctuations up to 20-30 cms, which is around 40-60 times larger than the long-term annual increase (5.1mm) found at Tuvalu. Quite obviously these fluctuations have to accounted for in order to see the underlying long-term trend.

Overcoming problematic data

The tide gauge and satellite altimetry data both have their own shortcomings, for example the tide gauges have long records, but some are plagued by data gaps, and monitoring equipment that has been updated over time. Also, tide gauges are fixed to the seafloor, which can either be sinking or rising dependant on the location (hence the use of co-located GPS equipment at some sites), so that has to be factored in to observations too. 

Satellite altimetry is a vast improvement over the tide gauge network in that it covers the entire oceans, and not just the coastal regions. It can therefore provide a more detailed picture of sea level variations from region to region. See figure 4.
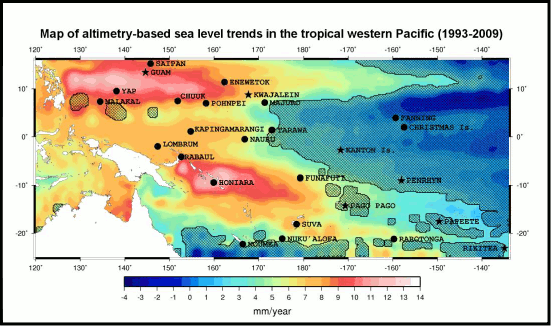
Figure 4 - Satellite altimtery-based sea level trend patterns in the tropical western Pacific over 1993-2009, on which are superimposed the 27 tide gauges used in the study. Stars correspond to the 7 tide gauges used in the global reconstruction. From Becker (2011)

But the downside of satellite observations is they have only been in operation for a short time. They do show a dramatic rise in sea level, in some areas in excess of 10mm per year (Honiara & Yap in figure 4), but the record only began in 1993, and 17 years (to 2009) is hardly long enough to tease out any decades-long natural variability that might exist. In other words, the rapid rate shown in the satellite data may not be indicative of the long-term rate of sea level rise in the region.

Global and regional sea level reconstruction

Becker (2011) set about reconstructing sea level over the period (1950-2009) by analysing the tide gauge, satellite altimetry, GPS data and use of an Ocean General Circulation Model. Combining a selection of 91 good quality tide gauge records (from 1950-2009) with gridded fields in the ocean circulation model they were able to unravel how sea level evolved in both time and space. To test how well their reconstruction matched observed sea level at a global scale, the authors removed a single tide gauge record from the reconstruction and compared the remaining reconstruction with that at the tide gauge site they removed. This exercise was repeated for each individual tide gauge. Finding good agreement, the authors then compared their reconstruction with the satellite altimetry over the period 1993-2009 in the western Pacific. See figure 5.
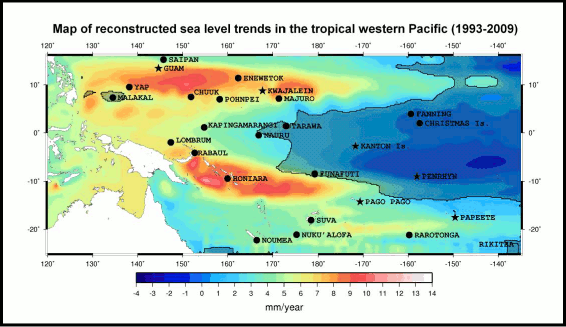
Figure 5 - Reconstructed sea level trend patterns in the tropical western Pacific from 1993-2009, on which are superimposed the 27 tide gauges used in the study. Stars correspond to the 7 tide gauges used in the global reconstruction. From Becker (2011).

As seen in figures 4 & 5, the reconstruction method does a good job of describing the actual change of sea level in the western Pacific, although the total amount of sea level rise in the reconstruction is smaller (at maximum & minimum) due to the statistical filtering method employed. See figure 1 for a comparison of the global reconstruction against the tide gauges for the western Pacific not used in the global reconstruction, and against the satellite altimetry.   

Tuvalu sea level rises with La Niña and falls with El Niño

As seen in the "Sea level fell in 2010" rebuttal, short-term global sea level can fluctuate due to the temporary exchange of water and snow between the land and sea, rising during El Niño when the land surface dries out, and falling with La Niña when the land surface recieves extra doses of rain and snow. In the western tropical Pacific, especially around Tuvalu, this trend is exactly the opposite, sea level there falls during El Niño and rises during La Niña. So what's going on?

This is largely due to the tilting of the thermocline in the tropical Pacific. See this animation for a great illustration of what this means. During La Niña strengthening of the easterly trade winds straddling the equator pushes warm water toward the western tropical Pacific. This warm water piles up in the western Pacific, which drives warmth down deep (the tilt of the thermocline), but it also causes the ocean to bulge upwards there due to the extra wind-driven water mass (see Timmerman [2010]Merrifield [2011] & Qiu & Chen [2011]). Both have the effect of raising sea levels, with the 'twin peaks' of sea level rise very obvious just north and south of the equator in figures 4 & 5 (the equator would be a horizontal line through Nauru).

During El Niño the trade winds weaken and the warm wind-driven water mass is no longer pushed toward Tuvalu and neighbouring islands. Instead the thermocline tilts back onto a more level plane, warm water begins to accumulate in the central Pacific, and accordingly sea level drops around Tuvalu.

The huge drop in sea level around Tuvalu, and nearby islands, shown in figure 1 around 1982-1983 is due to the strong El Niño during that time. Which goes to show not only how variable and sensitive to ENSO sea level in the western tropical Pacific is, but also how much variation there is even within the western Pacific itself. This ENSO/sea level relationship is shown in figure 6 below, however note that this graph accounts for the tropical western Pacific, not just Tuvalu.
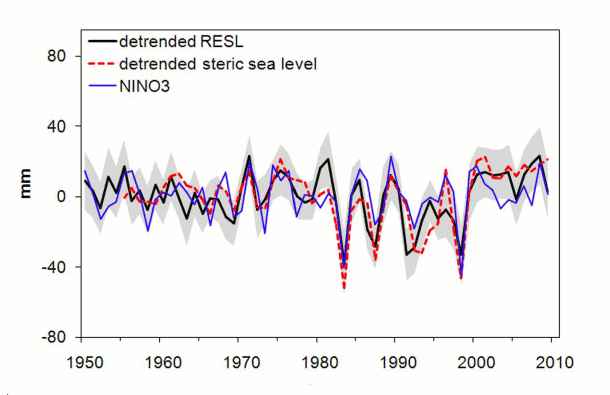
Figure 6 - Reconstructed sea level (RESL=black line) over the tropical western Pacific between 1950-2009 after the 1.8 mm per year trend has been removed (detrended). Gray areas represent RESL uncertainty. Red line=detrended steric (thermal expansion + salinity change) over the same period from ocean heat content data. Blue line= the NINO3 index, which is a measure of the sign (El Niño or La Niña) and strength of ENSO. See global map here for NINO3 region. From Becker (2011) 

Steric sea level is variation which results from changes in ocean heat content (thermal expansion), and changes in salinity (saltiness) which affects the density of seawater. Once the long-term trend has been removed (de-trended) from the reconstructed sea level and steric sea level, the relationship between sea level, the steric component and ENSO is plain to see in figure 6.     

GPS - accounting for vertical land movement

In many parts of the world the land surface is either very slowly rising or sinking, and this needs to be factored into reconstructions because, unlike the satellites measuring sea level, the tide gauges are firmly anchored to the sea floor. Becker (2011) sift through the GPS equipped western tropical Pacific tide gauge sites, ending up with 7 sites that are of sufficient quality for analysis. They make the assumption that the rate of subsidence (sinking) observed over the short time of GPS use, holds true back to 1950, and find that subsidence adds an additional 10% to the total sea level rise experienced at Tuvalu.

So to sum up:

  • In the tropical western Pacific the dominant short-term influence on sea level is the extremely large fluctuation due to the ENSO events El Niño (falling sea level at Tuvalu) and La Niña (rising sea level at Tuvalu).
  • Sea level at Tuvalu can vary by 20-30cms from the influence of ENSO. This is 40-60 times larger than the annual rate of sea level rise at Tuvalu.
  • This regional susceptibility to ENSO is because of the weakening (El Niño) or strengthening (La Niña) trade winds near the equator, which push warm water mass toward the tropical western Pacific.  
  • Becker (2011) uses a combination of tide gauge data, satellite observations, ocean modelling and GPS to assess sea level change around Tuvalu.
  • Removing all the factors which affect short-term sea level fluctuation, the study authors found long-term sea level at Tuvalu from 1950-2009 rose at the rate of 5.1 (±0.7) mm per year. This almost 3 times greater than the global average sea level over that time of 1.8 mm per year.
  • 10% of this 'total' sea level rise at Tuvalu is due to land subsidence

This is the advanced version of: Tuvalu sea level isn't rising

0 0

Printable Version  |  Link to this page

Comments

Prev  1  2  

Comments 51 to 80 out of 80:

  1. Ms@ 49 can you be specific and tell me which part you disagree with and why. That way I can respond. And do you have a source for seawater expanding from 0C to 4C, when as you acknowledge fresh water doesn't (actually contracts) I have searched all through the website and find lots of articles on SLR, but very little on the zonal tilting or regional differences.In fact zonal tilting got zero hits! As the main article for this forum is about region difference in sea level rise (zonal tilting), that is all I am looking at. If ice sheet melting adds water to the oceans, why will Tuvalu get more rise than the ocean average rise? A simple why? Not interested in the average rise (that's a different topic) just the increase in zonal tilting. Can we please stick to zonal tilting or regional differences and not average rises?
    0 0
  2. Tealy, as people have told you several times now, ice melt and thermal expansion do contribute to regional differences in sea level. Your continued insistence that 'zonal tilting' is the only relevant issue for regional (vs average) sea level is simply false. Indeed, changes in the zonal variations caused by the trade winds are comparatively tiny.
    0 0
  3. CB @ 52 Yes people have told me that ice let and thermal expansions of oceans contribute to regional differences in sea level, but have nnot been able to explain why in scientific terms or provide a specific source that says it does. I have looked to my wits end and cannot find an explanation or source either, hence why I am asking. Zonal tilting is the name for the regional difference that occurs across the pacific, it's the macro regional difference. If trade winds are a tiny cause of the zonal variations, what are the large causes?
    0 0
  4. Tealy, "Zonal Tilting" appears to be a term that you have made up so it is not surprising that you get no hits. The IPCC projection is outdated and incomplete. Current worldwide sea level rise is about 3.2 mm/yr. The Tuvalu excess is only 2 mm/yr or 4 cm over the past 20 years. That rate could go on for decades. Worldwide average global sea level rise is currently conservatively estimated at 1-2 meters by the year 2100. That is about 15mm/yr over the entire globe (but the rise will not be linear). Obviously, that includes Tuvalu. You suggest that the rise at Tuvalu will be substantially less than that. You must provide evidence for your extraordinary claim. Since you appear to be unaware that 1-2 meters by 2100 is the current projection, you need to read the background so that you can contribute to the discussion.
    0 0
  5. Tealy, you misread. The trade winds are responsible for the entirety of the phenomena you are calling 'zonal tilting'. What is tiny is the long term change in sea level due to changes in the trade winds. Basically, you are ignoring the two largest factors causing sea level rise (i.e. thermal expansion in the short term and ice melt in the long run) to concentrate obsessively on a factor which disappears in the rounding. Think about it for a moment. Do you really think that the slight increase in sea surface height due to wind blown water, caused by the slight increase in trade wind strength (caused by global warming), is going to be more significant than adding more water and increasing the volume of the water already present? It's like arguing that the water level in a pot isn't rising because the chunk of ice inside is melting and the water is getting hotter... it is rising because there is a slightly stronger breeze blowing over the surface.
    0 0
  6. @ Tealy
    "ice melt and thermal expansions of oceans contribute to regional differences in sea level, but have not been able to explain why in scientific terms or provide a specific source that says it does."
    Try these papers and articles from around SkS and the web:
    1. Climate related sea-level variations over the past two millennia
    2. Acceleration of the contribution of the Greenland and Antarctic ice sheets to sea level rise
    3. Paleoclimate Implications for Human-Made Climate Change
    4. Sea Level Rise
    5. Global sea level linked to global temperature
    6. Sea levels will continue to rise for 500 years
    7. Sea Level Hockey Stick
    8. The Last Interglacial - An Analogue for the Future?
    9. 2000 Years of Sea Level (+updates)
    10. Melting Threat From West Antarctic Ice Sheet May Be Less Than Expected; But U.S. Coastal Cities At Risk
    11. Reassessment of the Potential Sea-Level Rise from a Collapse of the West Antarctic Ice Sheet
    0 0
  7. Tealy - at comment @46 you claimed that thermal expansion contributed more to current sea level rise. When I asked for a citation at comment @47, you replied with an armflapping response about projections for the 21st century, you did not provide a citation to support your assertion. Your assertion is wrong. The addition of water mass (melt-water from ice sheets and glaciers) to the rate of current sea level rise is over twice that of that of thermal expansion from global warming. See Leuliette & Willis (2011) - Balancing the Sea Level Budget. It is clear from your persistently wrong assertions and unwillingness to learn that you are here simply to create the false impression of doubt, and also to waste people's time. I'm sure you can find other blogs where your commitment to non-learning and erroneous beliefs is appreciated. I would urge other moderators to not tolerate further nonsense -snip-.
    0 0
    Moderator Response: [Albatross] I share your frustration but please tone it down. Thanks.
  8. Rob Painting @57 Don't tell me, take your vitriol to the IPCC and tell them they got it all wrong and that it is "nonsense". If you would read my post you will see I gave a citation as you asked, it quoted the IPCC, I gave a web address, and an explanation. If you would like more detail here is the IPCC website showing 6 climate models of sea level rise from 2000 to 2100, and all 6 models show thermal expansion is the greater component of sea level rise accounting for about 2/3 of the total rise. For example the B1 model shows the main components over the 21st century for the 95% confidence interval as:- Thermal expansion of 0.24m Land ice sum of 0.18m Resulting Sea level rise of 0.38m Ie thermal expansion is greater than ice melt!!!! http://www.ipcc.ch/publications_and_data/ar4/wg1/en/ch10s10-6-5.html
    0 0
    Response:

    [DB] "Ie thermal expansion is greater than ice melt!!!!"

    Again, you rely upon outdated information.  More current exist, as referenced in the response to your comment subsequent to this.  Future SLR in the pipeline will greatly exceed thermal expansion of the oceans.

    A presumption that your source citations from 5 years ago supercede the advice and citations given to you in 2012 is a strategy for failure.  FYI.

  9. Cbdunkerson @55 I agree with you wholeheartedly. Yes zonal tilting (or regional variations if you prefer) will be insignificant compared to other causes of sea level rise. It's poorly understood, even acknowledged on this forum as contradictory, and therefore should not be included in projections of sea level rise. A recent (50 year) increase in zonal tilting does not in itself mean zonal tilting will continue to rise. Daniel Bailey @56 Thank you but they are all references to sea level rise being the average sea level rise. Regional differences in sea level rise, by that i mean why say Tuvalu has a different sea level rise than say Fiji, Hawaii, or Panama, is not addressed by those references, only the average rise is addressed.
    0 0
    Response:

    [DB] "Thank you but they are all references to sea level rise being the average sea level rise."

    In order to properly answer your question you need more than a simple answer; SLR is a complex process, but is well studied from the paleo record & well-reproduced in models and subsequently verified with regional analyses.

    The first portion establishes that there is extensive literature much more current that the IPCC AR4 you reference.  You were given a small portion of that, a portion documenting considerably higher SLR rates in the pipeline as well as the relationship between temperature (a defining metric for sea levels) and SLR.  The last two links specifically reference regional variations in SLR due to ice sheet melt. So you were indeed given answers.

    Here's more:

    Regional impacts due to SLR:

    Thermal expansion of sea water a limited factor in SLR:

  10. Tealy wrote: "I agree with you wholeheartedly." So... you agree that Tuvalu sea level is changing primarily due to ice melt? Funny how that isn't clear from your postings. Your argument seems to boil down to the fact that we don't have an exact breakdown of long term Tuvalu sea level rise by category (e.g. total ocean volume change vs gravitational change vs land subsistence vs prevailing winds change). As such, I don't really see the point. Becker 2011 estimates land subsistence at about 10%, and the other three are all being driven, in the same direction, by global warming. Is this just another variation on, 'if we do not know everything then magical unknown factors could come along and reverse all observed and modeled trends'? If so, then yes... that could happen. It is just so unlikely as to be not worth worrying about until some shred of evidence supporting it is found.
    0 0
  11. Tealy, Everyone knows that the IPCC estimates specificly omit ice melt from the great ice sheets. they leave out the greatest contributator to sea level rise. You need to read the background so that you don't make these basic mistakes. The citations you have ignored detail these errors.
    0 0
  12. Tealy - "Don't tell me, take your vitriol to the IPCC and tell them they got it all wrong and that it is "nonsense" No need to blame the IPCC, it's just [ snip ] You claimed that current thermal expansion is greater than the contribution of ice melt. You are wrong Tealy The citation I provided above - Leuliette & Willis (2011) - Balancing the Sea Level Budget, shows current ice melt contribution to sea level rise is double that of thermal expansion. When challenged you gave up [snip] . You are still doing so, as if the average reader will not cotton on to this. The 2007 IPCC report is a projection for the coming century which does not include the dynamical contributions of ice melt (as Michael Sweet also points out). They even state that in the reports you linked to. They did not include the ice melt contributions because it could not be adequately modeled at that time - it's still very uncertain even now. But we don't need models to understand that at a similar stage of Greenland and Antarctic ice sheet cover - the Eemian interglacial - that warming saw rapid multi-meter century-scale rises in sea level. This is because the ice sheets 'collapsed'. If that happens this century,sea level rise at Tuvalu could be be far greater than the current 5.1 mm per year. In fact they could likely top 20mm per year by century's end, according to some estimates. Now just to be clear: Tealy, you were wrong when you asserted current thermal expansion was greater than ice melt. In fact if you even remotely understood the energy requirements needed to elevate sea level through expansion versus the energy required to melt land ice, I would not have to explain to you that you are wrong. But regardless, the observations show that you are wrong Citing the IPCC report about projected future rates of sea level rise, which exclude increased ice melt contribution, does not support your false assertion. How can they, they haven't happened yet anyway? Why does that simply fly by your cognitive filters?? The right thing to do here is to just admit none of this makes any sense to you because you [ snip ] waste people's time. This is clear by your continued repetition of false assertions throughout this thread. And by the way, the snipped portion in my previous comment wasn't an ad hominem, it was a description of an activity with the sole intent to waste people's time.
    0 0
    Moderator Response: [muoncounter] These snips are indeed ad hominem. Please tone it down.
  13. Rob and Michael, In addition to your excellent posts, let me try and clear up some of the confusion that is being sown a certain misguided and ill-informed poster. This thread is about Tuvalu sea levels, but the ill-informed poster has managed to derail the discussion in several directions. As I will demonstrate, for both 1972 to 2008 and for 1993 to 2008 the contribution to the total sea level rise from land ice exceeds that from the total thermal expansion contribution. The ill-informed poster seems to be confused about the difference between observations and projections when it comes to the relative contributions of the thermal and land ice to the total sea-level rise. Becker et al. (2011) use a combination of observations and model simulations to better understand what is happening with sea levels around tropical Pacific islands since 1950. So the focus is what has happened in the past. The ill-informed poster makes the mistake then of confusing observations with projections (that exclude contributions from dynamic land ice loss) and draws the conclusion that thermal contribution is greater than the contribution from land ice. This assertion is of course demonstrably false and not supported by the data. Rob you gave the example of Willis and Leuliette (2011). I will provide another, Church et al. (2011). Church et al. (2011) used observations to close the sea-level budget. Below is their Table 1 which summarizes the different contributions the sea level budget. Note that for both 1972 to 2008 and for 1993 to 2008 the contribution to the total sea level rise from land ice exceeds that from the total thermal expansion contribution. More so for the 1993-2008 window, reflecting the increasing importance of land ice over thermal expansion in the past 15 years or so to sea level rise.
    0 0
  14. Rob, The misguided poster on this thread seems convinced that the reason for the increase in sea level is an increase in the easterly trade winds. This is only partly correct. Research has shown that since the nineties there has been an increase in the strength of the easterly winds in the western tropical Pacific has indeed been partly responsible for the increase in the sea level there-- in fact, SLR in that regions is 3-4 times greater than the global average in that region. But their claim fails to address the bigger picture. You cite Merrifield (2011). Merrifield published another paper in 2011 on this issue. But first let me set the stage by quoting from Merrifield (2011): "This sea-level trend shift in the western Pacific corresponds to an intensification of the easterly trade winds across the tropical Pacific. The wind change appears to be distinct from climate variations centered in the North Pacific, such as the Pacific Decadal Oscillation....The shifts in trade wind strength and western Pacific sea level rate resemble changes in dominant global modes of outgoing longwave radiation and sea surface temperature. It is speculated that the western Pacific sea level response indicates a general strengthening of the atmospheric circulation over the tropical Pacific since the early 1990s that has developed in concert with recent warming trends." So this paper suggests a positive feedback associated with global warming, with a general increasing trend in sea-level being amplified over the western tropical Pacific due to changes in the wind field possibly associated with AGW. Merrifield and Maltrud (2011) published another paper on this issue. This paper was highlighted in the EOS newspaper and they summarize the implications of the paper's findings as follows: "...using a general circulation model, Merrifield and Maltrud show that western tropical Pacific sea level trends are likely due to a gradual intensification of the Pacific trade winds in the past 2 decades. They also highlight other aspects of ocean circulation that have been altered in response to the intensifying trade winds. Some previous research has suggested that the trade wind intensification is a result of global warming, although that has yet to be verified. If that is the case, the authors conclude the western tropical Pacific sea level trends will likely continue to be anomalously high." Even if the trade winds do moderate, things are not looking good for Tuvalu, and down the road they could face serious issues during La Nina years when the long-term underlying trend will be amplified when water piles up in the western equatorial Pacific. In fact, they may be already experiencing problems on account of the current prolonged La Nina.
    0 0
  15. If i am going to be challeneged iin such a way i will use the most established most peer reviewed source, th IPCC. While there are other reports these do not have the backing of th IPCC. They may in time but I am not going to be accused of using obscure reports. The IPCC report is for the current period as we are in 2012. I read RB citation of Leuliette et al, and all I gleaned was comparison the heat of formation of ice for the same heat to cause expansion of water. You could arrive at that from a table of material properties. They did not say ice was melting more. Note this, they did not say that. Quote what they actually said? They did not say how if the heat was put into ice, that heat would be isolated into only melting ice, and not into warming sub zero ice that results in no melt .ie remember much of antarctica is very sub zero, sub zero ice still absorbs the heat, produces no melt and no sea level rise. You just get warmer sub zero ice. (-snipIf you don't understand all this, then you don't have any relevant qualifications and I might as well be debating it with my barissta, at least I will get a coffee in the process.-)
    0 0
    Response:

    [DB] "The IPCC report is for the current period as we are in 2012."

    No.  THe IPCC is a distillation and summary of the available literature at the time of the (AR4) report.  While certain sections contain modelled periods covering some aspects of the near future, they do not (as has been pointed out to you several times) properly address ice sheet contributions to sea level rise.  Said ice sheet losses are currently ongoing (as they were back in 2007, at the time of the AR4), and are increasing in volumes lost.

    To continue your prosecution of this fallacy is false and misleading.  Please desist.  And familiarize yourself with the Comments Policy.

    Inflammatory and derogatory snipped.

  16. Rob and Michael, One last post that speaks to causes of the regional changes in SLR and the relative contributions from thermal expansion and land ice. I also keep forgetting to mention that the backdrop of this post is that to this day some "skeptics" claim that sea levels around Tuvalu are either not increasing or that SLR it is not an issue, well it clearly is and will very likely get worse. Cazenave and Remy (2011) just published a paper, they conclude: "Moreover, sea level rates are not geographically uniform; in some regions like the tropical western Pacific, rates are up to 3–4 times higher than the global mean rate. We next discuss the climate‐related components of the global mean sea level rise. Over the last ∼18‐years, ocean thermal expansion contributes about one third to the observed rise while total land ice (glacier melting plus ice sheet mass loss) contribute the other two third. The spatial trend patterns evidenced over the altimetry period mostly result from nonuniform steric sea level changes (effects of ocean temperature and salinity), largely caused by wind‐driven ocean circulation changes. Such patterns are not stationary but oscillate through time on decadal/multidecadal time scale, in response to natural modes of the coupled ocean‐atmosphere system." So we now have three recent papers refuting the claim that the contribution until now has been greater than that from land ice. The misguided poster clearly misrepresented the science presented in the IPCC fourth assessment report in 2007. One does not need ever increasing easterly winds in the tropical Pacific for Tuvalu and surrounding islands to be in trouble as our misguide poster seems to think. As noted before, La nina years will become increasingly problematic in future years for Tuvalu. Additionally Willis and Leuliette (2011) [and others, e.g., Rignot et al (2011)] note that: "Furthermore, if the rate of global sea level rise continues to accelerate over the next century, it is likely that the primary cause will be increased melting and mass loss from the ice sheets in Greenland and Antarctica".
    0 0
  17. Albatross my original post was if the regional anomaly rise near Tuvalu is caused by trade winds increase (that were possibly caused by global warming) then there would be a limit to this rise as the trade winds cannot just keep intensifying forever as the arcticle implied. You would finish up with hurricane trade winds. Somehow people have gone off in all sorts of directions from that with all sorts of other quotations and citations.
    0 0
    Response:

    [DB] "Somehow people have gone off in all sorts of directions from that with all sorts of other quotations and citations."

    Various participants, in a seemingly fruitless attempt to be helpful, have responded to the many and various misconceptions you have espoused.  Misconceptions that have nearly dragged this thread off-topic.  But no more.

    You have been pointed out to be wrong now on multiple occasions on multiple, specific subjects.  You then turn to complaints about how you are being treated.  Desist.

    Please note that posting comments here at SkS is a privilege, not a right.  This privilege can and will be rescinded if the posting individual continues to treat adherence to the Comments Policy as optional, rather than the mandatory condition of participating in this online forum.

    Moderating this site is a tiresome chore, particularly when commentators repeatedly submit offensive or off-topic posts. We really appreciate people's cooperation in abiding by the Comments Policy, which is largely responsible for the quality of this site.
     
    Finally, please understand that moderation policies are not open for discussion.  If you find yourself incapable of abiding by these common set of rules that everyone else observes, then a change of venues is in the offing.

    Please take the time to review the policy and ensure future comments are in full compliance with it.  Thanks for your understanding and compliance in this matter.

  18. I have only ever tried to discuss zonal tilting or regional variations. If in doubt read my posts. Start from the beginning and read my posts.
    0 0
    Response:

    [DB] As Albatross has seen fit to rebut in exquisite detail (both before and after this comment), you are wrong and therefore need to re-read your own comments.

  19. It is getting rather tiresome having certain people talking through their hats. This is another false assertion made by our misguided poster, "The IPCC report is for the current period as we are in 2012." The fourth assessment report was published back in 2007, that was five years ago. And some of the papers they cited were published in 2006 or earlier. Science moves on, data observations systems improve... Discussion about the mechanisms/theory of how land ice is being lost from Antarctica should be taken to a more appropriate thread. The data from Church et al. (2011) shown @63 above indicate that the loss of ice form the Antarctic ice sheet is increasing. On how this is happening is very interesting (albeit disturbing) and perfectly plausible and consistent with what we know about ice sheet behaviour and thermodynamics. But as I said, that needs to be discussed on another thread. Might I suggest this thread.
    0 0
  20. Albatross - "It is getting rather tiresome having certain people talking through their hats. Indeed, but other moderators have seen fit to tolerate this trolling. This person isn't here to learn, but to spray graffiti. I was hoping by now others would have stepped in to warn this person, being personally involved myself it's against the rules for me to do so.
    0 0
  21. I addressed the following misguided claim and incorrect in my post at 66: "Tuvalu is caused by trade winds increase (that were possibly caused by global warming) then there would be a limit to this rise as the trade winds cannot just keep intensifying forever as the arcticle implied." No-one suggested this, but I now see how the confusion might have arisen for those who are not familiar with the climate system-- we are not dealing with a one-to-one relationship, nor are we dealing with a linear system, nor are we dealing with runaway warming. So no-one is suggesting that the winds will simply continue to increase ad infinitum. Again, from Cazenave and Remy (2011): "The spatial trend patterns evidenced over the altimetry period mostly result from nonuniform steric sea level changes (effects of ocean temperature and salinity), largely caused by wind‐driven ocean circulation changes. Such patterns are not stationary but oscillate through time on decadal/multidecadal time scale, in response to natural modes of the coupled ocean‐atmosphere system." These spatial patterns are not stationary, they are oscillations, no-one except our misguided poster is suggesting that they will increase ad infinitum. It is these oscillations that when superimposed on the underlying systematic increasing trend will either accentuate or mute the underlying trend.
    0 0
  22. Regarding this claim: "I have only ever tried to discuss zonal tilting or regional variations" Now that is not entirely true. 18:43 PM on 26 January, 2012: "ice melt is the lesser component of sea level rise and sea based ice contributes zero to sea level rise (Archmedes) only land based ice does. 21:24 PM on 26 January, 2012: "People say it's ice melting rise because as it's something they can see and touch, but it's a misnomer that should not be propagated. It's wrong, its patronising, and it destroys credibility to change the facts in the belief people wouldn't have understood." 23:39 PM on 27 January, 2012: "If you would like more detail here is the IPCC website showing 6 climate models of sea level rise from 2000 to 2100, and all 6 models show thermal expansion is the greater component of sea level rise accounting for about 2/3 of the total rise." 10:30 AM on 28 January, 2012: "...remember much of antarctica is very sub zero, sub zero ice still absorbs the heat, produces no melt and no sea level rise. You just get warmer sub zero ice. If you don't understand all this, then you don't have any relevant qualifications and I might as well be debating it with my barissta, at least I will get a coffee in the process. " Just a few examples demonstrating that the initial quote above is demonstrably false. Like others, I suggest that the misguide poster listen and read more before pontificating. "I have searched all through the website and find lots of articles on SLR, but very little on the zonal tilting or regional differences.In fact zonal tilting got zero hits!" That "zonal tilting" yielded zero hits should be a big clue that they are barking up the wrong tree.
    0 0
  23. Tealy, As I pointed out to you here, the regional rise at Tuvalu is only about 2 cm per decade. This newspaper article documents a temporary 60 cm rise in sea level on the US East coast caused by changing currents. The data supports the idea that the current small excess at Tuvalu could continue for at least several more decades. The sea level rise world wide is expected to be far in excess of 5 mm/yr in two decades so we expect the current rise at Tuvalu to increase, not decrease. If you read my post to you you would not make the same claim over and over. If you read the background material you will stop making such absurd claims.
    0 0
  24. What happened to my previous post?
    0 0
    Response:

    [DB] Your previous comment was moderated out due to multiple violations of the Comments Policy.  Specifically, inflammatory and ideology.  Again, please construct your comments to both comply with the policy and also be on-topic to the post on which you are placing the comment.

  25. Tealy, FWIW, I have a PhD in meteorology. But that is irrelevant. I find your stance on professional qualifications condescending and offensive-- one does not need scientific qualifications to understand the post, just intelligence, an open mind and an eagerness to learn and to actually read the papers. Moreover, you are arguing against the many professional and respected researchers (e.g., Church) who making studying SLR their business, so you are the one railing against the professionals. But since you brought it up what are your qualifications and in which field? You post/rant was probably deleted (not by me) b/c it violated the comments policy. You might want to read them again, references to "religious cults" tend to get deleted. As for being respectful, I suggest that you respect the advice and read the papers cited by professionals on this thread, and not suggest that you are superior to people posting here. I'm sorry you feel that maligned, but truth is that you largely brought it on yourself, and your rant that was deleted was very revealing. Look up Dunning-kruger effect some time.
    0 0
    Response:

    [DB] Please refrain from buying in to being dragged off-topic.  Tealy is trolling with his questioning of credentials.  Tealy has demonstrated the need to being tightly moderated, which he will receive until his comments conform to the Comments Policy.

  26. Tealy, In one of your deleted posts you suggest that I said local sea level rise at Tuvalu could be 5 feet. That is the Global Sea level rise scientists expect in the next 90 years. The IPCC estimate was a minimum increase, not an expected increase. Why are you unable to understand the most basic facts??? The regional anomaly is interesting but not at all important to future projections. Focus on the global estimates which are much more important. The problem in Tuvalu is not that they have a high local anomaly, the problem is that Global Sea Level rise is expected to overtop them this century. In your posts you frequently refer to global estimates as if they were local estimates and visa versa. You will find people more helpful if you stop making assertions about things you do not understand and ask questions to help you clear up your lack of basic knowledge. Carefully read the responses so that you stop repeating the same incorrect premises.
    0 0
  27. Simple question: if atolls are composed of coral and if coral grows in the sea, why are atolls above sea level?
    1 0
  28. Manny - I would suggest looking at Coral atolls and rising sea levels: That sinking feeling, where atoll formation is discussed. Basically, corals only grow up to the low tide point, but early Holocene sea levels were (effectively) higher in equatorial seas due to isostatic adjustment (glacial rebound) - giving them the chance to grow a couple of meters over current sea levels. When local sea levels dropped to the point where high tide didn't cover the coral, they accumulated sand and debris as loose top consolidate - and we get atolls.
    0 0
  29. Hang on, the ABC Fact Check determined that Tuvalu has grown by 2.9% in the four decades to 2014?

    www.abc.net.au/news/2018-12-19/fact-check-is-the-island-nation-tuvalu-growing/10627318

    0 0
  30. Markoh @79 , thank you for re-opening this thread after nearly 8 years.

    Your abc.net reference also describes how some of the Tuvalu islands are shrinking, and others are growing (a matter of coral sand being washed up onto them).  A similar mixed picture, with other Pacific coral islands, and elsewhere in the world too.

    Since the worldwide sea level is rising (according to tide-gauge measurements, and satellite measurements) at a slow but accelerating rate (due to the ongoing global warming plus an accelerating ice-melt . . . it comes as no surprise that many low-lying islands (coral and non-coral) are beginning to suffer problems.   Not only the absolute sea level rise : but the rise plus stronger storm-urges are causing pollution of the fresh-water "lens" which, via bores, usually provides the necessities for the local population on such low islands.

    It is vastly expensive for them to "transport in" such fresh water supplies. And the local trees suffer from brackish water at their roots.  Result :- those islands become practically uninhabitable, long before the sea gets to ankle-level.

    Also no surprise: the locals are not happy about the situation.

    Markoh (as I asked and re-asked on your other thread today) ~ do you have a valid point that you wish to make?

    0 0

Prev  1  2  

You need to be logged in to post a comment. Login via the left margin or if you're new, register here.


The Consensus Project Website

THE ESCALATOR

(free to republish)


© Copyright 2024 John Cook
Home | Translations | About Us | Privacy | Contact Us