Climate Science Glossary

Term Lookup

Enter a term in the search box to find its definition.

Settings

Use the controls in the far right panel to increase or decrease the number of terms automatically displayed (or to completely turn that feature off).

Term Lookup

Settings


All IPCC definitions taken from Climate Change 2007: The Physical Science Basis. Working Group I Contribution to the Fourth Assessment Report of the Intergovernmental Panel on Climate Change, Annex I, Glossary, pp. 941-954. Cambridge University Press.

Home Arguments Software Resources Comments The Consensus Project Translations About Support

Bluesky Facebook LinkedIn Mastodon MeWe

Twitter YouTube RSS Posts RSS Comments Email Subscribe


Climate's changed before
It's the sun
It's not bad
There is no consensus
It's cooling
Models are unreliable
Temp record is unreliable
Animals and plants can adapt
It hasn't warmed since 1998
Antarctica is gaining ice
View All Arguments...


Username
Password
New? Register here
Forgot your password?

Latest Posts

Archives

Is the science settled?

Posted on 24 March 2010 by John Cook

A common skeptic refrain is that "the science isn't settled", meaning there are still uncertainties in climate science and therefore action to cut CO2 emissions is premature. This line of argument betrays a fundamental misunderstanding of the nature of science. Firstly, it presumes science exists in a binary state - that science isn't settled until it crosses some imaginary line after which it's finally settled. On the contrary, science by its very nature is never 100% settled. Secondly, it presumes that poor understanding in one area invalidates good understanding in other areas. This is not the case. To properly answer the question, "is the science settled?", an understanding of how science works is first required.

Science is not about absolute proofs. It never reaches 100% certainty. This is the domain of mathematics and logic. Science is about improving our understanding by narrowing uncertainty. Different areas of science are understood with varying degrees of confidence. For example, while some areas of climate science are understood with high confidence, there are some areas understood with lower confidence, such as the effect on climate from atmospheric aerosols (liquid or solid particles suspended in the air). Aerosols cool climate by blocking sunlight. But they also serve as nuclei for condensation which leads to cloud formation. The question of the net effect of aerosols is one of the greater sources of uncertainty in climate science.

What do we know with high confidence? We have a high degree of confidence that humans are raising carbon dioxide levels in the atmosphere. The amount of CO2 emissions can be accurately calculated using international energy statistics (CDIAC). This is double checked using measurements of carbon isotopes in the atmosphere (Ghosh 2003). We can also triple check these results using observations of falling oxygen levels due to the burning of fossil fuels (Manning 2006). Multiple lines of empirical evidence increase our confidence that humans are responsible for rising CO2 levels.

We also have a high degree of confidence in the amount of heat trapped by increased carbon dioxide and other greenhouse gases. This is otherwise known as radiative forcing, a disturbance in the planet's energy balance. We can calculate with relatively high accuracy how much heat is trapped by greenhouse gases using line-by-line models which determine infrared radiation absorption at each wavelength of the infrared spectrum. The model results can then be directly compared to satellite observations which measure the change in infrared radiation escaping to space. What we find in Figure 1 is the observed increased greenhouse effect (black line) is consistent with theoretical expectations (red line) (Chen 2007). These results can also be double checked by surface measurements that observe more infrared radiation returning to Earth at greenhouse gas wavelengths (Evans 2006). Again, independent observations raise our confidence in the increased greenhouse effect.
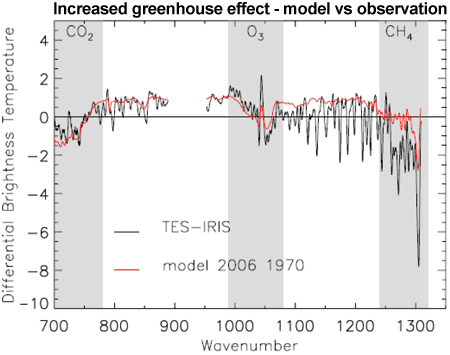
Increased greenhouse effect - models vs observations
Figure 1: Increased greenhouse effect from 1970 to 2006. Black line is satellite observations. Red line is modelled results (Chen 2007).

So we have a lower understanding of aerosol forcing and a higher understanding of greenhouse gas forcing. This contrast is reflected in Figure 2 which displays the probability of the radiative forcing from greenhouse gases (dashed red line) and aerosol forcing (dashed blue line). Greenhouse gas forcing has a much higher probability constrained to a narrow uncertainty range. Conversely, the aerosol forcing has a lower probability and is spread over a broader uncertainty range.
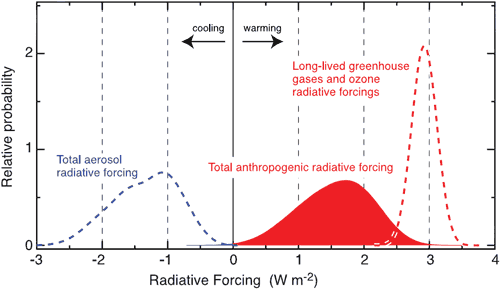

Figure 2: Probability distribution functions (PDFs) from man-made forcings. Greenhouse gases are the dashed red curve. Aerosol forcings (direct and indirect cloud albedo) are the blue dashed curve. The total man-made forcing is the solid red curve (IPCC AR4 Figure 2.20b)

The important point to make here is that a lower understanding of aerosols doesn't invalidate our higher understanding of the warming effect of increased greenhouse gases. Poorly understood aspects of climate change do not change the fact that a great deal of climate science is well understood. To argue that the 5% that is poorly understood disproves the 95% that is well understood betrays an incorrect understanding of the nature of science.

0 0

Printable Version  |  Link to this page

Comments

Prev  1  2  3  

Comments 101 to 101 out of 101:

  1. shawnhet writes: WV feedback(whatever its magnitude or sign for all but the very recent *atmospheric* temperature changes has *already happened*. There may be some other temperature changes coming along "in the pipeline", but WV adjusts to a temperature change in a period of months or so. That's right; if we eliminated all other forcings then the water vapor feedback would settle at its new equilibrium level very rapidly. However, it seems likely that we'll keep emitting CO2 for some time now. The water vapor feedback will continue to increase as long as CO2 continues to increase, and it will persist as long as CO2-induced warming persists (i.e., thousands of years).
    0 0
  2. fydijkstra, regarding the "hot spot", see the Skeptical Science argument "There’s no tropospheric hot spot." Be sure to read the comment by jshore.
    0 0
  3. Ken Lambert at 14:39 PM on 27 March, 2010 Yes O.K. Ken, but you’re really addressing a quantitative accounting that (a) we’re yet not in a position to determine (see discussion by Trenberth in the article under discussion), and (b) doesn’t really add or subtract from our present understanding of the Earth’s surface temperature sensitivity to enhanced radiative forcing. Of course, we could come up with some numbers that would accommodate a 3oC surface temperature rise (say) in response to a radiative forcing from doubling atmospheric [CO2] . But that wouldn’t take us any further than our present understanding of climate sensitivity which comes from many analyses of paleotemp/CO2 relationships (in which equilibrium responses are more likely to apply), and analyses of transient responses (e.g. to volcanic forcing). These indicate an Earth surface temperature response near 3 oC, with a range of 2-6 oC that is reasonably well-bounded at the low end and poorly bounded at the top end (see Knutti and Hegerl (2008) , for a review). On long timescales that allow slow ocean/ice sheet feedbacks the climate sensitivity might be larger than this (e.g. Lunt DJ et al. (2010)). Inspection of the temperature evolution/atmospheric CO2 levels during the last 150-odd years helps us quite a bit but also illustrates the nature of the uncertainty. So since the mid-19th century we’ve had around 0.8-0.9 oC of surface temperature rise, and [CO2] levels have gone up from around 286 ppm to 386 ppm. How might this translate into a climate sensitivity? Detailed quantitition is problematic since (i) the aerosol forcing which has certainly opposed some of the greenhouse-induced warming is poorly defined, and (ii) the climate-response time, particularly the very slow equilibration of the oceans to enhanced forcing, is not known with certainty. So we don’t know (i) if that 0.85 oC of warming (1850ish to now) would by 1 oC or 1.2oC or what, if we were to remove our atmospheric aerosols, and (ii) whether the current level of forcing will give us another 0.3 oC or 0.6 oC or what, of warming once the climate system has re-equilibrated with the forcing at some time in the future (multi-decadal timescale). We also have to account for non-greenhouse gas contributions to warming (v. likely these are small), and the fact that non-CO2 greenhouse contributions (methane, tropospheric ozone, N2O) need to be factored in. Can we say anything helpful? Well yes, we can look at the expected warming from various climate sensitivities [***] to determine the surface temperature rise expected from the enhanced [CO2]. For a climate sensitivity of 2oC (of surface warming per doubling of atmospheric [CO2]) this is around 0.85 oC at equilibrium (for a [CO2] increase from 286-386 ppm), and for a 3 oC sensitivity, ~1.25 oC of surface warming. Since we’ve already had 0.85 oC of warming without taking account the aerosol effect and the climate response time), it’s very unlikely that the climate sensitivity can be lower than 2 oC of warming per doubling of atmospheric CO2. A similar conclusion was recently obtained from an obviously (!) much more detailed analysis of the Earth’s energy balance since 1950 (Murphy et al. (2010) -------------------------------------------- [***] delta T = (ln([CO2]final/[CO2]start))*s/ln(2) where deltaT is the surface temperature change expected from a change in [CO2] from [CO2]start to [CO2]final in ppm, and s is the climate sensitivity in oC.
    0 0
  4. Whoops….two of my links don’t work. They should be: R. Knutti and G. C. Hegerl (2008) The equilibrium sensitivity of the Earth's temperature to radiation changes Nature Geoscience 1, 735-743 Knutti and Hegerl (2008) and: Murphy DM et al. (2009) An observationally based energy balance for the Earth since 1950 J. Geophys. Res.114 art. #D17107 Murphy et al. (2009)
    0 0
  5. fydijkstra at 23:02 PM on 27 March, 2010 Setting aside the “hot spot” point that has already been addressed ( Riccardo and Tom Dayton), there are a couple more points that could be addressed in your post fydijkstra: There is no high confidence that the warming in the last 30 years is exceptional, nor that anything in the pattern of warming in the last 200 years is closely related to the concentration of CO2. Since paleoanalysis indicates that the warming of the last 30 years is exceptional at least in the context of the last millennium and likely last two millennia, I don’t think your statement is supported by the science (see e.g. overlay of paleotemp reconstructions, and more recent paleoanalysis). Likewise, the pattern of warming is entirely consistent with the expected effects of enhanced [CO2], both in degree (see chris) and its nature (polar amplification; tropospheric warming associated with stratospheric cooling etc.). The relationship of the global temperature with patterns of ocean circulation is much better than the relationship with the CO2 concentration. That’s certainly incorrect. Analysis of ocean current contributions to 20th century warming indicates that these have made close to zero net contribution to warming over the last 100 years, and in fact reinforce the dominant role of enhanced greenhouse gas contributions ( Swanson et al (2009)[*] There is a lot of evidence, that the climate is much more complicated than could follow from the high understanding of heat trapping by CO2 alone. I don’t think anyone would say otherwise. That doesn’t negate the fact that we have rather high scientific certainty that raised greenhouse gas levels have dominated the Earth’s surface temperature rise during the last 100-150 years. [*]K.L. Swanson et al. (2009) Long term natural variability and 20th century climate change Proc. Natl. Acad. Sci. USA 106, 16120-16130
    (from the conclusions): This analysis indicates that natural contributions (largely ocean circulation variability) have had a significant effect on 20th century temperature variability. However the nett contribution to overall 20th century warming is close to zero. Essentially ocean circulation variability made a positive contribution to early (1900-1940) 20th century warming, a negative contribution to mid 20th century warming and a positive contribution to late 20th century warming. Once the natural variability is removed the externally forced (greenhouse) contribution is manifest as a continuous accelerating warming.
    0 0
  6. Riccardo:it's not concentration that matters for your argument, it's relative humidity. Also consider that precipitations counteract, or limit, cloudiness increase; the water in the rain drops must come from somewhere after all. Well, obviously, the RH and the concentration of WV are inseparable at a given temperature, but IAC, it is the concentration that matters. It takes a certain number of water molecules to make a raindrop or a cloud. Thus, if everything else is equal we would expect more raindrops and clouds to form when air @ (for example) 15C cools by 1C, than if air @ 14C cools by 1C. Your second sentence is possibly true, but I was going for the least possible assumptions in my "model" namely that everything stayed *proportionally* the same when WV went up. It is possible that increasing WV will cause precipitation to take place quicker which could potentially reduce the amount of clouds. This issue is too complicated for me to get into right now, but it is interesting. Ned:That's right; if we eliminated all other forcings then the water vapor feedback would settle at its new equilibrium level very rapidly. However, it seems likely that we'll keep emitting CO2 for some time now. The water vapor feedback will continue to increase as long as CO2 continues to increase, and it will persist as long as CO2-induced warming persists (i.e., thousands of years). I don't really disagree here, except maybe about the thousands of years. My point was directed to folks who might think that WV feedback on the forcing we've already added was yet to happen. Cheers, :)
    0 0
  7. shawnhet, if you hold the temperature fixed there's no way to vary WV. In all practical purposes we can safely assume that it is in equilibrium at the given temperature. If you let the temperature increase, instead, you'll get increasing concentration at constant relative humidity.
    0 0
  8. shawnhet at 06:42 AM on 28 March, 2010 My point was directed to folks who might think that WV feedback on the forcing we've already added was yet to happen. That's not quite right. As you indicate we've had the water vapour feedback on the warming that's occurred so far. However since we haven't yet had all the warming that will eventually result from the forcing we've already added, there is still some water vapour feedback to accrue as a reult of the current forcing.
    0 0
  9. Riccardo #107, I don't understand what you are trying to say. If we hold the RH constant but increase the temperature, then we have increased the absolute concentration of WV molecules in the air, right? Then, when the water in the air condenses more water molecules are available to form clouds and raindrops etc... than when the air was cooler. There are *not*, for instance, the same amount of water molecules available to form clouds and raindrops when the RH is 60% and temperature is 10C and cools to 9C as when the RH is 60%, temperature is 20C and cools to 19C. Chris, #108 yes, you're right. I mistyped in my previous post. The feedback on the warming has already happened, there may be further warming in the pipeline from the forcing that will then be fed back upon. Cheers, :)
    0 0
  10. shawnhet, it all started here: "if we assumed that cloudiness increases proportionally with concentration of WV this would be a negative feedback." What i was pointing out is that, as a zeroth order aproximation, if relative humidity is constant on increasing temperature (the only possible way to increase WV concentration) you do not get this feedback, no matter what the actual concentration is. Conversely, it's true that you get an effect on precipitations and, maybe more important, on the energy flow through the system due to the increased latent heat exchange. This is the reason why in a warmer world we expect wet regions to become wetter and dry region dryer, and more frequent extreme events.
    0 0
  11. Riccardo, I'm not sure what your point is, but obviously it is possible to increase WV in the atmosphere by *evaporation*, even if the temperature stays the same. However, since I am talking about condensation I am not talking about the temperature continually staying the same , but rather what happens when warm air cools. My point, is that when warm air of a given RH *cools* more water vapor is condensed than when cooler air of the same RH cools by the same amount. I will point you to the following page where you can do appropriate calculations to test this out. Relative humidity calculator Cheers, :)
    0 0
  12. Shawnet, I'm wondering what your point is too. O large scales, RH tends to remain within certain limits, so, averaged over a global scale, you can not cram more WV in the air than what it will take at a certain temp. Whatever is on top of that will soon rain out. In addition, for your assumption (more water condensing) to materialize, it is necessary for the air to cool below its dew point. Perhaps that will tend to happen as much, or more, or less. Even if it is more watedr condensing than a at lower temps, all it means is a better chance for droplets to become heavy and rain down (less residence time for the clouds to reflect sunlight), and also more latent heat release from condensation. The energy does not go away. That points to possible more frequent heavy precipitation/violent weather but other than that, what? Wild speculation used as a stepping stone to grasp at straws, in order to demonstrate, what exactly?
    0 0
  13. Phillippe, I fail to see where I have engaged in wild speculation. I have merely raised the simple hypothesis that more WV in the air will lead to both more clouds and more precipitation. Warmer air will hold more WV cooler air everything else being equal and, thus, cooling it by the same amount will cause more precipitation for a warm climate than a cool one. How Much More Rain Will Global Warming Bring? Frank J. Wentz,* Lucrezia Ricciardulli, Kyle Hilburn, Carl Mears Climate models and satellite observations both indicate that the total amount of water in the atmosphere will increase at a rate of 7% per kelvin of surface warming. However, the climate models predict that global precipitation will increase at a much slower rate of 1 to 3% per kelvin. A recent analysis of satellite observations does not support this prediction of a muted response of precipitation to global warming. Rather, the observations suggest that precipitation and total atmospheric water have increased at about the same rate over the past two decades. While the energy from condensation doesn't disappear, it does disappear from the surface resulting in cooling of the surface. In the Kiehl and Trenberth model, the surface temperature is the solar heating of the surface + backradiation minus evapotranspiration(and the energy absorbed by the Earth). Your idea that cloud lifetimes will be lessened is of course possible, but does seem a little speculative to me. Cheers, :)
    0 0
  14. My hypothesis is not the only one to be speculative and there is some work to back it up. Trenberth' model showing decreasing cloud cover leading to more insolation and the majority of warming happening from insolation is an example. That was linked multiple times in earlier threads.
    0 0
  15. #92 Ned at 14:40 PM on 27 March, 2010 "To illustrate the point about positive feedbacks, here are graphs of two cases, one where f > 1 (resulting in a runaway increase) and one, like the real-world positive water vapor feedback, where 0 < f < 1, so that the temperature increase is bounded (2C in this case)" I see. Your model should go something like this: 1 Average SST (Sea Surface Temperature) s is a monotonic function H of average IR optical depth y of atmosphere: s = H(y) where H(y1) > H(y2) for all y1 > y2. 2 For a given optical depth y0 there is an equilibrium temperature s0 so that s0 = H(y0). 3 This equilibrium is stable against small transient perturbations. 3.1 If H is considered to be a functional acting on optical depth histories y0 + y(t) such that y(t) is bounded (y0 >> |y(t)|) and zero outside t1 > t > 0 for some t1, then H(y0 + y(t)) tends to s0 in the long run. 4 H is smooth around y0, that is if the integral of y(t) squared is sufficiently small, there is some linear transform H such that H(y0 + y(t)) = H(y0) + Hy 5 H is time shift invariant. That is if h(t) = H(y(t)), then h(t+t1) = H(y(t+t1)) for all t1. In this case the linear transform H defined above is a filter and is fully specified by its impulse response function or the Fourier transform of it, the transfer function. 6 Let H be a first order lowpass filter. It's easier to visualize its response to a step function y(t) which is y1 for t > 0 and zero otherwise. If this forced increase in optical depth (relative to the equilibrium value of y0) induces a long term increase of s1 in SST, the response function defined by H is h(t) = s1/y1(1-e-t/t0) where t0 is relaxation time. Now. Average water contents of the atmosphere is somewhere around 4000 ppmv, highly variable. It is more than ten times the current CO2 level. Also, H2O has much more absorption lines in thermal infrared, so even tiny changes in humidity imply changes in overall IR optical depth. Also, as the story goes, vapor pressure of H2O over open water surfaces increases with temperature, so overall optical depth is also expected to increase. As average annual precipitation on Earth is close to 1000 mm and atmospheric moisture is low (only 0.24% by weight), turnover time has to be short (approx. 9 days). Therefore atmospheric IR optical depth change should be an almost instantaneous response to a change in SST. We have already postulated a rise of s1 in SST in response to an increase in optical depth of y1. Now it is done the other way around. If SST is increased by s1, it causes an immediate increase of optical depth by f*y1 (with some coefficient f). This is the water vapor feedback. From now on attention is restricted to the supposed linear regime around the equilibrium state defined above, so only anomalies are dealt with. Let x be the IR optical depth anomaly due to GHGs other than H2O. We have two equations: s = Hy (1) y = f*y1/s1*s + x (2) From these we have s = (H-1-f*y1/s1)-1x = Gx (3) Let's switch to the frequency domain. The Fourier transform of H is H and w is angular frequency. In this case Hw = s1/y1/(1+j*t0*w) (4) If it is put back to (3) Gw = 1/(1-f)*s1/y1/(1+j*t1*w) (5) where t1 = t0/(1-f) is obtained. From this (by inverse Fourier transform) the response to a step function of magnitude x1 in GHG induced increase of IR optical depth is g(t) = 1/(1-f)*s1/x1*(1-e-t/t1) (6) Indeed, an amplification factor of 1/(1-f) is seen which is larger than one if 1 > f > 0. There is no runaway warming in this case. However, we also have this relaxation time thingy. Could anyone give an order-of-magnitude guess about how large it is supposed to be? Also, the assumptions going into the WV amplification theory are made explicit, so they can be scrutinized.
    0 0
  16. Dear John, nice piece of work, congratulations. Many things to say, but probably in next comments. One concerns the point: "To argue that the 5% that is poorly understood disproves the 95% that is well understood betrays an incorrect understanding of the nature of science." Well to be more accurate, you should say that even if 5% are poorly understood based on the uncertainties provided by the effects of aerosols these 5% do not preclude the conclusions obtained from the rest of 95%. Just to answer to criticisms like the one by oracle2world for instance which uses bad examples, but that the way usually people that are not scientists try to justify their thoughts.
    0 0
  17. Re 106-111 and humidity. Relative humidity is just that relative. To get to the root of the matter go with absolute humidity(g of water/g of dry air) and dewpoint(the temperature at which water condenses from the air in question). The term relative humidity was invented to explain why one might feel more comfortable on a warm dry day than on a slightly cooler but much more humid day. In order to get precipitation the air has to cool below the dewpoint. This might happen at 5,000 ft for cumulus clouds with high absolute humidity, or at 50,000 ft for cirrus clouds with low absolute humidity. Precip can happen at any altitude and any temperature, depending on conditions. That is why using a parameter to simulate it in a 200km grid box in a model is a dubious proposition at best. Trenberth's paper was very good. "The global energy budget is not closed." In other words we don't know where significant amounts of energy are going in the climate system. Per table #1, the residual is 30-100 Jx10^20 per year, which is in the range of the forcing attributed to GHG(~107 Jx 10^20/yr). It's also 1-3 times the total net positive imbalance in figure 4. I totally agree that long term, reliable measurements of the TOA radiation from a source such as the CERES satellite are needed. "A climate information systrem that first determines what is taking place and then establishes why is better able to provide a sound basis for making predictions and (sic)which can answer important questions such as 'Has global warming really slowed or not'". I agree 100%. Until we have real, reliable, accurate measurements of the TOA radiation we don't know sXXX.
    0 0
  18. Riccardo (99): Do Santer et al say the opposite of what I claim? This is their closing remark: “We may never completely reconcile the divergent observational estimates of temperature changes in the tropical troposphere. We lack the unimpeachable observational records necessary for this task. The large structural uncertainties in observations hamper our ability to determine how well models simulate the tropospheric temperature changes that actually occurred over the satellite era. A truly definitive answer to this question may be difficult to obtain. Nevertheless, if structural uncertainties in observations and models are fully accounted for, a partial resolution of the long-standing ‘differential warming’ problem has now been achieved. The lessons learned from studying this problem can and should be applied towards the improvement of existing climate monitoring systems, so that future model evaluation studies are less sensitive to observational ambiguity.” Translated into normal language: ‘Sorry, we could not find the hot spot, that was predicted by the models. Our data are too ambiguous. Maybe in the future, we will have better observations to test our models.” On the other hand, Santer et al show, that Douglass’ claim is wrong, that he proved that the hot spot does not exist. Douglass has not yet got the opportunity to contradict this. These together show my point: that the science on this issue is not settled. Chris (105) “…Since paleoanalysis indicates that the warming of the last 30 years is exceptional at least in the context of the last millennium and likely last two millennia…”: We all know, that this claim is highly controversial. The use of carefully selected high quality treering data for the reconstruction of the temperature in the past two millennia is very tricky. There is no need to figure that out in this posting. Craig Loehle has shown, on the basis of non-treering proxies, that the present warm period is not exceptional (Energy & Environment 18(2007), 1049-1053). But the IPCC-figure 1 in Box 6.4 (AR4, page 468) does not justify this claim either, given the fact, that the post-1960 data have been replaced by thermometer measurements (the famous ‘divergence’ problem). My point was, that the science on this issue is not settled, and that remains true. Chris (105): “…ocean current contributions to 20th century warming indicates that these have made close to zero net contribution to warming over the last 100 years…” OK, you have a point. There is a clear correlation between the ups and downs of the ocean currents and the global temperature and the net effect of this multidecadal oscillation is about zero. The oscillation is superposed on a slow rise in temperature by 0.5 degrees per century, that the earth experiences since 1800. Whether that warming is related to CO2 is not settled. The warming in the last 30 years was probably the up going phase of the oscillation. You may know the clear analysis of Akasofu of these cycles (http://people.iarc.uaf.edu/~sakasofu/pdf/two_natural_components_recent_climate_change.pdf). My point is not that Akasofu tells the ultimate story, but only, that the science on this issue is not settled. So, to return to John’s question: does less understanding on one issue invalidate better understanding on other issues? Of course not. But the most important issue has not been settled: will cutting our CO2-emmissions have any effect on the global climate? We don’t know.
    0 0
  19. fydijkstra at 18:44 PM on 8 April, 2010 Your two examples illustrate the problem with ignoring the science, and then pretending therefore that we don't know what we do know! Craig Loehle hasn't shown what you suggest at all. He showed that if one selects a small sample of poorly appropriate records, and then misunderstands the convention for scaling these to a common date, that one can get into a mess regarding analysis of paleotemperature. You might have noticed that Loehle issued a correction to his first paper, a major blunder of which was misunderstanding that "BP" in paleoanalysis doesn't mean P = present (since the "present" is remorslessely advancing year on year), but refers to 1950 by convention. So even within Loehle's rather deficient analysis, he showed that the MWP might have been around as warm as the mid 20th century in the Northern Hemisphere. His analysis completely misses out the large warming since the mid-20th century. . Since that time we've had an anomalous warming in the NH of around 0.7 oC under conditions that there has been no solar contribution, and the volcanic activity has been quite significant. The evidence (even Loehle's) indicates that were now very likely a good bit warmer than the MWP. But why peruse non-science magazines for your information?; you're bound to misunderstand the nature of scientific knowledge if you don't address the science. If you are interested in paleoproxyanalysis of temperature without recourse to tree ring studies, it makes much more sense to look at the properly peer-reviewed science. This supports the conclusion that if one analyses paleoproxydata, eliminating tree-ring data sets, that the late 20th century and contemporary warming is anomalous in the context of the last millennium and more. And why go to some stuff that someone posted on the web to address the question of warming since the LIA and ocean circulation effects when this can be addressed by looking at the properly peer-reviewed science. This shows that the contribution of “natural oscillations” to the warming of the last 30 years was likely negligible. One can create the impression of uncertainty by basing one’s information on stuff from dodgy sources that are designed to confuse the issue (and that we know are incorrect). But if we’re really interested in these issues one really should address the science.
    0 0

Prev  1  2  3  

You need to be logged in to post a comment. Login via the left margin or if you're new, register here.


The Consensus Project Website

THE ESCALATOR

(free to republish)


© Copyright 2024 John Cook
Home | Translations | About Us | Privacy | Contact Us