Climate Science Glossary

Term Lookup

Enter a term in the search box to find its definition.

Settings

Use the controls in the far right panel to increase or decrease the number of terms automatically displayed (or to completely turn that feature off).

Term Lookup

Settings


All IPCC definitions taken from Climate Change 2007: The Physical Science Basis. Working Group I Contribution to the Fourth Assessment Report of the Intergovernmental Panel on Climate Change, Annex I, Glossary, pp. 941-954. Cambridge University Press.

Home Arguments Software Resources Comments The Consensus Project Translations About Support

Bluesky Facebook LinkedIn Mastodon MeWe

Twitter YouTube RSS Posts RSS Comments Email Subscribe


Climate's changed before
It's the sun
It's not bad
There is no consensus
It's cooling
Models are unreliable
Temp record is unreliable
Animals and plants can adapt
It hasn't warmed since 1998
Antarctica is gaining ice
View All Arguments...


Username
Password
New? Register here
Forgot your password?

Latest Posts

Archives

Skeptical Science now an iPhone app

Posted on 10 February 2010 by John Cook

Skeptical Science available on Itunes Iphone App Store With Tim Lambert debating Christopher Monckton this Friday, there's been no shortage of debating suggestions. One interesting idea was for audience members to have skepticalscience.com on their mobiles. Coincidentally, Skeptical Science has just become available today as an iPhone or iPod app. The app lets you use an iPhone or iPod to view the entire list of skeptic arguments as well as (more importantly) what the science says on each argument. To download the app, go to http://itunes.com/apps/skepticalscience

How it happened was a few months ago, I was contacted by Shine Technologies, a software development company from Melbourne, Australia. The owners of the company are passionate about climate change and were interested in getting the science from Skeptical Science onto mobile phones. This is a good idea for two reasons. Firstly, because now more than ever it's imperative that the climate debate focuses on science so the more readily available the science, the better. Secondly, well, an iPhone app is pretty cool.

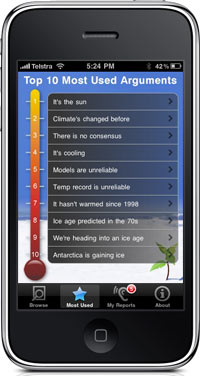
So for the last few months, the boffins at Shine have been developing the app with Apple approving it today. How does it work? You browse arguments via the Top 10 most used arguments as well as 3 main categories ("It's not happening", "It's not us", "It's not bad"):
   

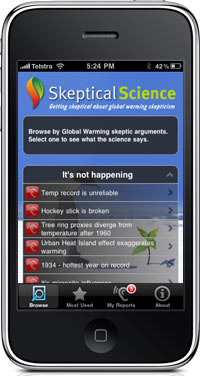
When you select one of the 3 main categories, a list of sub-categories pop up. You can then select any category to see the skeptic argument, a summary of what the science says and the full answer including graphs plus links to papers or other sources.
   

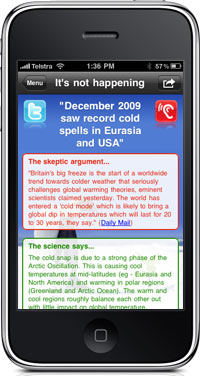
A novel inclusion is a feature that lets you report when you encounter a skeptic argument. By clicking on the red ear icon (above left, shown to the left of the skeptic arguments or above right, next to the headline), the iPhone adds another hit to that particular skeptic argument. At the moment, which arguments you report are only available in a My Reports page, shown below. Shine Tech are hoping to play around with the Reports meta-data in future versions of the app - the phrase "heat-map" gets mentioned often.

So if you have an iPhone or iPod, be sure to download the app and post any feedback or suggestions here. If you have friends with iPhones, be sure to let them know of the app. The more people use the app, hopefully the more versions will be developed in the future with snazzy extra features. If anyone encounters any technical problems with the app, please let me know.

UPDATE 11 Feb 2010: Thanks for the feedback so far (I've passed it onto Shine Tech who I'm sure will be reading this thread also). One other thing I forgot to ask - for those who are able to use the app, please be sure to post a review on iTunes :-)

About Shine Technologies
Shine Technologies is the developer responsible for the Skeptical Science iPhone application. They are a boutique IT consultancy based in Melbourne, Australia with a passion for excellence. They have donated their time to build and maintain the Skeptical Science iPhone application as they believe the science is the key to understanding global warming; and that more people need to have easy access to that science.

0 0

Printable Version  |  Link to this page

Comments

1  2  3  Next

Comments 1 to 50 out of 133:

  1. John, this post could have begun "There is a dramatic hot spell sweeping across Australia" (44oC in Melbourne yesterday for example). A major tool of deniers has been to exploit the shift in seasons. "Hot in the northern hemisphere in July? Well, yes, it's Summer, whaddya expect, besides, it's cold in Australia". "Hot in Australia in January? Well, yes,it's Summer, whaddya expect, besides, it's cold in Europe." Seasonal variation is a gift that has kept on giving to deniers for many years.
    0 0
  2. "After taking a broader look at global temperature, Pielke is forced to conclude that it's preferable to focus on small pieces of the puzzle than the bigger picture. Better that is, if the global picture isn't giving you the result you're looking for." Ouch! A well-deserved slam. The quality of comments by Pielke Sr. has deteriorated significantly in recent years. Note the clever rhetoric: "...a global average is not of much use in describing weather that all of us experience." He then criticizes a media report for focusing on the global average. Yet the article he's referring to is discussing global climate change, not regional weather. Does Pielke understand the difference? He also throws out the "if we can't predict the weather..." argument: http://www.skepticalscience.com/weather-forecasts-vs-climate-models-predictions.htm
    0 0
  3. Pieleke has lost it. Honestly, he is now getting truly desperate. What those data demonstrate is that the AO and NAO are reginal internal climate modes which do not teleconnect globally. I do not understand the confusion. Global warming refers to the increase with time (on a decadal time scale) of the global mean temperature. These internal climate modes can increase or suppress the global anomalies, but typically on for short periods of time. The UAH mid-trop temp anomlay in December was +0.28 C. That is the globe was warmer than average for this time of the year. I undertsand it is difficult for people in portions of Europe or the Southeastern USA to grasp that, but that is the reality. Global warming does not equal warming everywhere all the time. Someone needs to tell Pielke Jnr that. What is truly sad is that he should know better. What is true concerning regional impacts of AGW is that certain regions will warm more than others. For exmaple, the Antarctic Peninsula, the Arctic, Australia etc, and yes warming over the high regions is of concern b/c of posirive feedbacks which could reinforce the long term warming trends observed there. This is clearly evident over the Arctic.
    0 0
  4. Even before I knew about the warm spot over the Arctic & Greenland, I still felt that the cold snap neither proved-nor disproved-that global warming was over. After all, most of the Northern Hemisphere had significantly above average temperatures for the Spring & Summer of 2009. Here in Australia, we had the 2nd warmest winter on record (& the warmest August on record) & November temperatures for much of Southern Australia were *TEN DEGREES* above the long-term average! December & January have also proven warmer than the long-term average to date-giving us 3 months on the trot of well above average temperatures. Several years in a row we've had heat-waves (several days of above 36 degrees) as late as March. Now individually, none of these things *prove* anything, but taken together they definitely suggest that global warming is *far from over*. Yet its funny how many denialists here in Australia will blissfully dismiss our increasingly frequent heat-waves, yet point to a single month of cold weather in Europe as "definitive proof" that Global Warming is over! Thank you, John, for putting this unusual phenomenon into perspective!
    0 0
  5. Marcus, I think you might have a different opinion about the cold spot if you were sitting through it! Internet chat and even stuff I've overheard in pubs suggests a lot of public opinion thinks this snow shows the end of global warming or even the beginning of a new ice age. Example posts from the dailymail.co.uk's forum include: 'Climate Change, What a joke', 'the breached hull of the global warming ship', 'Could we be in for 30 years of global COOLING?'. Admittedly a number of these are from people who fall close to the 'denier' category because they refuse to accept science as it's all a watermelon socialist plot (unless it says something they want to believe, of course). In terms of science, what's going on makes sense. In terms of people's perceptions, it's potentially a PR disaster that the fossil fuel industry has won over logic. Also, in case you didn't see, I left a link to and quick explanation of the RSS satellite data in the DIY thread. :)
    0 0
  6. Article says... "On the other hand, Greenland, eastern Siberia and the Arctic ocean are experiencing unusual warmth." Weather forcast, Ilulissat, Greenland http://www.wunderground.com/global/stations/04221.html Tue, high -1, low -10 C Wed, high -6, low -25 C Thu, high -19, low -28 C Fri, high -17, low -18 C Sat, high -16, low -29 C The north pole this time of year is in complete darkness.
    0 0
  7. A very informative piece. It might be worth re-running an updated version of it once data for January 2010 is in. As far as the UK is concerned it's really since New Year that the worst of the weather has arrived. I heard from a friend in Greece recently, where typical early January temperature highs are about 12C degrees. The other day it reached 22C.
    0 0
  8. I've seen similar things in Weather Underground Phillip. Everywhere around the Mediterranean is experiencing temperatures well above the average for this time of year. The cold snap is an entirely localized event. Also, this cold snap hasn't even lasted an entire month, wheras the above-average temperatures which occurred in Spring & Summer lasted a good 3-4 months, just as the above average temperatures in the S. Hemisphere have been going on for months. Also, don't forget that the temperatures endured by Europe & North America are not the coldest of all time, but simply the coldest since the 1980's-that's record territory, but not record-shattering territory-that title belongs to Adelaide's 40+ degree weather in November-a month most frequently known for temperatures in the early to mid 20's.
    0 0
  9. So what's your point RSVP? You're not suggesting the December satellite data is a *lie* are you?
    0 0
  10. I think this weather pattern is in large part due to global warming. In Northern Europe, we have had the western winds "missing" us for about one month now, they are going south of us or north of us, where temeratures are 7-10 C above normal. - And it's not the first time for this to happen in recent decades. Because of its stability this does in fact produce some cold records - very little in single measurements (the troposphere is way too hot for that), but in cold periods. And because of the reduced diurnal variation, daily mean temperatures are extremely low - some 15-20 C below recent years' Dec/Jan average many places.
    0 0
  11. RSVP posts ... ""On the other hand, Greenland, eastern Siberia and the Arctic ocean are experiencing unusual warmth." Weather forcast, Ilulissat, Greenland http://www.wunderground.com/global/stations/04221.html Tue, high -1, low -10 C Wed, high -6, low -25 C Thu, high -19, low -28 C Fri, high -17, low -18 C Sat, high -16, low -29 C" Hmmm, OK, the cold is returning to Greenland, meanwhile warmer than average temperature has temporarily returned to Denver, Colorado. Temps in Boston will rebound and be above normal by Friday. And in Madrid, temps are bumping up by several degrees C. Gee, RSVP, when the cold air gets pushed south, places like Greenland are warmer than normal. Now the huge high apparently is breaking down, cold temps are returning up there, and warmer weather is appearing in the south. Gosh geewillikers. Some ice age!
    0 0
  12. Marcus, I assume the data is accurate, however, I thought it might help to get an idea of what "unusualy warmth" is like in Greenland. As far as "anomalies", you might note how much the temperature fluctuates in this region just from one day to the next.
    0 0
  13. dhogaza #11 You copied and pasted my post inaccurately, misrepresenting my post, which refers to a statement in the article. No problem really. :)
    0 0
  14. Since Pielke's position is at issue here, I think it would be fair to mention his main point which he lays out here(from the above linked post): "The obvious response to these claims is that if we cannot predict weather features such as the Arctic oscillation or an El Niño under current climate, how can anyone credibly claim we have predictive skill decades into the future from both natural and human caused climate forcings? The short answer is that they cannot." His point was not that the Earth has stopped warming, but that we cannot reliably predict what warming will happen in the future. Cheers, :)
    0 0
  15. We've been having a rather warm winter here in Southern California. So far.
    0 0
  16. That (Pielke's) is a specious "argument" shawnhet. If one inspects the science in which these issues are described, it's pretty obvious that the effects of El Nino's/La Nina's (especially) and ocean circulation changes like the Arctic oscillation result in modulation of the warming, which has little effect on the long term warming trends [*]. It is the latter that are likely rather well predictable, and important for consideration of impacts from largescale augmenting of the earth's greenhouse effect. Pielke's is the same tired argument that "one can't possibly predict the consequences of greenhouse release on future climate if we can't even predict the weather a few weeks in advance". To invoke El Nino's as a flaw in our predictive ability of climate consequences of greenhouse enhncement is pretty pathetic....and to similalry invoke short term modulation of surface temperature by ocean circulation effects, which seem to average out to near zero on meaningful timescales (much as we should expect), isn't much better. [*] For example Swanson and Tsonis (much cited by those who wish to use similar specious "arguments" to downplay likely consequences of mssive greenhouse gas release), have analyzed the contribution of ocean circulation changes to 20th century warming and concluded that their nett contribution is near zero [**] Likewise Keenleyside and Latif (also widely misrepresented to support specious "arguments" about supposed cessation of warming) predict an extremely marked warming over the next 10-15 years [**]. [**] K. L. Swanson, G. Sugihara and A. A. Tsonis Long-term natural variability and 20th century climate change http://www.pnas.org/content/106/38/16120.abstract N. S. Keenlyside, M. Latif et al. (2008) Advancing decadal-scale climate prediction in the North Atlantic sector Nature 453, 84-88 http://www.nature.com/nature/journal/v453/n7191/abs/nature06921.html
    0 0
  17. "The obvious response to these claims is that if we cannot predict weather features such as the Arctic oscillation or an El Niño under current climate, how can anyone credibly claim we have predictive skill six months into the future from both natural and human caused climate forcings? The short answer is that they cannot." His point was not that the Earth has stopped warming, but that we cannot reliably predict what warming will happen in the future.
    I've changed Pielke's statement in a way that should make the falseness of it obvious. The fact that we can't predict near-term weather with great accuracy says nothing about our ability to make sound predictions on other time scales. Average July temps will be warmer than average January temps in Portland, Oregon. Our understanding of the fact that natural forcings on this timescale far exceeds any change due to anthropomorphic causes, and that we know how those natural forcings change, allows me to make this claim. If you believe Pielke's claim is correct, I am willing to make a wager on it.
    0 0
  18. How many times must it be said, in how many different way? With 6.5 billion persons on the planet, probably a few million different ways. Weather is more difficult to predict than climate. How so? For commuters: We accept that our daily commute might involve different delays at different places on different days but we know that we'll generally arrive at our destination more or less within a certain window of time. Climate change is a variation on the same boring routine. Arrival at a commute destination is governed by -average- speed, arrival at a certain future climate regime is governed by -average- energy input versus loss. It's just not that complicated to reason out, unless somebody is constantly trying to confuse readers, that is. Shame on Pielke; he should hand in his sheepskin.
    0 0
  19. "That (Pielke's) is a specious "argument" shawnhet. If one inspects the science in which these issues are described, it's pretty obvious that the effects of El Nino's/La Nina's (especially) and ocean circulation changes like the Arctic oscillation result in modulation of the warming, which has little effect on the long term warming trends [*]. It is the latter that are likely rather well predictable, and important for consideration of impacts from largescale augmenting of the earth's greenhouse effect." It may be pretty obvious to you, Chris, but that doesn't mean it is accurate. If one plots the PDO index against the temperature one gets a very good correlation for as long as we have had decent records. Yes, it is possible that there are other explanations for this besides the fact that the PDO has a strong influence on climate, but they have not yet been established. IAC, my point here was not to defend this position in detail, but rather to correct the impression that Pielke was arguing that warming had stopped. Cheers, :)
    0 0
    Response: Some of the later comments address this issue thoroughly but for the record, we look at the correlation between the PDO and global temperature here...
  20. Well said Doug-that's exactly why they average the temperatures over a 30-31 day basis, then over a 20-year basis, because that helps to smooth out the irregularities from the odd extremely hot or extremely cold day. Its worth pointing out that-according to the Met Office-average UK temperatures for Winter 08/09, Spring 09, Summer 09 & Autumn 09 were all between 0.6 & 1.5 degrees warmer than the 1971-2000 mean http://www.metoffice.gov.uk/climate/uk/2008/winter.html http://www.metoffice.gov.uk/climate/uk/2009/spring.html http://www.metoffice.gov.uk/climate/uk/2009/summer.html http://www.metoffice.gov.uk/climate/uk/2009/autumn.html which is why I find it odd that people are so focussed on the extreme cold of the last 30-odd days, whilst happily ignoring the fact that the UK spent the bulk of the remaining 13 months with temperatures that were well above average!
    0 0
  21. re #19.....Inspection of the temporal evolution of the PDO yields exactly the interpretation that Tsonis and Swanson and Keenleyside and Latif etc. are making, namely that ocean oscillations might have small modulating effects on the temporal evolution of surface temperature under enhanced greenhouse forcing, but have close to zero contribution to the long term trend which is dominated by the enhanced forcing (long term being the multi-decadal timescale of relevance to the consequences of enhanced greenhouse forcing). If you inspect the PDO for example (Wikipedia has a decent short account): http://en.wikipedia.org/wiki/Pacific_decadal_oscillation it's obvious that the value of the PDO index now is essentially the same as it was in 1900 (or 1800 or 1700 for that matter). How can a phenomenon that has a low amplitude oscillation around an essentially constant value make a significant contribution to a long term trend? And that's exactly what Tsonis and Swanson, who have examined this contribution to the surface temperature evolution over the 20th century, have found (see citation/and link to abstract in my post #16 above). The ocean oscillations and other natural contributions slightly enhance the externally forced warming trend during some periods and slightly oppose it during others. But overall the contribution to the long term warming trend is close to zero. As Swanson et al state:
    "Removal of that hidden variability from the actual observed global mean surface temperature record delineates the externally forced climate signal, which is monotonic, accelerating warming during the 20th century."
    ...("hidden variability" being the natural variation including ocean oscillations), and they conclude that the nett contribution of these effects to 20th century warming is as close to zero as makes no difference (perhaps 0.03 oC). That's the scientific basis on which Pielke's comment that you posted is specious. We know that there is internal variability in the climate system. That obviously makes short term (mulityearly, decadal) prediction difficult. But these oscillations sum to something close to zero, and so our predictions of enhanced greenhouse-forcing-induced warming in the long term aren't very much affected by these small amplitude oscillations.
    0 0
  22. Yes, it is possible that there are other explanations for this besides the fact that the PDO has a strong influence on climate, but they have not yet been established.
    No, you don't get a good correlation, because the PDO plot shows no trend. It's just shifting energy around. While global temps do - an upward trend. Thus Chris's comment stating that such phenomena *modulate* the warming trend, rather than cause it.
    0 0
  23. Chris, what is the average PDO index for the period btw 1910 and 1945? Btw 1946 and 1976? Btw 1977 and 2007? As to how a value that fluctuates around a mean can add to the long term trend, that is easy - if the mean value is consistent with a long term natural warming from (let's say) the LIA, then the warmer PDO phase will cause an even greater warmer amount of natural warming. IOW, if a biproduct of the warming trend from the LIA(to pick one point) is a mean PDO value of 0, then there will still be an underlying natural trend. IAC, in those terms, I am not talking about the long-term trend, I am talking about the approximately 30-year trends, which have observably changed dramatically over the ~100 years. Cheers, :)
    0 0
  24. RSVP, sorry you post @6 does not mean much. 1), it is a wunderground forecast for one point (it is bad enough that people misunderstand regional variability), 2) The AO has been increasing steadily for a few days now, and as expected colder air is making its way back into the Greenland region. See here for observations and ensemble forecasts of AO and other teleconnection indices: http://www.cpc.ncep.noaa.gov/products/precip/CWlink/daily_ao_index/ao.shtml Medium-range ensembles suggest a return to neutral AO around 23 January, with hints of a drop again thereafter, but nothing like we just had. NAO looks to return to be neutral or slightly negative, so western Europe should see milder air moving in again soon (it has already started to some degree). Global NAEFS forecasts still show large areas with above average temps. in the coming two weeks-- there is a big world out there that many of us are completely ignorant of that fact, even though we have the internet: http://www.weatheroffice.gc.ca/ensemble/naefs/semaine2_combinee_e.html Let us not make the mistake of saying "Oh, I am in Adelaide and it is +37C, so AGW is real" or "I am in Poland and it is abnormally cold, so AGW is a hoax". One has to look at the global mean temperature anomalies for extended periods of time to identify any statistically significant trends. These internal climate modes may modulate global temps to some degree, but they do not explain all the variance, not even close, and they certainly do not explain the increase in global temperatures. Some internal climate modes (such as ENSO) do teleconnect globally. However, impacts from the PDO, AO and NAO are almost exclusively regional in nature. Those in denial insist on looking for a silver bullet to absolve them of any responsibility and for them to defend maintaining the status quo. Internal climate modes may give some regions a break from the warming for short periods of time, while at other time sand regions they may enhance the background warming from higher GHGs. But that is about it IMHO. Marcus @20, Chris and dhogaza good points! PS: Here on the Canadian prairies we were 5 C above average in November, 6C below average in December and January will probably be 3-4C above average. These are huge swings in anomalies. If that example does not caution one of the follies of making deductions about global temperature trends using even monthly data from a tiny percentage of the planet's area, then nothing will.
    0 0
  25. John, I agree with Pielke Sr. I don't think that he is saying that globally things are not getting warmer. Actually, he says that they are. But where I think he is going with the regional look is that we can better identify the other forcings that are pushing that region. Like in my home province, we actually had a cooler then normal spring and summer. But the wierd thing was we had a heck of lot less rain. More sunshine, cooler temps. Yet right now, we are having about 2-4*C warmer winter then normal (but overall we were warmer in 09). Why are we at a lower end while Alaska is at a much higher divergence? In my opinion it has to do with our Pine Beetle killed forests. But maybe as the new growth of this vast amount of land regenerates in the next 15-30 years, we may experience a colder divergence. This then would be a regional anomoly. That would be good to know. You know?
    0 0
  26. Albatross, I understand what you're saying-as I've often said it myself-a single heat-wave or cold-snap proves *nothing*, either way. I was simply highlighting how the denialists will disparage heat waves, whilst being quick to cite cold-snaps-which makes them hypocrites in my books. I'm much more interested in the global average, over several decades, to tell me whether the planet is warming or not. I'm also more interested in the correlation between CO2 changes & temperature anomaly changes (which is a *very strong* 78% for the 1950-2009 period).
    0 0
  27. WOW! I find it hard to believe that R.P. Sr. is getting booted about on this site. He has both of his feet squarely in the pro side. The only thing that I have seen that he is different about is the cause of the warming. From what I have read on his site, he doesn't argue against CO2, he just thinks that there are other causes, that regionally have as much of an effect as CO2. All of them man made! Overall CO2 may be the driver, but you dont think that when we rip up hundreds/thousands of acres of grasslands/forests et al to put in urban sites that it doesn't add to the positive trend in temps? He may be an outlier, but for God sakes, he is not a denialist!
    0 0
  28. To anyone who knows... Parking the question of global warming for one second, and considering that local climates tend to have different behaviors, when comparing anomalous temperatures around the entire Artic Circle, does this refer to a change in the statistical variance of a region, or simply deviation from the statistical mean? Thanks in advance.
    0 0
  29. JMA have a weekly anomaly map for Jan 5th to Jan 12th, slightly more relevant than the last week of December yet it paints a similar picture. Cold and hot areas haven't moved much http://ds.data.jma.go.jp/tcc/tcc/products/climate/synop.html
    0 0
  30. Macha, CO2 is a driver, this is well understood. Also, you need to consider what we did to the stratospheric ozone above Antarctica by producing CFCs which are measured in parts per trillion, versus parts per million for CO2. Not a perfect analogy, but it at least addresses the myth that CO2 concentrations are "so low that they can have no impact". I do agree with you that that climate models need to deal with convection better. That is touch, b/c one need a horizontal grid spacing <4 km, ideally <2 km to have explicit convection in a model. Very recently this has become possible for for some operational weather forecasting models run over sub-domains, but we are not even close for AOGCMs. The AOGCM runs do allow for variable insolation. Leo G, I used to think that Pielke Snr was not a denialist, but his very peculiar behaviour of late has my alarm bells going off-- just peruse the posts on Pielke Jnr's blog, some of them are outright bizarre. So his son is clearly a lost cause. I still hold out some hope for his dad (I have one of his textbooks on my shelf here), it would be sad to lose Pielke Snr to the dark side. Yes, land use change can have important impacts on the mesoscale surface energy budget, but those changes (from deforestation for example, or other land use changes) do not explain what is going on globally in the mid trop and stratosphere, or the polar regions. It seems to be that the Pielkes are trying to find a silver bullet to absolve us from doing any thing and to rationalise maintaining the status quo; that or they are trying to muddy the waters for the same purpose.
    0 0
  31. Macha writes: I don't see the scientific evidence that shows how one molecule (CO2) per ~3,000 molecules of air can cause a catastrophy, less so when its 1 in ~80,000 (only the manmade CO2). [...] CO2 is a minor bit-player NOT a driver. We've increased the concentration of CO2 in the atmosphere by over 100 ppm, so that's 1 part in 10,000 not "1 part in ~80,000" and of course it's increasing every year. More to the point, small quantities of stuff can have large effects. One mg arsenic per 30,000 mg body mass will have a 50% probability of killing the organism that ingests it. Finally, there's plenty of evidence that CO2 in the atmosphere warms the planet and that adding CO2 will increase the global mean temperature. See other recent posts here: How do we know CO2 is causing warming? Are humans too insignificant to affect global climate? CO2 is not the only driver of climate If you browse the archives of this site, you'll find lots of good summaries of the peer-reviewed literature on this and other topics. Regards, Ned
    0 0
  32. John:"Response: Some of the later comments address this issue thoroughly but for the record, we look at the correlation between the PDO and global temperature here..." This is an interesting page that I hadn't seen before. However, it would've been much better if you'd posted the PDO index on the same graph as the forcing vs. temp. I think that you'd find that giving the PDO index a substantial forcing value will improve the fit quite a bit btw forcing and temp. Cheers, :)
    0 0
  33. shawnhet writes: "I think that you'd find that giving the PDO index a substantial forcing value will improve the fit quite a bit btw forcing and temp." Is there any physical basis for this? Do you have citations to any papers discussing why "PDO" should represent a large forcing on global climate? IMHO it's not uncommon for people who don't want to accept the idea of anthropogenic climate change to fall back on rather vague and unscientific suggestions about "oscillations" (be they PDO, AMO, or AO). PDO isn't really an "oscillation", it's just a numerical index that flips back and forth at irregular intervals and that doesn't seem to have a strong physical manifestation (compared to, say, ENSO). If we're going to posit that it plays an important role in modulating global climate, I for one would like to see some convincing evidence.
    0 0
  34. Ned:Is there any physical basis for this? Do you have citations to any papers discussing why "PDO" should represent a large forcing on global climate Well, you could look up the papers of that rabid anti-warmer Michael Mann whose tree-ring proxy studies have found a 60 or year cycle in temps consistent with the PDO ;) "PDO isn't really an "oscillation", it's just a numerical index that flips back and forth at irregular intervals and that doesn't seem to have a strong physical manifestation (compared to, say, ENSO). If we're going to posit that it plays an important role in modulating global climate, I for one would like to see some convincing evidence." ??? It flips back and forth, but isn't an oscillation? IAC, as I have said, pretty good evidence is plotting the correlation of temps vs. PDO. You may want to pay particular attention to the inflection points where a period with a rising temperature trend shifts to a falling one and vice versa. Ray Ladbury, meet the physics of turbulent systems, you two haven't met at all. Cheers, :)
    0 0
  35. Shawnhet, you wrote "I think that you'd find that giving the PDO index a substantial forcing value will improve the fit quite a bit btw forcing and temp." When I asked you for a physical justification of PDO as a "substantial forcing" of global climate, you said that Michael Mann's proxy studies show a "60 [] year cycle" that's "consistent with" the PDO. That's not very helpful, IMHO. First, I strongly doubt that Mann would agree with your characterization that PDO is a "substantial forcing". Second, you're blurring the distinction between correlation and causation. Suggesting that the PDO is a "substantial forcing" wrt global climate is not the same as suggesting that it's "correlated with" (or "consistent with" as you wrote) global climate. Thirdly, PDO ain't ENSO. How many "sixty year cycles" have we been through since the start of the global mean temp record? With all due respect, as far as I can tell, your "skepticism" is purely unidirectional. When it comes to claims for the existence of anthropogenic climate change, you're exceptionally skeptical. When it comes to claims that might question the existence of anthropogenic climate change, the skepticism all disappears. A true skeptic wouldn't promote the idea that a mysterious and poorly understood "PDO" is a substantial forcing of climate without strong evidence e.g. a clear physical basis or very strong empirical analysis.
    0 0
  36. "Well, you could look up the papers of that rabid anti-warmer Michael Mann whose tree-ring proxy studies have found a 60 or year cycle in temps consistent with the PDO ;)" You might want to run by your hypothesis by Dr. Mann, rather than assuming your interpretation of his work is correct. "IAC, as I have said, pretty good evidence is plotting the correlation of temps vs. PDO." Science is not based on finding correlations. There's a correlation between the Dow Jones and global mean temperature as well. Global warming causation solved! "You may want to pay particular attention to the inflection points where a period with a rising temperature trend shifts to a falling one and vice versa." PDO positive phases are associated with somewhat more and stronger el Ninos, and negative phases with somewhat more and stronger la Ninas and less el Ninos. So affect on the short-term trend (few years of transition between each phase) might be observed. RealClimate has a nice post on the topic that takes apart Roy Spencer's attempt to assign a more significant portion of warming to natural cycles. http://www.realclimate.org/index.php/archives/2008/05/how-to-cook-a-graph-in-three-easy-lessons/
    0 0
  37. I think you're misunderstanding or misinterpreting Mann’s work shawnhet. Let’s look at the question of the role of natural (ocean) “oscillations” to long term surface temperature trends from the point of view of Mann’s studies (focussing on relevant work from the last few years, since this is more likely to represent current scientific knowledge and Mann’s current views). I’d say the following points are supported by the scientific evidence; they’re all from Mann’s recent analyses. 1. There’s no doubt that historical measures/proxies of ocean indices (Nino/ENSO; PDO, NAO etc), shows that these indices undergo fluctuations that are associated at the first level with local changes in sea surface temperature (SST) (and at secondary levels with various local effects experienced on inhabited land surfaces, like temperature variations, rainfall and drought levels etc.). 2. Mann has published many examples of these. The general conclusions might be summarized as: a. These indices show variability but are neither periodic in the manner that might be meant by the term “oscillation” [see (b.)], nor do they contribute to long term temperature trends. Thus in Mann and Emanuel (2006) and Sabatelli and Mann (2007), measured and proxy values of El Nino and NAO indices expending back into the 19th century are presented and discussed. These don’t show any regular variation or trend; they’re fluctuations around a mean value. Might they contribute to long term temperature trends in the manner that you and Pielke suggest? Mann doesn’t think so [Mann and Emanuel (2006)]:
    “In short, there is no evidence that a natural climate oscillation contributes to long-term tropical North Atlantic SST variations.”
    b. What is the origin of ocean fluctuations? Might they be internal elements of the climate system that can periodically “pump up” (and cool down) the surface temperature in the manner you suggest? Or might they be responses to variations in external forcings? Mann’s analyses supports the latter interpretation. In his recent review of climate over the last 2000 years (Mann, 2007), he ascribes long term fluctuations in various ocean indices as the response to external forcings:
    “ The substantial cooling in large parts of Europe at the height of the conventionally defined European LIA during the late seventeenth and early eighteenth century appear to be related in large part to long-term variations in the NAO, discussed above, which in turn appear to have been associated (Figure 8) with a large-scale dynamical response of the climate system to natural radiative forcing by explosive volcanic activity (Shindell et al. 2003, 2004) and solar output (Shindell et al. 2001, 2003).”
    Likewise Mann ascribes variations in ENSO as a response to variations in external (volcanic/solar) forcing. In other words (according to Mann), changes in ocean fluctuations (that some seem to want to ascribe as internal “oscillations” of the climate system), likely aren’t internal oscillations at all, but responses to external forcing. c. Are changes in local SST as measured by various ocean “indices”, indications of global scale temperature variations? Mann doesn’t think so. In his recent review (Mann, 2007), he presents evidence, for example, that during the MWP and LIA, the warming (MWP) and cooling (LIA) in the high N latitudes, were associated with cooling (MWP) and warming (LIA) in the tropical Pacific:
    “The conclusion that the tropical Pacific appears to have been in a cold La Niña–like state during the MWP and a warm El Niño–like state during the LIA implies that surface temperature changes in the tropical Pacific may have offset extratropical temperature changes (where these periods were relatively warm and cold respectively), reducing the amplitude of global or hemispheric-mean temperature changes from what would be deduced based on extratropical proxy data alone.”
    In summary, Mann’s published analyses support the conclusions that: (i) Ocean SST fluctuations as indicated by various ocean “indices” don’t contribute to long term temperature trends in the manner you and Pielke suggest. (ii) Rather than being internal “oscillations” of the climate system that have significant “oscillatory” contributions to global surface temperature trends, local short and long term ocean fluctuations are likely largely a response to external forcing (solar, volcanic, and no doubt to anthropogenic greenhouse and aerosol forcing). (iii) When considered on a global scale local ocean fluctuations tend to cancel (as one might expect from the redistribution of ocean heat either due to internal or forced effects), and so these indices don’t indicate much of a contribution to global scale temperature trends. This is all pretty much consistent with the work by Tsonis, Swanson, Latif and Keenleyside cited in papers in my post above (see post #16), that ocean variations (in heat distribution) might modulate the surface temperature, but on the long (multidecadal scale) relevant to predicting the effects of massive enhancement of greenhouse gas concentrations on global surface temperature, these average to something close to zero, and thus (as Mann states explicitly) don’t have much of an effect on the temperature trend arising from an external forcing (like massive enhancement of greenhouse gas concentrations). M. E. Mann and K. A. Emanuel (2006) Atlantic Hurricane Trends Linked to Climate Change EOS 87, doi:10.1029/2006EO240001 M. E. Mann (2007) Climate Over the Past Two Millennia Annual Review of Earth and Planetary Sciences 35: 111-136 Sabbatelli TA and Mann ME (2007) The influence of climate state variables on Atlantic Tropical Cyclone occurrence rates J. Geophys. Res. 112, art #D17114
    0 0
  38. Here is the Mann paper in question: Observed and simulated multidecadal variability in the Northern Hemisphere T. L. Delworth1 and M. E. Mann2 Abstract  Analyses of proxy based reconstructions of surface temperatures during the past 330 years show the existence of a distinct oscillatory mode of variability with an approximate time scale of 70 years. This variability is also seen in instrumental records, although the oscillatory nature of the variability is difficult to assess due to the short length of the instrumental record. The spatial pattern of this variability is hemispheric or perhaps even global in scale, but with particular emphasis on the Atlantic region. Independent analyses of multicentury integrations of two versions of the GFDL coupled atmosphere-ocean model also show the existence of distinct multidecadal variability in the North Atlantic region which resembles the observed pattern. The model variability involves fluctuations in the intensity of the thermohaline circulation in the North Atlantic. It is our intent here to provide a direct comparison of the observed variability to that simulated in a coupled ocean-atmosphere model, making use of both existing instrumental analyses and newly available proxy based multi-century surface temperature estimates. The analyses demonstrate a substantial agreement between the simulated and observed patterns of multidecadal variability in sea surface temperature (SST) over the North Atlantic. There is much less agreement between the model and observations for sea level pressure. Seasonal analyses of the variability demonstrate that for both the model and observations SST appears to be the primary carrier of the multidecadal signal. http://www.springerlink.com/content/ght24jjem312qnh0/ Ned:"When I asked you for a physical justification of PDO as a "substantial forcing" of global climate, you said that Michael Mann's proxy studies show a "60 [] year cycle" that's "consistent with" the PDO." Well, frankly, the broad components of a physical mechanism isn't that hard to come by. PDO can affect ocean temps, precipitation, air pressure and (probably) cloudiness, and causes wide shifts in some biological markers as well. some combination of these factors could easily have climate effects. "Second, you're blurring the distinction between correlation and causation. Suggesting that the PDO is a "substantial forcing" wrt global climate is not the same as suggesting that it's "correlated with" (or "consistent with" as you wrote) global climate." I'm not sure what point you are trying to make here, but you asked for evidence that it was a substantial forcing and I pointed you in what was IMO the right direction. "Thirdly, PDO ain't ENSO. How many "sixty year cycles" have we been through since the start of the global mean temp record?" See Mann above. "With all due respect, as far as I can tell, your "skepticism" is purely unidirectional. When it comes to claims for the existence of anthropogenic climate change, you're exceptionally skeptical. When it comes to claims that might question the existence of anthropogenic climate change, the skepticism all disappears. A true skeptic wouldn't promote the idea that a mysterious and poorly understood "PDO" is a substantial forcing of climate without strong evidence e.g. a clear physical basis or very strong empirical analysis." It seems to me that someone who was a skeptic would look at the good correlation btw PDO and climate and say that there is a pretty good chance that whatever causes changes in the PDO index can also cause changes climate. He would not hand wave about it being mysterious or poorly understood, he would go about seeing what he can predict about climate using that idea. For the record, I have no disagreement with anthro warming effects, my disagreement is with the proposed magnitude of the anthro effect. On John Cook's PDO correlation page, he states that when the PDO last shifted towards cold as it seems to now, temps were 0.4C cooler. I don't have an issue with ascribing that entire 0.4C to anthro causes. Cheers, :)
    0 0
  39. Chris, as a non-scientist, can I pass on my appreciation of your clear, informed posts on this site. Thanks to John Cook also for providing such a valuable resource among the slosh of irrational and ignorant nonsense around the net.
    0 0
  40. shawnhet, 0.4 °C between the last two PDO shifts (1977 and 1998) means roghly 0.2 °C/decade of anthropogeic warming. I bet many others will agree.
    0 0
  41. Might have snow in the Aussie Alps this Sunday (my snowboard is itching). I'm waiting for an Andrew Bolt (check him out SS, he's a nutbag, writes for the Herald Sun) article claiming that coz it's snowing in Jan, GW/AGW is a sham!
    0 0
  42. Riccardo, FYI the last shift to a cooling PDO regime took place circa 1945, the shift in 1977 was to a warming regime. Cheers, :)
    0 0
  43. shawnhet, oh well, it's then 0.6 °C over 60 years, a "mere" 0.1 °C/decade. But it's quite a rough estimate. Taking a closer look and following your theory, i could fit the PDO index plus a trend to the temperature data through '85-'90 with a slope of just 0.07 °C/decade; from then, the fit becomes quite flat. The residual then represents a sudden jump in the antrhopogenic contribution with a trend of 0.18 °C/decade, a factor of about 2.5. This is what the "PDO theory" gives. In a few words, i got the same trend but shifting the onset of the so called "modern era AGW" 10-15 years ahead. It was nice playing with the numbers, but can anyone enlighten me on the meaning of this result? ;)
    0 0
  44. Riccardo, I don't follow what you've done above. What weight have you given to PDO index values? Cheers, :)
    0 0
  45. shawnhet, i just added the PDO index to a trend line. The PDO index was multiplied by 0.1.
    0 0
  46. doug_bostrom at 07:23 AM on 13 January, 2010: "Weather is more difficult to predict than climate" And climate prediction is more difficult to verify than weather prediction. It takes time. More than a lifetime, in fact, so any claim goes. This peculiarity makes weather prediction more difficult and somewhat riskier indeed.
    0 0
  47. The Arctic Oscillation Index is at a record low. Could this pattern be a result of the extreme sea-ice melt of recent years? If so, could Climate Change increse the risk of BOTH extreme Heatwaves and extreme Cold Snaps?
    0 0
  48. Berényi Péter at 10:44 AM on 16 January, 2010 "And climate prediction is more difficult to verify than weather prediction. It takes time. More than a lifetime..." Not really, unless one is trying to use a single type of measurement to do the verification. However, many measurements are available. When results from multiple independent climatic indicators are consistent with climate predictions, that's verification. If I predict a cold front, I can confirm my prediction by looking for wind, rain, a characteristic swing in barometric pressure as well as a temperature change. Observing some or all of these confirms my prediction to a greater or lesser extent. If I see only rain but no other weather effects, I might conclude that my prediction of a front was incorrect. If I see rain as well as a barometric pressure signature, I've done better with verification. If I see all of the diagnostics, I'm almost certainly correct in my prediction. The same deal applies to climate, but the signals are different. As it happens, we're seeing plenty of signals consistent with predictions of climate change. Temperature changes are actually becoming less important as a primary diagnostic of change, though of course the other changes we see won't happen without a change in temperature, just as we won't see all of the indicators of a cold front unless the front does indeed exist.
    0 0
  49. Dough, the very concept of climate does not even make sense in a shorter than let's say three decades time scale. You can look at as many indicators as you want, it does not make a difference.
    0 0
  50. My understanding of Roger Pielke's position is that he doesn't deny the human impact on climate. Rather that his interest is in how humanity can mitigate the effects of climate change. He roghtly puts humanity at centre stage and asks what will people need given the changing circumstances. This will need an assessment of the impact at the local level given the non-homogeneity of the changes. This approach seems to differ from much of the rest of climate science in asking "what can humanity do for the good of our future" rather than just "look at the mess we cause". Personnally I don't see a huge problem with his work.
    0 0

1  2  3  Next

You need to be logged in to post a comment. Login via the left margin or if you're new, register here.


The Consensus Project Website

THE ESCALATOR

(free to republish)


© Copyright 2024 John Cook
Home | Translations | About Us | Privacy | Contact Us