Climate Science Glossary

Term Lookup

Enter a term in the search box to find its definition.

Settings

Use the controls in the far right panel to increase or decrease the number of terms automatically displayed (or to completely turn that feature off).

Term Lookup

Settings


All IPCC definitions taken from Climate Change 2007: The Physical Science Basis. Working Group I Contribution to the Fourth Assessment Report of the Intergovernmental Panel on Climate Change, Annex I, Glossary, pp. 941-954. Cambridge University Press.

Home Arguments Software Resources Comments The Consensus Project Translations About Support

Bluesky Facebook LinkedIn Mastodon MeWe

Twitter YouTube RSS Posts RSS Comments Email Subscribe


Climate's changed before
It's the sun
It's not bad
There is no consensus
It's cooling
Models are unreliable
Temp record is unreliable
Animals and plants can adapt
It hasn't warmed since 1998
Antarctica is gaining ice
View All Arguments...


Username
Password
New? Register here
Forgot your password?

Latest Posts

Archives

What would happen if the sun fell to Maunder Minimum levels?

Posted on 19 February 2010 by John Cook

The sun's output is not static - it varies over a 11 year cycle and also shows long term changes. Currently, the sun is beginning to come out of a prolonged and deep solar minimum. This has led some to speculate that the sun might be entering a period of low solar activity similar to the Maunder Minimum in the late 17th century. At that time, the planet experienced markedly lower temperatures, particularly in the Northern Hemisphere. How would the Earth's climate respond if the sun did enter another Maunder Minimum? This answer is explored in a new paper On the Effect of a New Grand Minimum of Solar Activity on the Future Climate on Earth (Feulner & Rahmstorf 2010).
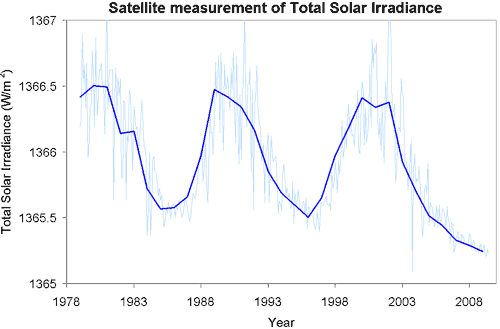
Total Solar Irradiance measured by satellite, PMOD reconstruction
Figure 1: Satellite measurements of Total Solar Irradiance (TSI), reconstructed by PMOD. Light blue thin line shows monthly values, dark blue thick line shows yearly averages.

The paper uses a fully coupled climate model to simulate what would happen if the sun fell to Maunder Minimum levels in the 21st Century. To include the effect of greenhouse gas emissions, they assume either A1B or A2 scenarios (IPCC TAR). A1B is a more optimistic scenario where carbon dioxide emissions continue to rise in the early 21st Century, stabilise mid-century then fall in the latter-21st Century. A2 is somewhat more pessimistic, projecting carbon dioxide emissions to continue growing throughout the 21st Century. To factor in the influence of volcanoes, 20th Century eruptions are randomly distributed over the 21st Century. This is necessary to avoid artificial drift of the model from an unnatural lack of volcanic forcing.

Two methods are used to determine how low total solar irradiance (TSI) fell during the Maunder Minimum. Ice core measurements of beryllium indicate a less variable TSI while modelling from solar magnetic flux show a greater decrease in TSI during the Maunder Minimum. To check whether the climate model accurately responds to solar forcing, global temperature was modelled over past periods of Grand Minima such as the Maunder and Dalton Minima. The TSI reconstruction with lower variation shows excellent agreement with reconstructed past temperatures while the model results from the more variable TSI give cooler results. This suggests the TSI reconstruction with less variability is more accurate although both reconstructions are still used.

Three solar scenarios are modelled. One repeats the last 11-year solar cycle until 2100 (eg - no long term change in solar activity). The other scenarios involve the sun entering a new Grand Minimum using the TSI reconstructions with less and greater variation. The results are shown in Figure 2. The magenta lines are for the A2 emission scenario, the red line for the A1B scenario. The important feature is the comparison between the solid line (with no solar change) to the dotted and dashed lines (the two Maunder Minimum scenarios).
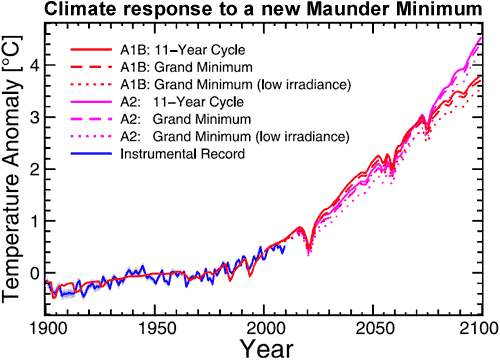

Figure 2: Global mean temperature anomalies 1900 to 2100 relative to the period 1961 to 1990 for the A1B (red lines) and A2 (magenta lines) scenarios and for three different solar forcings corresponding to a typical 11-year cycle (solid line) and to a new Grand Minimum with solar irradiance corresponding to recent reconstructions of Maunder-minimum irradiance (dashed line) and a lower irradiance (dotted line), respectively. Observed temperatures from NASA GISS until 2009 are also shown (blue line) (
Feulner 2010).

For both the A1B and A2 emission scenario, the effect of a Maunder Minimum on global temperature is minimal. The TSI reconstruction with lesser variation shows a decrease in global temperature of around 0.09°C while the stronger variation in solar forcing shows a difference of around 0.3°C. Compare this to global warming between 3.7°C (A1B scenario) to 4.5°C (A2 scenario). Considering the less variable solar reconstruction shows such strong agreement with past temperature, the authors conclude the most likely impact of a Maunder Minimum by 2100 would be a decrease in global temperature of 0.1°C . With all uncertainties taken into account, the estimated maximum decrease in global temperature is 0.3°C.

To understand why solar influence is so small, it's helpful to compare the radiative forcing from a cooling sun to the radiative forcing from anthropogenic greenhouse gases. The solid green cycle shows solar forcing with no long term change. The dashed green line is the change in solar forcing if we fall to Maunder Minimum levels using the TSI reconstruction with smaller variation. The dotted green line shows Maunder Minimum forcing from the TSI reconstruction with greater variation. The red and magenta lines show the forcing from anthropogenic greenhouse gases for the two different emission scenarios.
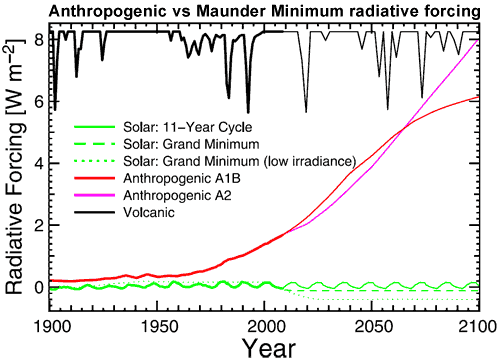

Figure 3: Radiative forcings used in the simulation experiments, with observed values until 2008 marked by thick lines. Volcanic radiative forcing (the downward spikes at the top of the graph) has been shifted by +8:25 W/m2 for clarity (Feulner 2010).

Both solar reconstructions show the weak forcing from solar changes compared to the forcing from anthropogenic greenhouse gases. It also bears reminding that any offset from a solar Grand Minimum would be temporary as past minima only lasted a few decades to a century. This means the impending ice age is still postponed indefinitely

0 0

Printable Version  |  Link to this page

Comments

1  2  3  Next

Comments 1 to 50 out of 104:

  1. 1. Analysis of solar activity in the Holocene (e.g. Solanki 2004, Usosskin 2007) shows that there is possible another scenario. Just as 5000 BCE to 4900 BCE (Older Peron) may wait for us being 2-3 thousand. years - warm period of with several small minima. 2. Changes in solar activity is not only the TSI, but gravity changes (LNO-LNC - effects on THC - it is really only a "ridiculous theories"?), and a system of climate feedbacks. Rahmstorf, Ganopolski, 2005: "We attribute the robust 1,470-year response time to the superposition of the two shorter cycles [87; 210 years], together with strongly NONLINEAR DYNAMICS and the long characteristic timescale of the thermohaline circulation." http://www.nipccreport.org/chapter5.html - "Solar Variability and Climate Cycles." - "The IPCC claims the radiative forcing due to changes in the solar output since 1750 is +0.12 Wm-2, an order of magnitude smaller than its estimated net anthropogenic forcing of +1.66 Wm-2. A large body of research suggests that the IPCC has got it backwards, that it is the sun's influence that is responsible for the lion's share of climate change during the past century and beyond." - "The role of solar activity in causing climate change is so complex that most theories of solar forcing must be considered to be as yet unproven." [...] We say: that without a proper assessment of the significance Millennium cycles, each evaluation of the impact of natural factors is incorrect. Claiming: that the Millennium cycles: How warms up to N - cooled on the S, is vague - "de facto" - false. 3. If current warming is (mostly) natural and we will have a transgression of the sea as the Older Peron (Australia - 2.5 to 4 meters - 8 to 13 feet) - whether it is worth spending money on CCS?
    0 0
  2. "The IPCC claims the radiative forcing due to changes in the solar output since 1750 is +0.12 Wm-2, an order of magnitude smaller than its estimated net anthropogenic forcing of +1.66 Wm-2. A large body of research suggests that the IPCC has got it backwards, that it is the sun's influence that is responsible for the lion's share of climate change during the past century and beyond." Given that the sun has been steady or in decline over the period of 1950 - 2010 - this surely indicates that temperature increases since then cannot be attributed to it. Given the substantial change in temperature currently do not correspond to changes in solar output I fail to see how such a conclusion can be drawn.
    0 0
  3. I was missing a paper like this, thanks for the summary! Fortunately it was already highlighted in this site that "The difference in solar radiative forcing between Maunder Minimum levels and current solar activity is estimated between 0.17 W/m2 (Wang 2005) to 0.23 W/m2 (Krivova 2007)", whereas "the radiative forcing of CO2 since pre-industrial times is 1.66 W/m2 (IPCC AR4), far outstripping solar influence."
    0 0
  4. Beginning - the end of the max. LIA - not equal: the beginning - the end of Mounder minimum. It was NEVER ("NONLINEAR DYNAMICS") a simple connection: TSI - global temperature. 1.66 W / m 2 - right, but the valuation of "CO2 feedbacks" in the IPCC AR4 - no (eg, Lindzen - I recall).
    0 0
  5. sory: not Mounder - of course Maunder
    0 0
  6. Moreover, in small changes in TSI can not be explained by such rapid temperature changes in the past - such as Dryas, LIA, MWA, etc. ...
    0 0
  7. Jesus, you cite a difference in solar forcing ranging from 0.17 to 0.23 W/m2. The TSI itself is estimated to have been some full 2 W/m2 lower in the Maunder Minimum(according to the Max Planck Institute). I'm sure I'm comparing apples to oranges here. Can you help me understand it?
    0 0
  8. Hi Alexandre The 2 W/m2 is the solar constant measured at the top of the atmosphere. This flux is through a circle of radius 6,371 km and an area of pi x r2 but the forcing is measured at the Earth's surface which has a surface area of 4 x pi x r2 so 2/4 = 0.5 W/m2. Then we further must take into account the solar energy which is reflected back into space without warming the planet or about 30%. That leaves 0.35 W/m2. How we get down to 0.17 to 0.23, I don't know but at least you see we are in the ballpark. Tony
    0 0
  9. @5 Yes but periods like the Dryas appear to have other influences, such as large influxes of melt water, the MWP is linked to North Atlantic oceanic circulation..... point is that these causes do not appear to be drivers of the current warming trend, nor do TSI levels, but anthropogenic co2 does appear to be correlated with it. Variation has occurred in the past from a number of different causes but unless one can be directly attributed to current observations raising seems somewhat immaterial.
    0 0
  10. #7 Alexandre, Wang 2005: "The increase in cycle-averaged TSI since the Maunder minimum is estimated to be ~1 W m-2." *Then we do what Tony Noerpel says: divide by 4 for the shape of a sphere and multiply by 0.7 to substract the 30 % albedo: 0.17 W/m2. Krivova 2007: "The model predicts an increase in the solar total irradiance since the Maunder minimum of 1.3^+0.2_-0.4 Wm-2" 1.3 / 4 * 0.7 = 0.23 Balmaceda (Max Plank Institute): "This first physics-based reconstruction of TSI back to the Maunder Minimum suggests an increase of about 0.80 W/m2 since 1700" 0.8/4*0.7 = 0.14 W/m2 (documents hyperlinked in the author's name)
    0 0
  11. Like so much in climate science, this just confirms things well known. A U.S. National Academy of Sciences panel estimated in 1994 that if solar radiation were to weaken as much as it had during the Maunder Minimum, the entire effect would be offset by another two decades of accumulation of greenhouse gases. That was at 1994 emission rates, of course; we now find, surprise, that at late 21st century emission rates the delay would be less than one decade. ref.: combining pp. 3 and 4 of National Research Council, Board on Global Change (1994). Solar Influences on Global Change. Washington, DC: National Academy Press (online at http://books.nap.edu/openbook.php?isbn=0309051487)
    0 0
  12. John, Thanks for this gem. I will adding it to my site today.
    0 0
  13. Spencer Weart, it's always invaluable to have it put in the correct perspective. Thank you a lot.
    0 0
  14. What's the point of this? If you have models that assume a very weak effect from changes in solar radiative forcing then you are going to get a result that suggests a MM will have a minor effect on the temp over the next century. Having developed theories that have minimised the LIA and MWP whats the point of doing this experiment?
    0 0
  15. The question I have is that if a grand minimum has an affect of between 0.09-0.3oC how was it possible to recognise the previous MM cold period. Would these be sufficient for people to recognise 1700 as a particularly cold period in history. Would this be sufficient to see the Thames freeze up and the other effects seen through Europe? As well as throwing away any significant cooling effect in the 21st C you also have to throw away the cooling effect around the MM.
    0 0
  16. @15, HumanityRules It is not about having "developed theories" here. It's about looking at the actual data. And the _very_ interesting thing is that the temperature variations in the not so distant past to a large degree seem to come from such _relatively small_ fluctuations in solar irradiation. The models do _not_ assume a very weak effect from solar changes, but they try to take all forcings into account, adequately quantified. And even if you can't simply equate solar and GHG forcings, their effects seem to be comparable.
    0 0
  17. Thanks Tony and Jesús. One of my mistakes was to neglect the cicles - hence my 2 W/m2 amplitude.
    0 0
  18. HumanityRules @ 15 IIRC (it is always possible I don't ;o), the models tell you of the effects of an increase in radiative forcing, whether the increase in radiative forcing is due to changes in solar activity or due to a rise in atmospheric CO2 concentrations doesn't make any difference. The change in radiative forcing due to increasing carbon and solar activity are relatively well understood, it is how the climate responds to the change in forcing that is uncertain. In other words the models don't assume a weak effect from solar radiative forcing, it is weak because the solar forcing is weak. However, I am no climate modeler, just MHO, ask an expert like Gavin Schmidt @ RealClimate
    0 0
  19. Hello HumanityRules Given the information provided by Jesus Rosino, we see that the solar forcing during the little ice age was between .14 and .23 W/m2. maybe that sounds small but that is over every single square meter of the Earth surface. So if we multiply by 4 X pi X (6371000) X (6371000) we get total power in joules/second. then by multiplying by 60 X 60 X 24 X 365 we can compute how many joules in each year of the MM that there was an energy imbalance. we get 3 X 10^21 joules each year. So that would explain the cold weather. but the interesting thing is that the energy imbalance today is about 1.8 W/m2 or about 6 times more intense. And that would be the problem. If I've made a math mistake, my appologies in advance. Tony
    0 0
  20. The oceans are huge heat reserves, aren't they? It is ocean currents, more than the air, that affects whole seasons of weather for any part of the world. Currents keep Europe warmer than it should be for it's latitude. The El Nino phenomenon is what has determined the cold weather this winter. All of the above are considered "weather" which is not the same as "climate". It is probably better that we not even use the word "climate", but to refer to, instead, the mean temperature of the earth's ocean's rising and the increasing reflectivity of the atmosphere. I think using the word "climate" has a weather connotation to the common ear. The danger we are facing is our increasing the heat energy we are storing inside our atmosphere and ocean. The more energy that is added, like to any closed system, the more changeable the currents and air streams are; the more ice melts and sea levels rise, the more turmoil and swell differences in the oceans, and the more variety in storm characteristics. All of these mean changes in where the rain falls, flooding some, making others into deserts, turning rainforests into savannas, changing what we can grow where, et cetera, et cetera. Here we will have multiple climate changes all over. If we look at the planet as a big system that is keeping more heat than it is giving up, then one can better imagine, based on high school level experiments in thermodynamics, what this phenomenon means for humanity. The "icing" on this terrible cake is the ocean becoming more acidic, which is certain to cause extinctions of vulnerable species (like our food fish). All this because a few "deniers" say that the laws of physics don't apply to the earth? that we "can't change" from coal and oil to nuclear, wind, geothermal, and solar? Considering that, if Edison had his way, we would have been all driving electric cars already. If Three Mile Island hadn't scared people away from nuclear, just think of where we would be in addressing this issue. If Carter had gotten his gas tax applied as the prices for gas were dropping, our cars would not be the monsters they are today.
    0 0
  21. "What would happen if the sun fell to Maunder Minimum levels?" It would get cold. Any questions?
    0 0
  22. Tony Noerpel #19 Surely the physics are the same in 1700's and 2100's. If a grand minimum produces a 0.09-0.3oC drop in 2100 then it does the same in 1700 no matter what the base position you are starting at. Given that, my question is, can the 1700's be recognised as a cold period of history with that level of change? If not then we have to get rid of the LIA from history. This just appears a circular argument. Having assumed in the model that solar has a negligible effect the scientist asks the question what is the effect of a Grand Minimum. No surprise when the answer comes back negligible. I also have another question. The implication in the articlet is that the LIA was a regional phenomenon. As far as I'm aware the sun shines down on the whole of the planet. How can it's effect be regional? And if there is a regional explanation how can any other forcing dodge this regionalism?
    0 0
  23. oracle2world writes: "What would happen if the sun fell to Maunder Minimum levels?" It would get cold. Any questions? You didn't actually read the post, did you? The whole point of this thread is that it probably wouldn't get particularly cold. As John said (in a turn of phrase that I find amusing) "the effect of a Maunder Minimum on global temperature is minimal".
    0 0
  24. Ok, I just a West Texas cowpuncher and have not had my question answered by you scientific guys. My question is at the end. For thousands of years wildfires burned up ba-zillions of acers grassland, forrest and brush annually. Where I live in West Texas we had a little grass fire one April day2006, that burned over a million acres and killed 12 people and thousands of beef cattle, some horses and untold wildlife. That was with scores of City Fire Depts, Rural Fire Depts, US Forrest Service, Ranch firefighting rigs, Interstate Highways, State Highways, County Roads, large parcles of cultivated land; all trying to frustrae and stop this fire. Before White European Settlement, fires like this kept our part of the world praires. Brush, TREES, Prickly Pear now cover the land. Once home to the Antelope and Buffalo now prime Whitetail Deer Habitat. Why did'nt all that co2 belched into the atmosphere in past history cause global warming?
    0 0
  25. HumanityRules writes: I also have another question. The implication in the articlet is that the LIA was a regional phenomenon. As far as I'm aware the sun shines down on the whole of the planet. How can it's effect be regional? And if there is a regional explanation how can any other forcing dodge this regionalism? Actually, due to the nature of feedbacks and the transfers of energy within the climate system, even a uniform global forcing won't produce uniform regional impacts. Thus, for example, anthropogenic CO2 becomes well-mixed in the atmosphere within a few years but the warming that results from it is very unevenly distributed (e.g., more warming in the arctic, and in the N hemisphere, and over land, etc.) Right?
    0 0
  26. Ranger writes: Why did'nt all that co2 belched into the atmosphere in past history cause global warming? As I understand it, you're pointing out that in the days before fire suppression (and still occasionally today) there were big wildfires in many places. Presumably those put a lot of CO2 into the atmosphere, right? So why didn't that cause global warming? If you think about it, you can't keep having fires unless stuff grows back between the fires to create the fuel load for ... more fires. In other words, in a pre-fossil-fuel time, the carbon added to the atmosphere by fires was then removed from the atmosphere by the regrowth of plants. What's different today is that instead of just cycling the same carbon through the system over and over again, we're injecting into the atmosphere a heck of a lot of fossil carbon that was laid down over a period of tens of millions of years.
    0 0
  27. Not to be the slightest bit pejorative, but Ranger has brought the brushfire matter up several times of late here, on several threads, and he has always received the same basic response without apparently acknowledging these answers. Ranger, would you mind responding to Ned's answer, just so we know you're reading the answers you're eliciting?
    0 0
  28. Ned , yes that is my question, but I still don't get it. I guess one could do the research to find out how much land burned every decade, say hundreds of years ago versus the tiny tiny fraction of land that burns today. So seems to me that historic fires produced as much co2 back then as burning fossil fuels do today. Plus if you consider that tonage wise, more cultivated crops produce much more plant matter than short grass praires would have. These crops like corn, milo, soybeans, Sudan Haygrazer.... would recycle much more carbon that grass does, plus the uncultivated land is still covered with plant life. I have spent more time outdoors horseback than most people have spent in their beds. I realize that since the the late 1980's the climate has got warmer. But I also see that in the last few years I have been colder. I also like to read, mostly History. History is full of antedotes down thru the centuries of the earth's tempature being hotter then colder. Thanks Albany, Texas
    0 0
  29. "So seems to me that historic fires produced as much co2 back then as burning fossil fuels do today. " Seems to you based on what, your guestimation? In fact, we know how much CO2 was in the atmosphere hundreds of years ago, and it was quite a bit less than there was today (see graph here http://www.skepticalscience.com/The-Dunning-Kruger-effect-and-the-climate-debate.html). If your theory that anthropogenic emissions were merely replacing those of wildfires, we wouldn't see the massive spike that we do. Beyond your folksy wisdom, there is no evidence to support the scenario you construct.
    0 0
  30. Ranger, think of it this way. Plants grow. They can be burnt, be eaten, or fall down and rot. All of those result in the carbon returning to the atmosphere ... to feed more plants. Before significant human intervention, the total amount of carbon in plants would remain roughly the same (different areas burn, suffer locust plagues, or whatever each year) on average over years. Thus the total amount of carbon in the air was also roughly the same over years. Even significant human agriculture and other land use changes have only had a relatively small effect on the total amount of carbon in plants at any given moment, although we may be cycling it in and out of plants faster. The thing that's causing the major change in atmospheric carbon dioxide is that we are taking carbon that was locked away for tens of millions of years as fossil fuels and burning those. The following article gives a good overview of the carbon cycle and particularly how much carbon is where (in plants, in the soil, in the air, in the ocean, etc.) That's table 1. http://www.eoearth.org/article/Carbon_cycle One part of the article is missing an important point though. The part that talks about "missing carbon" is wrong so far as I can tell, because there is no mention of ocean acidification. Currently, when humans add carbon to the biosphere by burning fossil fuels, it gets divided roughly in half - one half for the air, and one half for the oceans. Unfortunately this has the effect of reducing the pH of the oceans. This has now been measured as an average drop from ph 8.2 to 8.1. That may not seem like much, but if we keep going, it could cause mass extinctions.
    0 0
  31. Ranger, fossil fuels are highly concentrated forms of plant material. You'd have to burn a huge amount of grass, wood, or any other plant material, to get the same energy as a tiny amount of fossil fuel. That's a major reason we use fossil fuel. Think of fossil fuel as distilled plants. That distillation concentrates not just the energy from the plants, but also the carbon. In fact, the concentrated carbon is that concentrated energy, in the form of the chemical bonds that the carbon is involved in. So when a small amount of fossil fuel is burned, it releases both the huge amount of energy of the huge amount of plants, and as an inevitable result the correspondingly huge amount of carbon.
    0 0
  32. Humanity Rules. What you need to remember is that this modeling covers only 100 years. The Little Ice Age occurred over a multi-century time period (over 300 years IIRC). That's a long time for the negative energy imbalance to build up and cause *significant* cooling. That cooling event was offset by the return to "normal" TSI over the 250 year period up to 1950 (which gave a warming trend of around +0.06 degrees per decade). Since 1950, the sun has either been stable, or in a mild decline, yet warming trends are even *faster* than the previous 250 years.
    0 0
  33. @Ranger. Its called The Carbon Cycle for a reason. All the carbon which goes out is accounted for by Carbon sinks on land & sea (plants, soils, phytoplankton, direct ocean absorption). The only carbon not directly accounted for, IIRC, is from volcanoes & limestone erosion-both of which generate a tiny fraction of the CO2 generated by burning fossil fuels. The reason burning fossil fuels has such a massive impact on atmospheric CO2 levels is because they're fossilized trees which grew in an extremely CO2 rich (3000ppm +) environment several hundred million years ago (the aptly named Carboniferous Era). All plant & animal life alive today has existed in the "carbon constrained" environment of the Quaternary period, where CO2 levels have never exceeded 290ppm (they are now close to 400ppm). Hope that makes sense.
    0 0
  34. To follow up on Marcus's answer to HR: in addition to what he said, the solar forcing (slightly lower TSI) during the LIA was also reinforced by higher than average volcanic activity(*). Those two effects were global. It is also suspected, though far from proven, that ocean currents slowed down, strengthening the cooling in Europe and possibly a couple of other regions. So that's how the LIA was cold enough to be a hardship. (*) Volcanoes are a cooling forcing on human timescales because they inject reflective aerosols into the atmosphere. For example Mt. Pinatubo (June 1991): In 1992 and 1993, the average temperature in the Northern Hemisphere was reduced 0.5 to 0.6°C and the entire planet was cooled 0.4 to 0.5°C. The maximum reduction in global temperature occurred in August 1992 with a reduction of 0.73°C. However not much effect remained after 5 years or so. On really long timescales, large scale volcanism can warm the planet with CO2 emissions that outlast the aerosols by orders of magnitude. It is thought that there was a "snowball earth" scenario in the period 650 and 750 million years ago, and that volcanic CO2 was what ended the snowball state.
    0 0
  35. Speaking of the LIA ... just to stir up the pot a bit, Bill Ruddiman has proposed the interesting hypothesis that land use changes following plague outbreaks resulted in a drawdown of CO2 from the atmosphere that could have largely explained the LIA. Much of Europe and Asia were partially depopulated by plague outbreaks from the 1300s to the 1600s (Europe lost somewhere between a quarter and half of its population). Likewise, the introduction of diseases into the Americas killed tens of millions in this hemisphere from the late 1500s to the 1800s. Ruddiman's argument is that the reduction in agriculture and the reversal of land clearing (re-expansion of forests, etc.) during the 1300s-1700s would have temporarily removed enough CO2 from the atmosphere to have initiated the LIA. It's an interesting argument, though I know many scientists are skeptical. But if there's an element of truth to this, it would help explain how the LIA could be a bit more severe than one would expect from the relatively small solar forcing alone.
    0 0
  36. Here's another point though, GFW-the only case of true hardship I've heard of that was directly connected with the LIA was the loss of the Norse colony in Greenland-but that was mostly because the Norse were utterly inflexible in the face of changing conditions!
    0 0
  37. Wildfires, co2, carbon cycle. Just googled "wildfires co2". There sure seems to be a lot of concern, in some circles of the scientific community that wildfires are of concern to the amount of co2 in the atmosphere. I do not spend a lot of time on the computer but from what I did look at there seems to be a connection to different sorts of funding ie increased government funding for fire supression. We should not trust human nature and it lust for weath and power. When money and power are at stake, human beings are capable of great evils. With the amount of power and money at stake I am skeptical. Am I remembering right that in the 1970's greenhouse gasses were suppose to reflect the energy from the sun and caused a new ice age?
    0 0
  38. "Am I remembering right that in the 1970's greenhouse gasses were suppose to reflect the energy from the sun and caused a new ice age? " you might be remembering some media coverage, but not the science, which even in the 70s was more concerned with global warming than cooling: http://ams.allenpress.com/archive/1520-0477/89/9/pdf/i1520-0477-89-9-1325.pdf
    0 0
  39. Ranger writes: Just googled "wildfires co2". There sure seems to be a lot of concern, in some circles of the scientific community that wildfires are of concern to the amount of co2 in the atmosphere. Fires do add some CO2 to the atmosphere but before the arrival of humans on the scene this was balanced by the removal of CO2 as plants regrow following the fires. If you think about it, this has to happen -- otherwise the entire biosphere would be burned up and earth would be a desert. Over the course of the next century, the amount of CO2 from fires will be small compared to the amount from fossil fuels. We should not trust human nature and it lust for weath and power. When money and power are at stake, human beings are capable of great evils. With the amount of power and money at stake I am skeptical. Skeptical about what? That's not very clear. I assume you aren't saying that the people who are trying to raise concerns about climate change are motivated by money and power. Obviously, (a) most scientists could make a lot more money doing something else; (b) insofar as wealth and power have an effect on this, it comes from the opposite side (ExxonMobil etc. have infinitely more money and power than anybody on the must-stop-global-warming side). Am I remembering right that in the 1970's greenhouse gasses were suppose to reflect the energy from the sun and caused a new ice age? No, that's a misconception. See here: What 1970s science said about global cooling
    0 0
  40. On another board a commentator made the following claim: "the model assumes maximum water vapour amplification and minimum solar amplification" and "The model has been calibrated to recent temperature rise using a set of assumptions which have yet to be verified by adequate matching of predicted temperatures to actual temperatures, and that might take another 20 years." I couldn't access the paper, so could someone please answer the points above?
    0 0
  41. Turboblocke, it would be better if you provide full citation of the paper. Models do not assume any amplification not they are calibrated against recent temperature. Models are given the known physics and some parametrization for effects that can not be modeled from scratch. More on climate models here.
    0 0
  42. Ranger, please read the comment policy before complaining for deleted posts.
    0 0
  43. It is worth having a look on Leif Svalgaards research web site: I think he has also discussed the "original" Maunder minimum and possible scenarios of solar activity during it. http://www.leif.org/research/ Pertinent to the original title of the post, it seems we are now well on the way out of the solar minimum (not sure from above it would make much difference?). See: http://www.leif.org/research/TSI-SORCE-2008-now.png Also of more general interest is his "TSI (Reconstructions).xls" also on this page, along with many fascinating papers and presentations. One question is that if the early 20th century warming was not down to increasing solar activity, which appears quite likely from his and the more recent work illustrated neatly on his chart, then what other forcings (or more likely what combination of forcings) can be invoked, or do they need to be?
    0 0
  44. Ranger reasonably asks "Why did'nt all that co2 belched into the atmosphere in past history cause global warming?" 1) The amount of Co2 belched by those grass lands burning is a very small fraction of what we are belching by burning fossil fuels. 2) Those grasslands typically grow back (grasses are adapted to fires by the ability to grow from the base of the plant) - and when they do grow back they absorb just about the same amount of CO2 they belched out when they burned.
    0 0
  45. Ranger #37 The big concern with wildfires is those in the boreal forests and to some extent tropical forests. When burn rates outpace the rate of regrowth of forest, that CO2 stays in the atmosphere and further contributes to warming. This sets up a positive feedback that further warms and drys the forests and increases the burn rate and CO2 release. The 1970's reports on global cooling had nothing to do with the effect of greenhouse gases. In addition, there was very little scientific support for the idea. The media on the other hand treated it as a big story - scientists not in the least.
    0 0
  46. the authors conclude the most likely impact of a Maunder Minimum by 2100 would be a decrease in global temperature of 0.1°C
    I estimated this once based on the solar irradiance reconstruction from Lean (2000). What I came up with is 0.2°C. It's not very difficult. Assume emissivity and albedo are constant. If this is the case, absolute temperature is directly proportional to solar irradiance to the 1/4th power.
    0 0
  47. One other thing Ranger, remember that forest/grassland fires only have about 40-70% complete combustion. As opposed to say a good wood burning stove which can get to the 85% area. In a perfectly controlled burn scenario, most of the oxygen would combine with the carbon to form CO2. Natures own fertilizer. But in forest/grass fires, the combustion process is affected by variables that produce not only CO2 but CO. As well as NOx's, Butyls, etc. Our internal combustion technology attains a much higher percentage of complete combustion, then the open fires on ranges. Therefore they paradoxically produce more CO2! Also, perhaps the biggest thing that needs to be pointed out is that forest/grass fires are very "messy". They tend to throw a lot of soot and aresols high into the atmosphere. Now if the soot happens to fall on ice or snow, we can have a strong warming effect. But if it falls on plant covered land, we have a fertilizing effect. But the aresols that have been pushed miles high into the atmosphere will and do act as reflectors of the incoming energy from the sun. Thus from these fires, we may actually get a regional net cooling effect over the next few years. Right now in Canada, B.C. has the highest output of GHG's of any province in the country. This is from the rotting of all the pine beetle killed trees. All that bacteria that is turning the trees back to soil and energy are farting a lot. It probably would be better for the climate, from a warming/cooling viewpoint, to have let these forests burn 20 years ago. But you know, hindsight is 20/20.....
    0 0
  48. John, just read that you are a solar physicist, Nice! One of your peers, Dr. Svalgaard, is quite adamant that the change in TSI is so minute that it has no discernable relationship to cooling or warming of the planet. He even points out that at the "coldest" point of the LIA, the sun was actually on its active side! I would love to get your thoughts on this. By the way, if I addressed you as Dr. Cooke, would that be right? :)
    0 0
    Response: It wouldn't be correct, I'm not a Dr (and there's no e in my surname :- ) and the Guardian was incorrect in labelling me a solar physicist (which unfortunately has spread throughout the blogosphere). I did a physics degree and majored in solar physics in my post grad honours year but I am not a professional scientist now. I'm pretty clear about this on the About Us page.

    I haven't looked too much into Svalgaard's work but I have actually downloaded an Excel collection of TSI reconstructions of his website - it shows a number of reconstructions revealing his version is somewhat of an outlier compared to other works.
  49. "The research was done on the Metolius River Watershed in the central Oregon Cascade Range, where about one-third – or 100,000 acres – of the area burned in four large fires in 2002-03. Although some previous studies assumed that 30 percent of the mass of living trees was consumed during forest fires, this study found that only 1-3 percent was consumed." http://www.newwest.net/...impacts_often_overestima/
    0 0
  50. Does anyone know why there's a fairly substantial dip in the graph, fig 2, in about 2020?
    0 0

1  2  3  Next

You need to be logged in to post a comment. Login via the left margin or if you're new, register here.


The Consensus Project Website

THE ESCALATOR

(free to republish)


© Copyright 2024 John Cook
Home | Translations | About Us | Privacy | Contact Us