Climate Science Glossary

Term Lookup

Enter a term in the search box to find its definition.

Settings

Use the controls in the far right panel to increase or decrease the number of terms automatically displayed (or to completely turn that feature off).

Term Lookup

Settings


All IPCC definitions taken from Climate Change 2007: The Physical Science Basis. Working Group I Contribution to the Fourth Assessment Report of the Intergovernmental Panel on Climate Change, Annex I, Glossary, pp. 941-954. Cambridge University Press.

Home Arguments Software Resources Comments The Consensus Project Translations About Support

Twitter Facebook YouTube Mastodon MeWe

RSS Posts RSS Comments Email Subscribe


Climate's changed before
It's the sun
It's not bad
There is no consensus
It's cooling
Models are unreliable
Temp record is unreliable
Animals and plants can adapt
It hasn't warmed since 1998
Antarctica is gaining ice
View All Arguments...


Username
Password
New? Register here
Forgot your password?

Latest Posts

Archives

An American Heatwave: The United States Glimpses its Hot Future

Posted on 18 July 2012 by Rob Painting

All-time heat records are tumbling like dominoes in the United States this year, and summer in the Northern Hemisphere hasn't even reached the halfway point (at the time of writing). These record-breaking warm temperatures have  stepped up a notch with the United States very recently enduring a widespread, and rather extreme, summer heatwave.

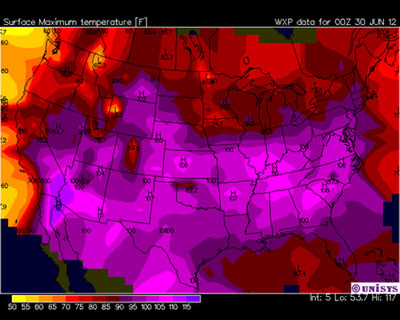
Figure 1 - temperatures over the contiguous United States on 29th June 2012. Image from Capital Climate. Sadly the temperatures are in the archaic Fahrenheit scale, but for comparison the lightest pink areas (105°) = 40.55°C   

That the world will endure more extreme, and more frequent, heatwaves is a rather obvious outcome as the Earth continues to warm from the continued increase in greenhouse gas emissions. The Intergovernmental Panel on Climate Change (IPCC) reported as much in its very first assessment of the peer-reviewed scientific literature back in 1990.

This timely reminder of one of the harmful impacts of global warming has predictably led to climate science contrarians to churn out misinformation in an attempt to put the blame down to natural variability but, as will be explained below, an increase in record-breaking warm extremes is simply a logical consequence of a warming climate, because it raises the odds of weather fluctuations breaking heat records.

More record-breaking heat in a warming world

Now this might seem counter-intuitive for many, but earlier statistical work on record-breaking events has shown that for any time series that is stationary (i.e. no trend), the probability of record-breaking falls with each subsequent observation. This is known as the 1/n rule, where n equals the previous number of data in the series. For example, the first observation has a 1-in-1 chance of being the record extreme (100%), the second has a 1-in-2 chance (50%), the third a 1-in-3 chance, and so on.

Therefore, in a world where the climate is stationary (i.e. neither long-term warming nor cooling), the probability of record-breaking extreme temperatures diminishes with time. For climate heat records, such as the United States, the stationarity rule is not apparent, and previous work in this area has shown that the slowly warming mean (average) temperature (aka a warming climate) is responsible for this nonstationarity. In other words, the average or mean temperature at any given location drifts upwards as the climate warms, and this increases the odds of weather fluctuations creating a record-breaking warm temperature. 

A useful analogy?

One analogy I've used before is to imagine a boat tied to a jetty. The top of the mast represents our temperature series, the incoming tide is the slowly warming climate, and the chaotic waves are weather fluctuations. Now using the jetty as a reference point, at regular intervals we measure the highest point the top of the mast reaches and this is our record-breaking heat extreme.

Clearly the record extreme has two components - the wave strength/height fluctuation and the slowly rising tide. In this scenario the waves may have been largely responsible for record breaking heat extremes early on in our time series, but as the tide continues to rise, the mast height gets higher, the average height recording increases, and so does the probability that the rising tide is responsible for the increased record-breaking.

Big changes at the extremes

As detailed in the SkS post on the freak 2010 Moscow heatwave, global temperatures follow what is called a Gaussian or normal distribution. That is, if you plot temperature series along two axes their frequency or density (vertical axis) and how far these temperature measurements deviate from the average (horizontal axis), will tend to be clustered around the average. These observations or values resemble a bell-shaped curve. See figure 2.  

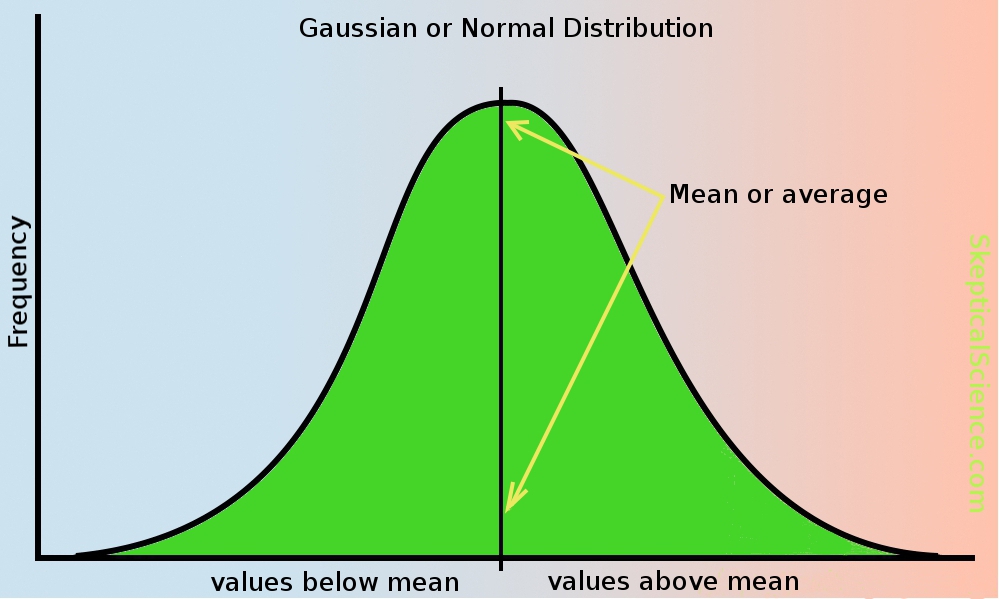
Figure 2 - illustration of a Normal/Gaussian distribution

Not all climate-related phenomena follow this Gaussian distribution, but a number of studies show that surface temperatures do. Intuitively this makes sense, because although surface temperatures can exhibit large swings from time to time they generally don't deviate much from the average throughout the year.

Because of the shape of this distribution, one can mathematically determine the spread of the values. This is known as the 68-95-99.7, three-sigma, or empirical rule, where the percentage of a particluar value declines as one moves further away from the mean. 68.2% of all values are within one standard deviation of the mean, 95.4% within two standard deviations, and 99.7% within 3 standard deviations. See figure 3, and note the greek symbol is sigma representing a standard deviation.

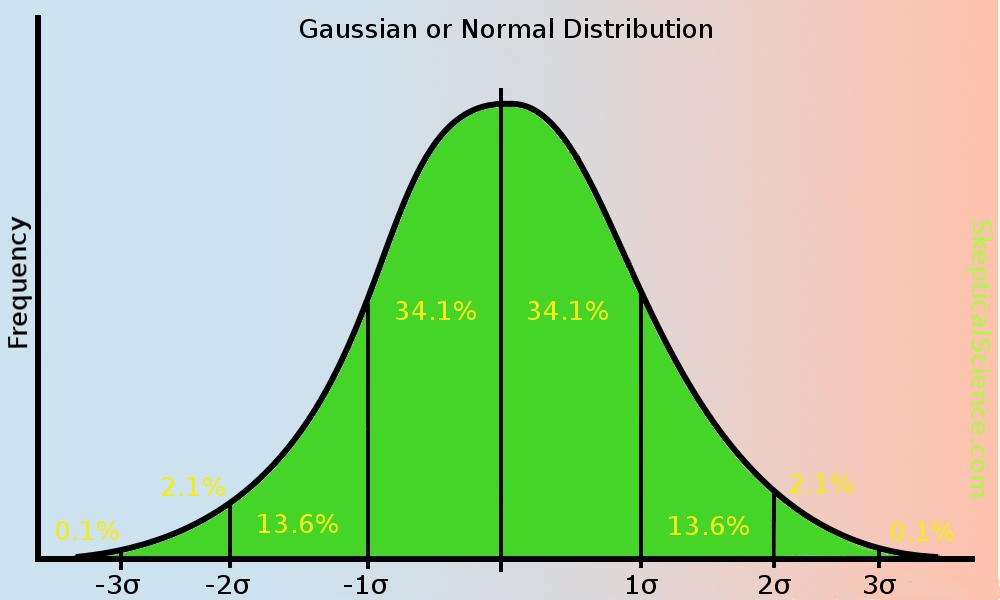
Figure 3 - Gaussian distribution with standard deviations.

With a warming climate the mean temperature begins to slowly climb too, so the bell-shaped curve creeps to the right in the warming direction (figure 4). As it does so, you can see how it affects the measurements at the extremes - warm extreme temperatures become more common place, and cold extremes less common. A shifting mean (as in warming global temperatures) leads to large changes at the extremes.  

Fig 4 - illustration of gaussian distribution with a shifting mean.

An increase of record-breaking warm extremes is a historical fact 

An increase in record-breaking warm extremes is not just some abstract statistical notion, however, it is a historical fact. Analysis of the NASA GISS dataset (GISTEMP) carried out in the scientific paper Public Perception of Climate Change and the New Climate Dice - Hansen (2011) demonstrates a huge increase in the frequency and size of extreme heat events - as expected from examining figure 4. Figure 5 is from the Hansen analysis, and it shows global surface temperatures during the Northern Hemisphere summer plotted in units of the local standard deviation.  

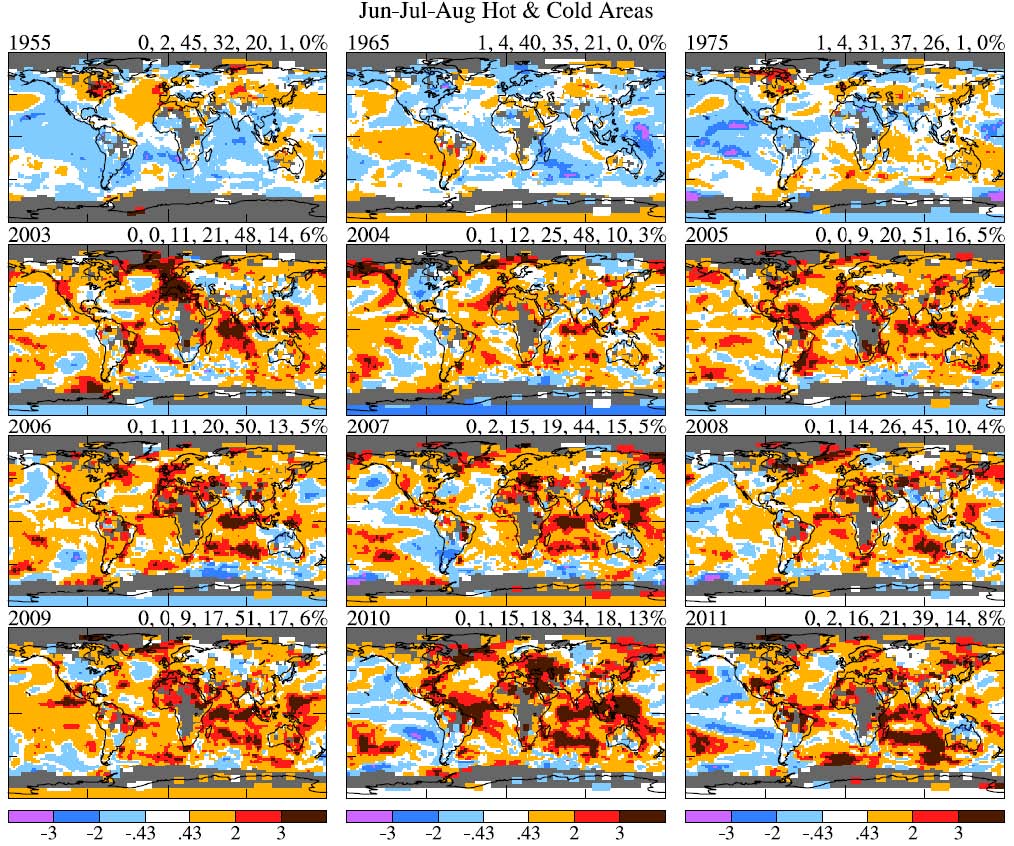
Figure 5 - Jun-Jul-Aug surface temperature anomalies in 1955, 1965, 1975 and 2003-2011 relative to 1951-1980 mean temperature in units of the local standard deviation of temperature.

Remarkably, extremely warm temperatures (+3 sigma deviations=dark brown splotches) are conspicuously absent from the dataset in 1955, 1965 & 1975, but increase dramatically during the 21st Century. This is just a logical, and unavoidable, outcome of a warming climate.

Single heatwaves & global warming

Scientific understanding is not sufficiently advanced enough to be able to attribute singular heatwaves or heat records to either global warming or natural variability. Several peer-reviewed scientific papers have attempted to do just that with the freak Moscow heatwave (for example Dole [2011]), but they are very limited in their scope - looking only a recent weather variability in Europe leading up to the heatwave. In contrast, human activity has been affecting the climate for several centuries - ever since the Industrial Revolution, so it is now an integral component of weather.  

To disentangle the effects of true natural variability, that is a climate without any human influence, and human-caused global warming for a singular event, would be a monumental undertaking, and one that has not been seriously attempted. Simply put, there is an element of both natural variability (weather fluctuations) and global warming in all extreme heat events that have occurred since humans began affecting the climate.

A warming climate does, however, spectacularly raise the odds of record-breaking heat because the average temperature increases with global warming and, like waves in the analogy above, which ride upwards with the incoming tide, so too do weather fluctuations rise up along with a warming climate.

This American Heatwave: Tomorrow's weather today   

The Earth is already committed to decades of further warming because of its energy imbalance, which dictates that the planet must heat up until the balance is restored. More severe and frequent heatwaves and record-breaking heat are, therefore, virtually assured.

This American heatwave will eventually fade from public consciousness, like the Moscow & Texas heatwaves before it, but it won't be too long before another pops up to wreak havoc. We can only hope that mankind's collective memory begins to connect the dots, and demands action to limit planet-warming greenhouse gases before extremely hot summer temperatures effectively become the norm.  

0 0

Printable Version  |  Link to this page

Comments

Comments 1 to 42:

  1. Are the sub average temps, poor summers and horrendous summer rainfall over the last few years also a taste of things to come in the UK ? It’s important to note that climate change does not always mean a warming climate for everyone. A cooling and wetter climate is just as disastrous for UK agriculture and wildlife warming as well as driving the population to distraction with month after month of continuous summer rain.
    0 0
  2. ps That should read " just as disastrous for UK agriculture and wildlife as warming "
    0 0
  3. An interesting paper on extreme heat is from James Hansen and colleagues who took a different approach. In this paper all temperatures are looked at, not just extremes, and compared them to the reference climatology period. This provides a mountain of data instead of only the rare extremes which allows the use of more traditional statistical methods to analyze the data. This paper finds that typically the area of the earth which is extreme warm went from nearly 0% in the reference period (1951-1980) to about 10% during the last decade which is very unlikely when the last decade hadn't warmed significantly compared to the reference period. While it is very difficult to attribute (a portion of) an individual extreme warm event to AGW, it is very clear that the odds of such events has increased greatly.
    0 0
  4. Oh... I clearly looked over the bit where Hansen 2011 was discussed. Need more coffee. Please ignore/delete my previous comment.
    0 0
  5. "hasn't even reached the halfway point." Not only are we past summer's half way point, but the budding El Nino will move the jet streams back to the south, provide some rain and some intermittent cooling to parts of the US. This result will show that the attribution is split between natural factors (La Nina) and the added warmth and evaporative drying from AGW. It's hard to tell if AGW will increase the frequency but it will increase the intensity.
    0 0
    Moderator Response: (Rob P) Text in post amended - simply the result of the delay between writing and subsequent publication.
  6. @5 Eric, "It's hard to tell if AGW will increase the frequency but it will increase the intensity." Please look at figure 5, it could not be more clear: It is very easy to tell that globally the frequency of extreme heat events has increased. Halfway the last century you had about a 0.13% chance for an extreme heatwave (+3-sigma) in any given location, now this has become a 10% chance.
    0 0
  7. Actually the long term outlook for The US Including AK is for the warmth to continue throughout the rest of the summer in the eastern two thirds of the country. This will last well into Autumn. See http://www.cpc.ncep.noaa.gov/products/predictions/90day/
    0 0
  8. cynicus, I think fig 5 supports the fact that extreme heat waves have increased in frequency, but that could simply be a result of major heat waves turned extreme. However I have to read up on how that chart was generated. newcrusader, those forecasts are almost a month old. They should update a lot cooler in some areas such as east.
    0 0
  9. Eric - you don't appear to have understood this blog post. Both the intensity & frequency of heatwaves and record-breaking heat will increase in time. The steadily rising mean temperature (i.e a warming climate) dictates this - see figure 4 above & figure 4 in the Hansen paper. The frequency has increased. Whether further heatwaves are likely this summer is anyone's guess. Certainly the conditions (extreme drought in the US) still exist for further episodes to develop, but that's outside the scope of this post.
    0 0
  10. Rob, I agree that frequency of extreme or record breaking heat waves will increase over time. But figure 4 above is notional and Hansen's figure 4 compares an abnormally cool period (1951-1980) to more recent warm periods, so I don't think either figure is conclusive. Your explanation in this post essentially ignores the role of the natural factors that start and end continental heat waves. For a specific example, at some point this summer the upper ridge over the Great Plains will break down. That breakdown will be a result of natural causes, namely teleconnections from Pacific ocean pattern changes. That breakdown will not be delayed because of AGW. However until that happens the heat wave and drought will continue to be enhanced or amplified by AGW.
    0 0
  11. "Sadly the temperatures are in the archaic Fahrenheit scale..." Hey now, no 'scalism'. The Fahrenheit scale is a mere 18 years (out of 288) older than Celsius. :]
    0 0
  12. Eric, yes 1951-1980 is cool compared to today. It has warmed since then, which is kind of the point - a warming climate will lead to more record-breaking heat. And to extend the wave/boat/incoming tide analogy a little bit further - you are claiming that the rising tide has no effect upon the frequency of record-breaking height. Clearly this is absurd. Both the frequency and the maximum height of record-breaking will rise moving forward in time. Furthermore, looking at one individual record, and the immediate circumstances that led to it, does not change the odds of the rising tide creating records. These are two separate issues.
    0 0
  13. Excellent blog post, really easy to understand and a good analogy. In figure 5 the shift in mean is about one standard deviation of the variation. How much of a shift in the mean has occured in terms of SD? Very crudely I took the Mean and SD from the Hadley Cru anomally dataset from 1940-1990, and got a mean of 0.06C with an SD of 0.14C, I then took the series from 1980-2011, and got a mean 0.26C and a SD of 0.16C (reflecting the smaller times series), although very simplistic that suggests that the mean has shift ~1.5SD, (1.43ish), which mean in figure 5, the mean is now centred at 1.5SD from its orginal position, meaning a previous 3SD event is now well within 2SD, so much more common. But overland the temperature increase has been greater.. So maybe it is little wonder we are experiencing so many extreme events, Amazon drought, European heatwaves, American Heatwaves, Recording breaking rain events all over the world, heat wave the Arab states last year... With the peaking sunspots and incoming EL Nino further regional records should be toppled some. What does a 1.5SD shift mean in terms of the frequency of 1:500 year events considering that most infra-structure is only secure against a 1:300 year event? And of course this can only get worse as if the mean shifts another 0.7C (stopping all CO2 emissions now);that is a further 4-5SD of shift in the mean, and means that 1:1000 year events will be the norm. A further 1.3C to get 2C is now looking scarey! 350ppm anyone?
    0 0
  14. A few years back, I often commented that US based disinformers were on good terms with the weather gods, as while extreme weather affected the rest of the globe, the weather in the US was usually on the cool side. No longer, though, it is amazing how extreme weather events have hammered the US over the past two years. This can not be a good time to be a professional disinformer in the US. Over here in Europe, and especially the northern parts, deniers are on a roll, though, due to a couple of cold winters and not so hot summers.
    0 0
  15. We are trying to model the warming world weather events by normal distribution mean shift. How about sigma itself? It does not necessarily stay the same. If the extra energy was distributed equally troughout the atmosphere and "weather bumps" modeled in the article as waves bumping the boat stayed the same in magnitude, then the shift alone represents the temperature change accurately. However that does not appear to be the case: more energy in the system means larger bumps, more H2O in the air means stronger rains and more capacity for cyclones; to me it means that sigma of any local climate is likely becoming wider. You can clearly see on Fig 4 (global summer anomally distributions) in Hansen 2011: the 2011 bell shapes are always "lower & fatter" thane those for 1951. I cannot find if Hansen quantifies the bell shape change anywhere. Anyone does?
    0 0
  16. It's worse than you say. The statistics from Hansen Sato and Ruedy 2011 show that the Gaussian is no longer Gaussian, but now has a significant tail at the high end
    0 0
  17. @16 Eli, it's also less worse because the same paper shows that the distribution at the cold end hasn't changed as much as the warm end. So luckily there will still be some cold spells to be used as "look squirrel!". Many blogs, including yours, wouldn't be even half as much fun without.
    0 0
  18. Eric, Please provide a reference for your wild claim that 1950-1980 was unusually cool. That time period was much hotter than 1900-1930 see this graph. You need to pick claims that are not easily shown to be false. The deniers now claim that warm periods in the past were cold. That means it will never be warm since 1,000,000,000 years ago it was warmer than it is today.
    0 0
  19. @Gareth #1 Given that they're predicting that the jet stream over the UK will shortly move north after giving us such an extremely wet and miserable early summer, I'll be interested to see whether it coincides with an end to the US heatwaves. I tend to think of the jet stream like a rope with waves travelling along it, so that if one part rises another falls. That's not very scientific but there must be a logical connection between different parts of the jetstream. Oh, and I'm sure everyone will be pleased to know that in-denial weather forecaster, Piers Corbyn, is announcing in his usual alarmist style that the current weather is due to carry on -- thanks to the sun. Extraordinary.
    0 0
  20. Further to Michael Sweet's remarks, the graphic here helps to illustrate the situation w/regard to the '50s and Hansen's base comparison figures. Regarding garethman's questions: Since 2007, a series of major reports has emphasised the fast growing risk of flooding to the UK as the climate warms. On Wednesday, the government's official advisers, the Committee on Climate Change, warned that number of homes at risk of flooding is set to quadruple in the next 20 years and that flood defence spending must increase. The government's own report on climate change risk in January said flooding was the UK's greatest climate threat, with annual damages set to rise to billions of pounds a year. More The trouble is, the UK government is heading in the wrong direction: Caroline Spelman's deep cuts to flood defences begin to look foolish
    0 0
  21. # 19 (John): Thanks for the heads up on Corbyn. That guy has been dead wrong so many times now that I have lost count.
    0 0
  22. Will James Hansen soon release the final draft of "Public perceptions of climate change and the new climate dice", because I heard that the current version of the paper released in November 2011 is a rough draft?
    0 0
  23. Is there a psychological reason why heat waves, drought etc attracts more interest when it comes to global warming than record rainfall and wind. What we see is a gradual increase in energy in the climate system, from green house gases. There is no reason why that energy should manifest itself differently. Think of a fridge, it gets cold because of an input of energy, whilst the surrounding air gets warmer. If we applied the same logic that many expect of climate change, then the fridge wouldn't get cold at all, but would get slightly warmer, as it takes energy from the electricity supply. Maybe I have created a new analogy here??! There are no rules saying that everything will get hotter, evenly.
    0 0
  24. michael and doug, Hansen is comparing 1955, 1965 and 1975 with 2006-2011. It doesn't make a lot of sense to use 1950-1980 mean when that encompasses the former dates and not the latter. He should use 1950 to present for that graphic, or the old climate normal of 1971-2000.
    0 0
  25. Nice post on the statistical nature of climate as related to extreme weather events. Figure 4 could be useful for tv meteorologists to help explain what global warming means for weather extremes in our future. For example, if 3-sigma corresponds to a "hundred year event" of some type (heat, drought, flood, etc.), then with the climate shift that event occurs 10 times as often, so former hundred year events become ten year events, and if we don't act aggressively to reduce GHG emissions soon, the shift will increase further and they'll become annual events.
    0 0
  26. `cynicus, sadly no. While the Gaussian has flattened, as one would expect, the shift of the mode to higher temperatures means that the probability of cold spells is much less today than it was before 2000 AND there is the extra special hot tail on the distribution to warm you up. Also where you pick the climate mean has little to no effect on the result it just shifts the zero for everything.
    0 0
  27. It doesn't make a lot of sense to use 1950-1980 mean when that encompasses the former dates and not the latter.
    Eric, I'm sure you understand more about anomalies and baselines than certain fake skeptics that could be mentioned. It makes no numerical difference whether you use the 1951-1980 or 1971-2000 baseline, the change is just the same. And if you keep shifting the baseline towards the present, you'll contribute to an illusion of temperatures not appearing as abnormal as they really are - for the uninitiated, temperatures won't be so far above the 'zero' point in the graph. Is that what you want? And mentioning the weather is a poor go as well. Changes in weather patterns over the summer are exactly what gives us the approximately Gaussian distribution of temperatures! Weather patterns are throwing the punches - sometimes below average, often near average, sometimes above, occasionally extreme. Move the distribution right, and the extremes become new records, and the weather patterns that led to above average conditions now lead to new extremes. This means there's both more extremes and greater extremes. There's really no getting around this. Figure 4 in Hansen et al is very telling in that regard - the distribution has shifted right and also flattened somewhat. Had the distribution narrowed, there would be an argument to say there might not be so many extremes. But with more energy in the atmosphere, the distribution has, as would be expected, broadened as it moved to the right. Should the world continue to warm, and there is no reason on Earth to believe that it won't given the physics of the radiative forcing, the distribution will continue to move to the right and flatten.
    0 0
  28. Hansen's Jan-2012 forecasts sure paned out, definitely for the US (sks article here)! Compare this to flawed contarian predictions (Easterbrook, McLean, Others)! One more for the scorebooks! Question: This article implies El Nino will shift jet stream south and relief drought. I thought El Nino also brought on higher temps (which may only anchor the hot, high pressures even more, strengthening the drought). If the current budding El Nino intensifies (link), which seems likely, I would think this will only make next year's summer (2013) even worse (ugh!). I'm probably over simplifying El Nino impacts and year-ahead forecasts. Comments for what's in store for 2013 summer???
    0 0
  29. Comments for what's in store for 2013 summer???
    Pain...
    0 0
  30. skywatcher, you are right about the baseline not mattering when depicting plain old anomalies. But Hansen et al show anomalies in fig 3 using the 1981-2010 std deviations as units, not simply temperature anomalies. In fig 6 they used the 1951-80 standard deviations. I am really not sure which depiction if any shown is most valid. I would have depicted the broadest baseline and standard deviations from that. My dilemma may be resolved by fig 4 which shows my preferred distributions in the right hand column. When using standard deviations, the baseline period does matter. I think you and I may agree on weather more than you suspect. I was trying to point out that the reason there are more extremes is that AGW creates them from existing patterns. What would have otherwise been a heat wave becomes an extreme heat wave. There is no resolution yet on pattern changes from AGW. The flattening distribution is evidence in that direction but not conclusive. sauerj, I'm not sure about the article, but I claimed above that El Nino will shift the jet stream south and bring relief to the continental US (at first only some parts). The El Nino will also raise global temperatures next year if it continues, but may or may not raise US summer temperatures (really strong -> yes, not strong -> no).
    0 0
  31. Eric (skeptic), It is good that you have dropped your false standard of the 1950's being "cold". Your suggestion for moving the baseline is completely incorrect. Hansen is comparing temperature distributions from 1950 to the current distribution. Hanson has used a 1950-80 baseline for comparison ever since 1980. Why should he change to a period where the temperatures have gone up an additional .4C? The data I linked shows that in 1950 the temperature had already risen by about 0.5C from 1880. Your suggestion to continually raise the baseline artificially hides the increase in temperatures. Why would you use the hottest temperatures in the past 2,000 years as your baseline for measuring an increase??? I noticed a recent post at WUWT that used a baseline of 1980-2010 to hide the increase in temperatures in this way. Have you complained to them about their misuse of the baseline? Suggesting "the old climate normal of 1971-2000" is simply uninformed. This is only "normal" on skeptic sites who are trying to fool people who do not understand the data. Perhaps you should change your handle to Eric (credulous) since you believe anything you see on the "skeptic" sites without any supporting data.
    0 0
  32. @23.Paul D at 04:42 AM on 18 July, 2012 I don't know what do you mean but I think it works like this. Refrigirant takes heat/heat exchange, like water evaporation, from the inside of a fridge. And it carrys to out side in the back of the fridge then releases the heat/heat transfer, like water vapor becoming rain. Electrocity is used to run a pump to circulate the refrigirant and the electric pump gets hot when it is running. So if you leave the fridge door open on a hot summer day, cool air inside cancels out hot air in the back of the fridge. And heat from the electric motor pump would warm up your room, I think. I don't think it is quite same as "a gradual increase in energy in the climate system, from green house gases.", though.
    0 0
  33. Eric #30, to me, it crucially depends on the question. If the question is: "How does variability in 1955, 1965 and 1975 compare to variability in the 1981-2010 period?", then Hansen's Figure 3 is your friend, and is the correct use of standard deviation (1981-2010); I agree with Hansen's consistent use of 1951-1980 as a fixed baseline period from which to compare more recent changes. Alternatively, for: "How does variability in 2006-2011 compare to variability in the 1951-1980 period?", then Hansen's Figure 6 is your friend. Here, the 'base' variability is 1951-1980, and we see how recent years fare on that scale. Both are (slightly) different, and both perfectly valid, depending on the question. I suspect Figure 6 is land-only as they consider the 1951-1980 marine data not as good for baselining as the 1981-2010 period (from text bottom of p7). For the land areas, we can actually see the difference the sd's make by comparing Figure 3 and Figure 6. We may well agree quite a lot, but only, I think, if you'll agree (in contrast to your earlier statements), that there is excellent global-scale evidence for heatwaves to have increased both in frequency and in intensity. The evidence is pretty plain in Figures 1 and 5 of the Hansen paper.
    0 0
  34. @John #19 Thanks John, I took your advice last year and built a polytunnel, but the outside crops except for Brassicas and potatoes have been pretty grim. Farmers in the UK are pointing out that huge amounts of crops are being written off due to the cold wet weather which will have an inevitable effect on price and supply. Good to hear the jet stream is shifting back to it’s normal situation, however climate change has not stopped and expect it to return to it southerly route and drop us once more into wet and below normal temps. I have read that as the Arctic melts this is one of the effects we can expect, this is climate change in action for us in the North East Atlantic, but not the effect many had expected.
    0 0
  35. The choice for the baseline of 1951-1980 is simple. James Hansen and GISS are in-business a long time and 1951-1980 is the first climatological period before their first product. They always use the same baseline because it's useful as you can directly compare results from different studies when they all use the same baseline. Finally, the choice of baseline period has no impact on the conclusions. If they would have used the last 30 years as baseline the result would be that the 50's were much colder then today, which is the same result as saying that now is much warmer then the 50's. Or, in Hansen's own words: "The GISS analysis uses 1951–1980 as the base period. The United States National Weather Service uses a 3 decade period to define “normal” or average temperature. When we began our global temperature analyses and comparisons with climate models, that climatology period was 1951–1980. There is considerable merit in keeping the base period fixed, including the fact that many graphs have been published with that choice for climatology. Besides, a different base period only alters the zero point for anomalies, without changing the magnitude of the temperature change over any given period. Note also that many of today’s adults grew up during that period, so they can remember what climate was like then. Finally, the data for a base period must have good global coverage, which eliminates periods prior to the 1950s."
    0 0
  36. "Not only are we past summer's half way point, " Actually, in terms of cumulative heat we're not half way through the summer yet.
    0 0
  37. Atomant, can you explain what cumulative heat is? In my case the average high has started to drop although average lows and records highs stay flat for a while:

    (click for full size)
    0 0
  38. I'm not in the least an AGW skeptic, but would like some input. This atmospheric sciences prof. Cliff Mass claims there are serious problems with Hansen's study: "Texas Tall Tales and Global Warming" http://cliffmass.blogspot.tw/2012/07/texas-tall-tales-and-global-warming.html So far I haven't been able to find a response from Hansen or his co-authors. Any thoughts?
    0 0
  39. dvaytw @38, you should read more carefully. Cliff Mass does not discuss Hansen's study at all. Rather, he critiques a paper by David E. Rupp and Philip W. Mote which deals exclusively with the 2011 Texas heat wave. That study claimed that global warming had made Texas 2011 heatwaves 20 times more likely in La Nina years. As it happens, the Texas 2011 was very improbable on the assumption of no global warming as can be seen by this histogram of August temperatures in Texas by the Texas State Climatologist, John Nielson-Gammon: There is no doubt that such events have become more probable because of the warming of Texas' climate, as shown in the discussion above. Whether they have become 20 times more probable, however, is open to dispute.
    0 0
  40. Dvaytw, To further Tom's comment, on Mass's blog he criticizes the model Rupp/Mote used for the comparison. Hansen used only measured data (no model data) so Mass's complaint does not apply. Since Hansen and Rupp/Mote reach similar conclusions it seems like Mass is the outlier. Mass presents no peer reviewed analysis of his own. You have to decide who you trust.
    0 0
  41. // Vay you should read more carefully... // Yeah sorry I read about Mass from this USAToday article: NASA scientist ties heat waves to global warming (apologies if I messed that hyperlink up; this is my first time posting on this site) Thanks for the feedback guys.
    0 0
  42. The beat (and the heat) goes on… “The average temperature for the contiguous U.S. during July was 77.6°F, 3.3°F above the 20th century average, marking the warmest July and all-time warmest month on record for the nation in a period of record that dates back to 1895. The previous warmest July for the nation was July 1936, when the average U.S. temperature was 77.4°F.” Source: State of the Climate - National Overview - July 2012, National Oceanic and Atmospheric Administration’s National Climatic Data Center
    0 0

You need to be logged in to post a comment. Login via the left margin or if you're new, register here.


The Consensus Project Website

THE ESCALATOR

(free to republish)


© Copyright 2024 John Cook
Home | Translations | About Us | Privacy | Contact Us