Climate Science Glossary

Term Lookup

Enter a term in the search box to find its definition.

Settings

Use the controls in the far right panel to increase or decrease the number of terms automatically displayed (or to completely turn that feature off).

Term Lookup

Settings


All IPCC definitions taken from Climate Change 2007: The Physical Science Basis. Working Group I Contribution to the Fourth Assessment Report of the Intergovernmental Panel on Climate Change, Annex I, Glossary, pp. 941-954. Cambridge University Press.

Home Arguments Software Resources Comments The Consensus Project Translations About Support

Bluesky Facebook LinkedIn Mastodon MeWe

Twitter YouTube RSS Posts RSS Comments Email Subscribe


Climate's changed before
It's the sun
It's not bad
There is no consensus
It's cooling
Models are unreliable
Temp record is unreliable
Animals and plants can adapt
It hasn't warmed since 1998
Antarctica is gaining ice
View All Arguments...


Username
Password
New? Register here
Forgot your password?

Latest Posts

Archives

What CO2 level would cause the Greenland ice sheet to collapse?

Posted on 23 March 2010 by John Cook

A matter of concern is the potential instability of the Greenland and Antarctic ice sheets. If the Greenland ice sheet was to completely collapse, it would contribute as much as 7 metres sea level rise. Similarly, the West Antarctic ice sheet would contribute around 6 metres sea level rise. East Antarctica would contribute 70 metres of sea level rise but is less prone to collapse. Consequently, how these ice sheets respond to warming temperatures is a crucial area of research. A new paper (Stone 2010) has been published that estimates that the CO2 level that will lead to collapse of the Greenland ice sheet is between 400 to 560 parts per million (ppm). At our current rate, we should pass 400 ppm within 10 years.

While there are uncertainties over the specifics of ice sheet behaviour, there are several lines of independent evidence that paint a consistent picture of how ice sheets will respond to global warming. Focusing on Greenland, what do observations tell us has been happening to the Greenland ice sheet? Satellites use gravity data to measure the total mass balance and have found the ice sheet is losing ice mass at an accelerating rate (Velicogna 2009).
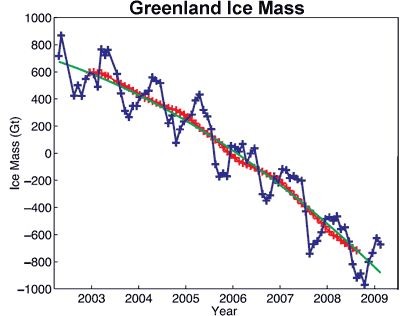

Figure 1: Ice mass changes for the Greenland ice sheet estimated from GRACE satellite measurements. Unfiltered data are blue crosses. Data filtered for the seasonal dependence are shown as red crosses. The best-fitting quadratic trend is shown as a green line (Velicogna 2009).

How can we know how the Greenland ice sheet will behave over a longer time period? We can determine this by looking at how the ice sheet has responded in the past. Some of the more optimistic emission scenarios from the IPCC predict warming of 1 to 2°C. The last time temperatures were this high were 125,000 years ago. At this time, sea levels were over 6 metres higher than current levels (Kopp 2009). This tells us that the Greenland and Antarctic ice sheets are highly sensitive to sustained, warmer temperatures and that in upcoming centuries, we can expect sea level rise in the range of metres, not centimetres.

Further light is shed on Greenland ice sheet stability in a new paper The effect of more realistic forcings and boundary conditions on the modelled geometry and sensitivity of the Greenland ice-sheet (Stone 2010). This paper uses updated data on bedrock topography and ice thickness to produce more accurate modelling results of Greenland ice sheet behaviour. They model how the Greenland ice sheet will respond to three different scenarios with atmospheric CO2 held at 400 ppm, 560 ppm and 1120 ppm. The simulations are run over a 400 year period.

Although not completely collapsed, the 400 ppm ice-sheet loses ice mass in the north of the island, with a total reduction in ice volume ranging between 20 to 41%. Note - due to the large inertia of the Greenland ice sheet, this mass loss doesn't happen at the moment CO2 levels reach 400 ppm but over a period of centuries. Under a 560 ppm climate, the Greenland ice sheet loses between 52 to 87% of its ice volume. If CO2 reaches 1120 ppm, there is almost complete elimination of the Greenland ice sheet with loss between 85 to 92%. The important result from this paper is that there is a critical threshold where the Greenland ice sheet becomes unstable somewhere between 400 and 560 ppm.

This is a large uncertainty range and one imagines there will be much research in the next few years to reduce the uncertainty. However, the 400 to 560 ppm range is put into perspective when you look at the projected CO2 levels for the various IPCC scenarios. The business as usual scenario has CO2 levels reaching 1000 ppm by 2100. Even the most optimistic scenario tops 500 ppm by 2100.
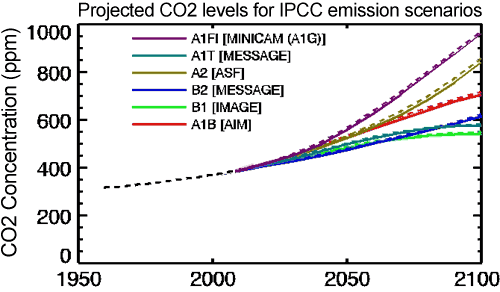
Projected CO2 levels for various IPCC emission scenarios
Figure 3: Atmospheric CO2 concentrations as observed at Mauna Loa from 1958 to 2008 (black dashed line) and projected under the 6 IPCC emission scenarios (solid coloured lines). (IPCC Data Distribution Centre)

Of course, Figure 3 displays projected scenarios. What has been happening in the real world? Observed CO2 emissions in recent years have actually been tracking close to or above the worst case scenario.
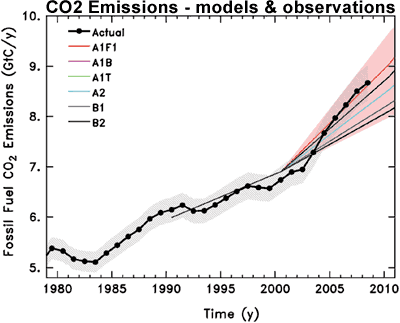

Figure 4: Observed global CO2 emissions from fossil fuel burning and cement production compared with IPCC emissions scenarios. The coloured area covers all scenarios used to project climate change by the IPCC (Copenhagen Diagnosis).

Satellite measurements, paleoclimate data and ice sheet modelling all paint a consistent picture. Global warming is destabilising the Greenland ice sheet which is highly sensitive to sustained warmer temperatures. Our current trajectory with CO2 emissions will likely cause at least several metres sea level rise from the Greenland ice sheet over the next few centuries. Of course, we shouldn't forget that this estimate doesn't include Antarctica - the Antarctic ice sheet is also losing ice at an accelerating rate.

0 0

Printable Version  |  Link to this page

Comments

1  2  Next

Comments 1 to 50 out of 66:

  1. Nice post, John. GRACE is really turning out to be one of the best investments of NASA's earth system science program. Your figure 4 is noteworthy. Emissions in the mid-2000s really were on an unsustainable trajectory. Presumably the economic downturn has dropped the line back down a bit, but as the global economy picks up steam again we may head back up towards that ugly BAU line. Melting Greenland is one of those things that will probably take a long time to accomplish but one it starts it will be hard to stop.
    0 0
    Response: Hansen describes it well in 'Storms of my Grandchildren'. The Greenland (and Antarctic) ice sheets have great inertia. This means it takes a long time before they start moving. So early on, we think the massive inertia of the ice sheets is our friend. But once the ice sheets start moving and particularly when they reach the tipping point where collapse is inevitable, it's not like we can lassoo a rope over them and hold them back. At this point, the inertia is revealed to be not our friend but our enemy.
  2. Hi does this alter the sea level rise predictions this century? Thanks
    0 0
    Response: As far as I can tell, it's broadly consistent with the several papers that predict around 1 to 2 metres sea level rise by 2100. But this paper takes a longer view, looking at the impact over 400 years.
  3. Quick question. What do you mean by completely collaspe. Do you mean slowly melt? Because it sounds like a very sudden, violent process the way you phrase it.
    0 0
    Response: There are two main contributors to ice mass loss from the Greenland ice sheet: melting ice and increased discharge as glaciers are sliding faster into the ocean. Part of the reason why Greenland and West Antarctica are losing ice mass faster than East Antarctica is because part of the Greenland and West Antarctic ice sheets are sitting on bedrock that is underwater - warming oceans speeds up the slide of glaciers that calve into the ocean.

    I wouldn't characterise it as a sudden, violent process. I'd characterise it more like pushing a huge, heavy boulder from the top of a hill. It's difficult at first and moves slowly. But then you reach a tipping point where it's momentum starts to carry it down the hill and then there's no stopping it.
  4. This Stone paper seems to model greatest mass loss from the north of the continent at CO2 of 400ppm. A recent Howat paper suggests up to 75% of present day mass loss is from the SE of the continent. http://www.agu.org/pubs/crossref/2008/2008GL034496.shtml Does this apparent inconsistency matter?
    0 0
  5. "Because it sounds like a very sudden, violent process the way you phrase it." Maybe because it would be, compared to how long we used to think it would take to melt large ice sheets like Greenland and West Antarctica. And as John replied, the fact that large portions of the Greenland ice cap and most of the West Antarctic ice sheet are grounded below sea level will allow intrusion of warm sea water beneath the ice, not only lubricating it, but also melting the ice from below. Moreover, it's a process that will continue well beyond 2100, so talk of just building higher dikes and sea walls to deal with a 1-2 meter rise is sheer nonsense. Oh, and remember, those dikes would have to be run up both banks of every river to the new, higher tidal point, mind you.
    0 0
  6. Nice post, John. For those of you in the US, this is a nice page that illustrates sea level rise in coastal cities. Very scary. http://www.architecture2030.org/current_situation/cutting_edge.html
    0 0
    Response: Thanks for that link. I've added it to the list of links relevant to sea level predictions.
  7. HR writes: Quick question. What do you mean by completely collaspe. How fast, exactly, can an ice sheet disappear? That's a good question, and I wish we knew the answer to that. I have generally been a bit skeptical about some of the hypothesized dynamics involved in "rapid" (century-scale) collapse of large ice sheets, even ones that are grounded below sea level. Greenland in particular is largely surrounded by mountains that would seem to give it a bit more structural support. On the other hand, if you want to lie awake worrying at night, think about meltwater pulse 1a. Sea levels rose on the order of 7-10m per century for a couple of centuries ... and we still don't know convincingly where the water came from! Until we have a better picture of how exactly the Laurentian and Fennoscandian ice sheets collapsed, and whether MWP1A was purely northern hemispheric or there was an Antarctic contribution, I think there's good cause to be concerned about Greenland and the WAIS. The series of meltwater pulses between the LGM and Younger Dryas would be high on my personal list of climate science topics that are in desperate need of more research.
    0 0
  8. I wrote: ... we still don't know convincingly where the water came from! To clarify, obviously we know the water came from melting ice. But at least as of a couple of years ago people were still arguing whether that ice was in the Antarctic, North America/northern Europe, or both.
    0 0
  9. #5 HumanityRules I'm not sure that there is an inconsistency, or even an apparent one. One quantity is present loss, the other is predicted loss over 400 years. Not surprisingly, the warming has hit the southern part first, but that doesn't mean draining the southern part of Greenland ice sheet will contribute more mass in the long term if most of the ice sheet is lost over that long term (if nothing else, Greenland is skinnier in the south, so there may simply be less ice to lose). Differences in the sub-glacial bedrock surface, numbers of outlet glaciers to the sea, all can make a difference as well. Having said that, I just downloaded the paper, and I suspect the authors explain in more detail. (I just downloaded it from home for free, so probably you can too).
    0 0
  10. How reliable can this model be if it miscalculates the expected size of the ice sheet by 25% based on present day conditions and observations?
    0 0
  11. 9.Jeff Freymueller at 12:38 PM on 23 March, 2010 Again I could easily be wrong but this is not looking at temporal change. This model is saying if conditions are x, y and z what should the Greenland icesheet look like. It says nothing about what happens over the next 400years. As you say it does require that as the process continue there is a complete shift in how ice mass is lost.
    0 0
  12. Can you identify the source of the data in Figure 4? Thanks.
    0 0
    Response: Good question - I'm getting more disciplined about citing my sources but this one slipped through the cracks. That graph came from The Copenhagen Diagnosis which I'm now adding to the caption.
  13. Thanks for this post, John. I have a question about CO2 equivalents. Did the Stone paper have anything to say about these?
    0 0
    Response: I didn't see any mention of CO2 equivalents and I did wonder that myself, considering the CO2 equivalent once you factor in methane and other man-made greenhouse gases is already well over 400 ppm. Please feel free to try contacting the author to enquire about this question and report back to us :-)
  14. hi john, Thanks for all the work you have put into this great blog. I read Hansen's book, it sounds like you have too. The paleoclimate information and ice and ocean inertia issues he raises worry me as well. From memory I think Hansen said it bordered on insanity to consider adaptation to significant sea level rise. Nevertheless, I looked further and found that Richard Tol et al have actually modelled an adaptation scenario for the complete collapse of the West Antarctic sheet: Global Estimates Of The Impact Of A Collapse Of The West Antarctic Ice Sheet: An Application Of Fund I expect you and your readers will be interested in the Tol et al study. I want to think about this a bit or probably a lot more before attempting to pass judgment. After all the consequences of reducing or stabilising CO2 are very significant as well especially since no governments have realistic energy plans for the future as currently being discussed on Barry Brook's blog, Brave New Climate
    0 0
  15. #11 Humanity Rules. Darn it, I typed out a longish reply, then clicked in the wrong place and lost it. Not going to type it out all over again. But I will point out that the future predictions of the model are all for 400 years from now. They tuned the ice sheet model to match the present ice sheet, and they don't make any prediction about where things will melt first. It looks like the bedrock topography plays a big role in the pattern of predicted ice sheet retreat (see Figure 12 of the paper). However, they didn't discuss it in the paper that I could find, so this is my interpretation. In particular, it looks like the mountains in SE Greenland divide the ice sheet into a main part that has to drain out somewhere other than the SE, and the coastal strip in the SE, plus a few glaciers in the SE that cut through the mountains. So it appears the pattern is controlled by the principle that "water and ice go downhill".
    0 0
  16. What I love about this blog is the wonderful statements at the head of each thread. This one includes a real gem: "The last time temperatures were this high were 125,000 years ago." If you believe this you must be a Medieval Warm Period denier. While most parts of Wikipedia relating to AGW have been re-written by William Connolly, the part that relates to the history of Greenland has survived. The link below shows that the Greenland ice sheet was less extensive during the MWP. http://en.wikipedia.org/wiki/History_of_Greenland
    0 0
    Response: I should clarify, 'the last time global temperatures were this high...' There were regions during the Medieval Warm Period that were as warm or warmer than the same regions today.
  17. John the GRACE graph is frightening. But two questions. How can the ice mass changes be positive before 2006? Positive compared to what? And (I guess) a related question, are there estimates of ice mass/ice mass change using other methods prior to these satellite observations?
    0 0
    Response: The graph is showing ice mass changes relative to an average value. The caption doesn't specify the base period but presumably it's April 2002 to February 2009 - the period over which they have data. In which case, naturally the first half of the time series would be positive and the second half would be negative (if you had a negative trend).

    Yes, Greenland ice mass change has been determined by other methods (van den Broeke et al 2009). This paper is explored in an earlier post Why is Greenland's ice loss accelerating?
  18. Discussion - debate about the fate of the Greenland ice should not ignore this work: "Greenland Ice Sheet Surface Air Temperature Variability: 1840–2007*" Box et. al. 2009, AMS DOI: 0.1175/2009JCLI2816.1 Especially Figure 10, 11, 14 are very interesting. In the years circa 193X-5X; in Greenland was warmer than today. Especially in the spring. Only now the autumn is warmer in Greenland. Why is cooled? Climatic cycles? Aerosols? (sulfur, black carbon?) Let me quote also two important pieces of this important work: "Global and NH warming 1975–2007 has been attributed to the dominance of increased greenhouse and solar forcing over various cooling factors (Solomon et al. 2007). High-latitude warming is simulated by global climate models to be amplified by the ice albedo feedback (Budyko 1969; Solomon et al. 2007). NHcooling 1940–70 has been attributed primarily to the dominance of sulfate aerosol cooling sourced from increased coal-fired power plants largely in the Western Hemisphere (Wildet al. 2005, 2007), and partly to decreasing solar activity during that period (Solomon et al. 2007). Subsequent warming is attributed primarily to increasing greenhouse gasses while coal-fired power plant SO2 emissions were reduced. Whether sulfate aerosols directly or indirectly cooled west Greenland, that is, far away from industrial sources, is something we address in OUR INTERPRETATION." "With the exception of major volcanic eruptions, cooling caused by a negative phase of the Atlantic Multidecadal Oscillation and/or NAO (Hanna and Cappelen 2003) and strong decreases in solar output are the only potential regional climate trends (Keenlyside et al. 2008) we are aware of to moderate Greenland deglaciation. Climate warming has pushed the Greenland ice sheet beyond its threshold of viability in recent years (Rignot et al. 2008). The ice sheet seems poised not to grow without substantial regional and global climate cooling. It therefore seems much more likely that not that [“our interpretation”?] Greenland is and will be for the foreseeable future be a DEGLACIATING PLEISTOCENE ICE AGE RELIC." We see that natural variability is very important here - the most important?
    0 0
  19. Ah, I see, of course, silly of me. And now to turn to gallopingcamel. Life was much easier for people like Mr Camel before the internet. Go to his Wikipedia article and you find "Excavations show that there were considerable birch woods with birch trees up to 4 to 6 meters high[citation needed] in the area around the inner parts of the Tunuliarfik- and Aniaaq-fjords". Now I was amazed to learn (although I can't find these fjords on a map, the Wikipedia entry says they are around "the central area of the Eastern settlement") that the phrase "the area around the inner parts of the Tunuliarfik- and Aniaaq-fjords" is incredibly common on the internet - Google gives 3170 appearances on web sites called things like "Global Warming A Fraud". And here was me thinking Mr Camel had come up with this himself! It is also worth noting that archaeological research has (understandably) been very limited on Greenland; that in any case I'm not sure how palynology gives you birch "4 to 6 meters high" what a pity there is no citation; that the area of trees etc was clearly small from Mr Camel's reference, so to say "the Greenland ice sheet was less extensive" is to stretch a very long bow; that there are still today parts of Greenland coast free of ice; that the ice sheet itself is very old indeed; that, even in the Wikipedia article, a number of hypotheses are given about the demise of the colony; and, again Wikipedia, warm currents are suggested as part of the reason for warmer coastal regions.
    0 0
  20. Thanks for the post, John! Although emissions are running in the high end, I think that concentrations are not (closer to A2??, I read it in a comment by a moderator in RC, but I cannot find it right now). Anyway, a small difference difficult to asses for such a short period.
    0 0
    Response: Here is a comparison of CO2 levels to projected IPCC levels. Two things to note - the graph is several years old and you'd need to get in a little closer to get a good look at the difference between the two.


    Figure 1: Monthly carbon dioxide concentration (blue thin line) and its long term trend (strong blue line) as measured at Mauna Loa, Hawaii. Dashed line is IPCC's projected carbon dioxide levels (Rahmstoorf 2007).
  21. According to USGS, there was a period in the Pliocene when CO2 levels were similar to today's (~380ppm), temperature was some 3ºC higher (slow vegetation and ice albedo feedbacks, I assume), and sea level was as high as 25m above today's level. Even so, the Greenland ice sheet was still there, being the only land ice mass in the Northern Hemisphere. I looks different than the Stone 2010 results. Can someone help me put this in context?
    0 0
  22. Alexandre, the USGS study states that their reconstruction was based on "ice volume and areal coverage on Greenland [being] reduced by 50%", and other studies suggest that the CO2 levels were a bit higher (around 400ppm) and that Greenland actually collapsed. See this WIKIPEDIA page for an overview and more sources. Is it really different from Stone ?
    0 0
  23. JMurphy, Thanks for the response. Ok, so the only remaining land ice mass was significantly reduced - we might say collapsed? What caught my attention here was the 3 degree warming and the remaining ice sheet. But you're right: "remaining" does not mean "unchanged". One important point to stress here, is that apparently we're talking about the most resilient land ice mass in the Northern Hemiphere. So if Greenland feels it, than Siberia and all its permafrost will feel much more...
    0 0
  24. Gallopingcamel, there is 'comparing apples to oranges' and then there is what you did above. John wrote about a global change in temperature which the IPCC has projected for the year 2100... you 'countered' with a (disputed) local change in ice coverage compared to current levels. Each of those discrepancies (i.e. global vs local, temperature vs ice coverage, and 2100+ versus current) potentially invalidates the 'comparison'. Together they make it incomprehensible.
    0 0
  25. John, Nice work, albeit very scary.I wonder how figure 1 (Greenland ice mass loss, from Velicogna) would compare with a graph of ice loss data from Arctic observations at nsidc.org. A quadratic trend as shown has ghastly implications. Alexandre, I wonder about your remark in 24, "apparently we're talking about the most resilient land ice mass in the Northern Hemiphere." A study entitled "Climatic impact of a Greenland deglaciation and its possible irreversibility," published in the 2004 Journal of Climate, available here, makes a case quite to the contrary. The authors took the well-established effect of post-glacial isostatic rebound into account, showing that an ice-free Greenland would rise so that there would no longer be an accumulation zone. Once its gone, its gone. To quote Randy Newman, "Boom goes London, boom Paree." As far as time scale of these potential events is concerned, there is ample geologic evidence that glacial melt and associated freshwater runoff can indeed be sudden. See this Goddard Institute study of "meltwater pulses." In short, the mechanism (discussed at length here, is thus: Warming causes meltwater to pond locally, forming large lakes trapped behind localized "ice dams." Breaching an ice dam can happen quickly, resulting in catastrophic flooding (I've seen the sedimentary evidence left by these floods first-hand). And as the land mass becomes ice-free, it rises to seek gravitational equilibrium.
    0 0
  26. John, Answered my own question with this graph . Full scale here. This somewhat longer term trend is indeed down. Should be smooth sailing through the Northwest Passage.
    0 0
  27. " The link below shows that the Greenland ice sheet was less extensive during the MWP" There is a bit of apples-to-oranges comparison involved in that. You are comparing the MWP minimum against the current incomplete melting. There is a lag between CO2 rise and temperature rise, and there is a lot of inertia in the ice sheet. Even CO2 levels were to stop rising today, we don't know that the melting already baked in isn't much greater than the MWP melting.
    0 0
  28. Oops...sorry about repeating the points in CBDunkerson's post. I had mine all typed in (at work) and someone called me away from my desk right before I hit submit. By the time I came back and hit submit, CBDunkerson had scooped me.
    0 0
  29. muoncounter, Thanks for the interesting study you linked. I was thinking of the fact that in the Pliocene warm period, Greenland was the only lend ice mass left. So if Greenland ice sheet is gone because of AGW, land ice will all be gone in the NH by then, probably. "Resilient" was probably a poor choice of words, I admit, since it implies the ability of returning to its original state. I see the paper you linked suggests otherwise. "The hardest land ice region to melt in the NH" would be more appropriate, maybe?
    0 0
  30. Thanks for your inline answer in #20, John. The trends in modelled and observed CO2 concentrations are truly close, almost indistinguishable. I link another graph from the IPCC: graph website
    0 0
  31. Ned, (#7&8), Do you want glaciers to start growing again as they did during the Little Ice Age? What is wrong with shrinking glaciers? You seem to be well aware that sea levels rose very rapidly at the start of the present Interglacial. With regard to meltwater pulses, Disney did a good job on a collapsing ice dam in "Ice Age".
    0 0
  32. Thanks for this great website. As a farmer I am constantly defending the science of AGW against the farmers I come across who think it all a just a normal climatic cycle/socialist plot(70% if you believe a recent survey in southern Australia). The common refrain from the people I speak to seems to be; "Scientists huh, what the **** would they know?!" This site gives me the ability to put the counter argument although I fear that I'm fighting a losing battle. My rainfall here has dropped off 20% in the past 15 years which may not in itself prove much but given everything else that's happening it certainly worries me. Keep up the great work!
    0 0
  33. Figure 3 at the top of this thread shows predictions for the CO2 concentration until 2100. The exponential rise assumed by the IPCC, Rahmstoorf and Hoffman is not the only plausible explanation for the observed concentrations. You folks don't have much time for Craig Loehle since Loehle & McCullough, 2008 but here he is again with an alternate view of things: http://www.ncasi.org/publications/Detail.aspx?id=3282
    0 0
  34. "What is wrong with shrinking glaciers?" Ideally we want glaciers melting at a rate that doesnt cause sealevel to rise faster than we can adapt. 3mm/yr isnt good. 10mm/year would be tough.
    0 0
    Response: Just off the top of my head, the sea level rise due to melting glaciers (excluding the Greenland and Antarctic ice sheets) is somewhere between 60 to 80 cm. Which would be inconvenient but not disastrous. The real sea level rise comes from Greenland and Antarctica.

    The more serious impact from disappearing glaciers is the eventual loss of a source of seasonal drinking water for hundreds of millions of people.
  35. "What is wrong with shrinking glaciers?" as well as the practical impact on water supplies there is the canary in the coal mine aspect. Mr Camel and his like constantly complain about the use of models in climate research, but with the glaciers shrinking so rapidly in recent times we have another example of the reality of warming climates. Mr Camel is really asking two questions in one of course. First is the "this is perfectly natural" meme, and second is the "what is the ideal temperature" meme. We've heard them a thousand times, and asking them in a slightly different way doesn't fool anyone. But how on Earth these people get their head around the concept that all these rapid changes to the Earth's biosphere exactly correspond to the rapidly rising CO2 levels and temperatures of the last few decades, and yet, it seems, are just purely coincidental ("glaciers could shrink or grow any old time, they just happen to have decided to shrink now, big deal") is beyond me. But I'm a simple soul.
    0 0
  36. David Horton (#35), Scott Mandia is committed to the AGW cause but he does not try to deny history. I am quite a fan of his although I seldom agree with him on mankind's role in what is going on with climate. Expanding glaciers during the "Little Ice Age" caused all kinds of problems. In Switzerland they kept very good records so we know that farmers were having difficulty paying their taxes and that wheat prices seem to be a plausible proxy for average temperatures (Herschel). Take a look at the following link before you start rooting for bigger and better glaciers: http://www2.sunysuffolk.edu/mandias/lia/little_ice_age.html
    0 0
    Response: This reminds me of an story I heard recently - I don't recall the exact details (a google challenge for the curious) but there was some European glacier that was threatening some village several centuries ago. The villagers went to the Pope asking him to pray that the glacier would retreat. Recently villagers from the same region went to the Pope, asking him to pray for the same glacier which has nearly disappeared.

    Just an amusing anecdote. More seriously, noone is wishing for glaciers to grow and take over the regions that we inhabit. There is no danger of that happening. But what is of serious concern is that the glaciers that seasonally melt and provide summer drinking water are retreating at an accelerating rate. This threatens the water supplies of hundreds of millions of people. Well, hundreds of millions of people now. By the time the glaciers have disappeared, I imagine it will be significantly more people that are affected.
  37. Well, this is a new one on me. What Mr Camel is saying is that all us evil greenies who want to reduce CO2 are dooming the poor peasants of Switzerland to having glaciers advance down the valleys and ruin their farms (unless, of course, the present pope could stop it, rather like King Canute with liquid ice). So we should all shut up and applaud the increase in CO2. I guess it's a variant on "They call CO2 a pollutant, we call it plant food" nonsense - "They call CO2 a pollutant, we call it a glacier killer". Still, it has served up a bit of amusement on a Wednesday afternoon.
    0 0
  38. There are a few things missing in this blog that upsets me: 1) Figure 1. It's a nice graph but how does this graph relate to the total mass of the ice sheet? 2) Your claim is that CO2 is driving the slope of figure 1, but you don't compare with any estimates of how that figure would look like if we did not add any extra CO2 into the atmosphere from burning fossil fuels. My guess is that the figure 1 would look virtually the same. 3) With the current rate of mass reduction of the ice sheet it will take x years for everything to melt. You claim that we will reach a tipping point causing a drastic reduction of x. Do you have any example or good explanation to this claim making it plausible?
    0 0
    Response: "It's a nice graph but how does this graph relate to the total mass of the ice sheet?"

    Figure 1 is the change in total mass of the Greenland ice sheet. This is measured by satellites which measure the change in the gravity field around Greenland (Velicogna 2009).

    "you don't compare with any estimates of how that figure would look like if we did not add any extra CO2 into the atmosphere"

    If we hadn't added any extra CO2 into the atmosphere, we would have experienced a slight, long-term cooling trend over the last half century (Meehl 2004). It's difficult to see how Greenland could lose ice mass at an accelerating rate if global temperatures were cooling.

    "Do you have any example or good explanation to this claim making it plausible?"

    A good example of the high sensitivity of ice sheets to warmer temperatures is the behaviour of ice sheets 125,000 years ago. At this time, temperatures were 1 to 2°C warmer than current conditions. Sea levels were at least 6.6 metres higher than current values. This is strong evidence that ice sheets are sensitive to sustained warmer temperatures (Kopp 2009).

    How does it happen? The Greenland and West Antarctic ice sheets sit on bedrock that is underwater. As the oceans warm, they melt the ice sheets from below - this causes the ice sheets to slide faster into the ocean (van den Broeke et al 2009). This is what is being observed now by satellites.

    It's not fantasy, it's not alarmism, it's peer-reviewed science based on multiple lines of empirical observations.
  39. "This reminds me of an story I heard recently - I don't recall the exact details (a google challenge for the curious) but there was some European glacier that was threatening some village several centuries ago. The villagers went to the Pope asking him to pray that the glacier would retreat. Recently villagers from the same region went to the Pope, asking him to pray for the same glacier which has nearly disappeared." [Sorry, I do not speak english very well] The story you tell about concerns the largest glacier in western europa, the Aletsch glacier in Switzerland. Here is the news in french I know well the story, because I live in this area of Switzerland. Retreating glacier is a realty that every people living in the alps experience.
    0 0
    Response: Thanks for the link (I was hoping someone would post some more info). It's a great story - the villagers of Fiesch swore to live a virtuous life and prayed against the growth of the Aletsch Glacier. To enhance the effect of prayer, they've held an annual procession every year since 1862. Now that the glacier is melting, the people are trying to get a meeting with the Pope to request he cancel the Papal oath. You can't make this stuff up.

    I'm now waiting for a new skeptic argument: "global warming was caused by the Pope".
  40. One point that is not being accurately made in this post is the cause of GIS outlet glacier acceleration "How does it happen? The Greenland and West Antarctic ice sheets sit on bedrock that is underwater. As the oceans warm, they melt the ice sheets from below - this causes the ice sheets to slide faster into the ocean (van den Broeke et al 2009). This is what is being observed now by satellites". --this is not wrong but not correct either. The warm water can only melt the bottom of floating sections of ice tongues. These are very limited in Greenland. The key to acceleration of marine terminating outlet glaciers is to reduce ice thickness at the glacier front. Thinning causes the glacier to be more buoyant, even becoming afloat at the calving front, and is responsive to tidal changes. The reduced friction due to greater buoyancy allows for an increase in velocity. This is akin to letting off the emergency brake a bit. The reduced resistive force at the calving front is then propagated up glacier via longitudinal extension in what R. Thomas calls a backforce reduction (Thomas, 2003 and 2004). The acceleration observed is not primarily due to meltwater acceleration or melting of the floating ice tongue bottoms. These processes maybe happening in some places. It is thinning of the ice tongues that by whatever process that leads to the acceleration. It can be surface melting, it can be basal melting. http://www.realclimate.org/index.php/archives/2008/04/moulins-calving-fronts-and-greenland-outlet-glacier-acceleration/
    0 0
    Response: Thanks for clarifying my over-simplified explanation.
  41. John: In #34 you responded: "The more serious impact from disappearing glaciers is the eventual loss of a source of seasonal drinking water for hundreds of millions of people." That point needs to be fleshed out. If AGW reduces the annual snowfall in the glacier regions long term, then not only will the glaciers disappear, but the available water will also decrease. If not, then without glaciers all that snowfall will melt in the spring/summer, potentially causing flooding. To counteract this more dams would have to built. The glaciers act as dams that smooth out the effects of seasonal temperature variations.
    0 0
  42. David Horton (#37), It seems that I am irritating you and that is not my intention. In an effort to set up a more cordial exchange of views, my favorite adjective for greenies is "well-intentioned". Furthermore I support the idea of reducing CO2 emissions drastically and soon. However, this blog is not into "solutions" as yet. My points thus far have been that the MVP affected the Greenland ice sheet and to suggest that expanding glaciers have mostly negative consequences from a human perspective. I have tried to cite sources such as Wikipedia that you will not dismiss without reading. I don't understand your sarcastic tone while mentioning the efforts by monks to exorcise advancing Swiss glaciers. It is well documented and in at least one case it seemed to work. As John Cook mentions (#36) this is an amusing anecdote. When (not if) the Laurentide glacier re-establishes itself all the way to New York City it won't be amusing any more. I guess it all depends whose ox is being gored.
    0 0
  43. Right gallopingcamel. So we are left with the choice of managing a risk at the 1 to 200 years horizon or at the 20000 years horizon. Tough one. And indeed this blog is not into solutions. It is into addressing widespread nonsense like "it's cooling", "it's the sun", "it's cosmic rays", "Jupiter is warming" and numerous others. That is plenty of work already. Since you are in favor of soon, drastic emission reductions, nothing prevents you from starting a blog on solutions. I will certainly be a reader.
    0 0
  44. At 31, gallopingcamel offers this: "With regard to meltwater pulses, Disney did a good job on a collapsing ice dam in "Ice Age"." Hardly. For example, the draining of glacial Lake Agassiz 8500 years ago showed up in the sedimentary record in the Rhine River delta. Although this is a newspaper article, it cites a recently published study by Dutch geologists, quoting: "They determined that the collapse of a glacial wall near present-day Hudson Strait in northern Canada triggered a two-stage draining of the lake that sent global sea levels soaring by about three metres — “double the size of previous estimates,”" Quoting further, "“The (Agassiz) event is often seen as an analogue for possible future freshening of the North Atlantic,” they state, “and serves as a test case for assessing the sensitivity of ocean circulation to freshwater perturbations in climate models.”" And then there's the little problem of drought: Warming air stimulates evaporation from not just the oceans, but from soil as well. From Early warning signs of Global Warming: Droughts and Fires": "The environmental and ecological consequences of the summer 1999 drought in the eastern United States provide examples of situations that may become more frequent as climate changes. Without freshwater to rinse out rivers and streams, salt water encroached further up rivers in many areas of the mid-Atlantic coast (USGS, 1999)." That saltwater kills crops and contaminates fresh water supplies in the lower reaches of the river basins. It's a double whammy: "Decreased freshwater runoff also led to increased salinity and low oxygen conditions in Chesapeake Bay, causing fish kills and other ecological changes. As future sea level rise shifts the saltwater-freshwater boundary farther inland, droughts will exacerbate the geographic extent and impacts of saltwater encroachment into coastal aquifers." And then there's fire: by way of anecdotal evidence, in the US over the past few years, it seems as if each summer's national news is full of more widespread and more intense wildfires. Increasing fire frequency is confirmed by this botantical study. In 41, Mr. Camel posits: "it all depends on whose ox is being gored"? Let's see: floods, drought, fire... drought is often associated with famine and no doubt insects and shallow water critters will figure this out first, giving us locusts and frogs. How many more plagues do you want?
    0 0
  45. 20th-Century Industrial Black Carbon Emissions Altered Arctic Climate Forcing McConnell et al. Science 7 September 2007: 1381-1384 DOI: 10.1126/science.1144856
    0 0
  46. Camel, in 31 I would have to say that you're throwing up a strawman argument. I don't believe anyone expects that controlling carbon emissions would drastically (if at all) drop the 380ppm current CO2 levels, throwing us into massive glaciation. That would require halving CO2 levels AND a solar minimum! It would be nice, however, if we could moderate the current climate changes to minimize disruptions to sea levels, drinking water supplies, weather patterns, etc. Posing a complete and well-nigh impossible reversal of a centuries long trend is really just a distraction... Second topic: Reading the article you point to in 33, the Loehle paper fits various curves (including a 'Saturated' one?) to 51 years of data, arguing that the recent Hofmann fitting the IPCC models to it (exponential growth) is inaccurate. I haven't downloaded the original Hofmann paper ($$$), but even in the abstract they state: "Here we show that the anthropogenic component (atmospheric value reduced by the pre-industrial value of 280 ppm) of atmospheric carbon dioxide has been increasing exponentially with a doubling time of about 30 years since the beginning of the industrial revolution (~1800)." That's x4 as much data than Loehle uses; why didn't Loehle use all the data? And if Hofmann doesn't use all the data, why didn't Loehle pointedly note that!? I also observed that Loehle states his alternate curves "...capture current trends in both the first and second derivative without any assumption of mechanisms." I do a _lot_ of curve fitting; over-fitting a short curve segment with an arbitrary equation is almost unavoidable. You need to restrict the potential curves to those based on the best understanding of the mechanisms involved, or you will be thrown off by data noise. The IPCC curves he's comparing to are based on carbon emission estimates - Loehles' alternate (and short) curve fits are not based on _any_ physical process described in his paper. The only time you should try arbitrary fits is if you have no idea as to the underlying mechanism, and there as to get clues as to what that mechanism is. You certainly can't assert predictive power beyond WAG's from arbitrary fits, nor invalidate a mechanism without a compelling alternative. I have to say I'm not impressed by any scientific insights from the various Loehle papers...
    0 0
  47. Missing from this discussion (I believe) is a mention of why there exists a tipping point beyond which collapse of the Greenland ice sheet becomes inevitable. The key to the continued existence of the ice sheet is altitude - the ice is over 2500 m thick in places, including the southern extent which lies below the Arctic Circle. For every hundred metres lost to melting, the temperature of the surface ice will rise by (roughly) another Celsius degree simply from the effects of lower altitude. Once the height of the ice sheet decreases below the current equilibrium line, Greenland will continue to completely melt even if temperatures go back down.
    0 0
  48. KR (#46), My reasons for wanting to reduce CO2 emissions have nothing to do with the CO2 concentration in the atmosphere. That is the IPCC's motivation, please don't try to associate me with their Alarmist science. With regard to the Loehle paper, this is another example of the inability of statisticians to reach agreement. When you are talking about small changes, statisticians will tell you whatever you want to hear. Does a few hundred ppm of CO2 matter? In my opinion the answer is "NO" if you think in the larger context of geological time. Loehle may be "low balling" the CO2 trend while the IPCC is more inclined to exaggerate. Who is right? Your guess is as good as mine.
    0 0
  49. "Do a few 100 ppm of CO2 matter?" Well without our GHG we would be a frozen ball. Does that matter to you? Are you seriously positing that our GHG in the atmosphere arent giving us a warmer planet? In context of geological time, humans dont matter but they do to me. As to your contempt for statistics,- well they are abused in political dialogue but they are essential tool for science. What science operates without statistics? The problem is that statistics need to be wielded by the competent.
    0 0
  50. Gallopingcamel (#48), the IPCC estimates range up and down quite a bit, based on different model inputs for our CO2 activity - previous predictions from these models (even the worst case) all appear to underestimate the current temperature. Loehle posits a couple of curve fits, with no discussion of how they were selected, and states that he has "no assumption of mechanisms". His curve fits are lower than the IPCC's model, which has previously been shown to underestimate the temperature trend. That would hint to me that his curves (not models!) are unlikely to be accurate representations of the underlying physics. Add that to his previous papers, and I might suspect an agenda shaping his interpretations, rather than data-driven modeling. Now, I could fit a near infinite number of curves to the data, depending on how many degrees of freedom and fit error estimates I wanted to apply. Some would be higher when extrapolated out, some would be lower. The IPCC curves fit the data within known noise limits, with high confidence - I can't tout my assorted fits as an argument against the IPCC model unless I have a compelling alternative model, one with (a) descriptive power (fits past data), (b) predictive power (makes testable assertions about the future), and (c) some support in physics. Loehle also doesn't use anywhere near as much data as Hofmann; I consider that a critical failing in any argument for data fitting. 210 years versus 51? Dropping 75% of the data makes for a poor argument, which I think you have argued in the past. I have ongoing issues with trash on my lawn - random garbage. I could look at known behavior of my neighbors (beat up trash cans), wind (gusty), and model my neighbors trash blowing onto my yard. Or, I could posit invisible gnomes with personal grudges who bring in trash at night from miles away, placing them in cryptic patterns with mystic importance. That might be a better fit to the trash pattern. Which guess is right? Well, I suspect the one based on observed physical interactions would be more likely... Loehle's curves are (IMO, mind you) the equivalent of the gnomes. No basis in a model of the world, not driven by any p<95 issues with the curve fitting; they seem driven more by a wish for a different conclusion than scientific criticism.
    0 0

1  2  Next

You need to be logged in to post a comment. Login via the left margin or if you're new, register here.


The Consensus Project Website

THE ESCALATOR

(free to republish)


© Copyright 2024 John Cook
Home | Translations | About Us | Privacy | Contact Us