Climate Science Glossary

Term Lookup

Enter a term in the search box to find its definition.

Settings

Use the controls in the far right panel to increase or decrease the number of terms automatically displayed (or to completely turn that feature off).

Term Lookup

Settings


All IPCC definitions taken from Climate Change 2007: The Physical Science Basis. Working Group I Contribution to the Fourth Assessment Report of the Intergovernmental Panel on Climate Change, Annex I, Glossary, pp. 941-954. Cambridge University Press.

Home Arguments Software Resources Comments The Consensus Project Translations About Support

Bluesky Facebook LinkedIn Mastodon MeWe

Twitter YouTube RSS Posts RSS Comments Email Subscribe


Climate's changed before
It's the sun
It's not bad
There is no consensus
It's cooling
Models are unreliable
Temp record is unreliable
Animals and plants can adapt
It hasn't warmed since 1998
Antarctica is gaining ice
View All Arguments...


Username
Password
New? Register here
Forgot your password?

Latest Posts

Archives

Sea level rise: the broader picture

Posted on 30 August 2010 by Doug Bostrom

Sea level rises as ice on land melts and as warming ocean waters expand. Sea level rise mutually corroborates other evidence of global warming as well as being a threat to coastal habitation and environments.

The blue line in the graph below clearly shows sea level as rising, while the upward curve suggests sea level is rising faster as time goes on. The upward curve agrees with global temperature trends and with the accelerating melting of ice in Greenland and other places.

Because the behavior of sea level is such an important diagnostic aid for tracking climate change, skeptics seize on the sea level record in an effort to cast doubt on this evidence. Sea level bounces up and down slightly from year to year so it's possible to cherry-pick data falsely suggesting the overall trend is flat, falling or linear. You can try this yourself. Starting with two closely spaced data points on the graph below, lay a straight-edge between them and notice how for a short period of time you may create almost any slope you prefer, simply by being selective about what data points you use. Now choose data points farther apart. Notice that as your selected data points cover more time, the more your mini-graph reflects the big picture. The lesson? Always look at all the data, don't be fooled by selective presentations.
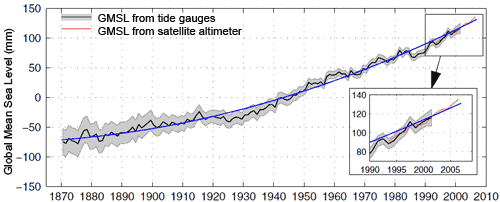
( graph from Church 2008 )

Other skeptic arguments about sea level concern the validity of observations, obtained via tide gauges and more recently satellite altimeter observations.

Tide gauges must take into account changes in the height of land itself caused by local geologic processes, a favorite distraction for skeptics to highlight. Not surprisingly, scientists measuring sea level with tide gauges are aware of and compensate for these factors. Confounding influences are accounted for in measurements and while they leave some noise in the record they cannot account for the observed upward trend.

Various technical criticisms are mounted against satellite altimeter measurements by skeptics. Indeed, deriving millimeter-level accuracy from orbit is a stunning technical feat so it's not hard to understand why some people find such an accomplishment unbelievable. In point of fact, researchers demonstrate this height measurement technique's accuracy to be within 1mm/year. Most importantly there is no form of residual error that could falsely produce the upward trend in observations.

As can be seen in an inset of the graph above, tide gauge and satellite altimeter measurements track each other with remarkable similarity. These two independent systems mutually support the observed trend in sea level. If an argument depends on skipping certain observations or emphasizes uncertainty while ignoring an obvious trend, that's a clue you're being steered as opposed to informed. Don't be mislead by only a carefully-selected portion of the available evidence being disclosed.

Current sea level rise is after all not exaggerated, in fact the opposite case is more plausible. Observational data and changing conditions in such places as Greenland suggest if there's a real problem here it's underestimation of future sea level rise. The IPCC synthesis reports offer conservative projections of sea level increase based on assumptions about future behavior of ice sheets and glaciers, leading to estimates of sea level roughly following a linear upward trend mimicking that of recent decades. In point of fact, observed sea level rise is already above IPCC projections and strongly hints at acceleration while at the same time it appears the mass balance of continental ice envisioned by the IPCC is overly optimistic ( Rahmstorf 2010 ).

This post is the Basic version (written by Doug Bostrom) of the skeptic argument "Sea level rise is exaggerated". We're currently writing plain English versions of all the skeptic rebuttals. If you're interested in helping with this effort, please contact me.  

0 0

Printable Version  |  Link to this page

Comments

Prev  1  2  

Comments 51 to 64 out of 64:

  1. doug_bostrom at 06:47 AM, one of the obvious outcomes if everybody only references the same sources is that everybody will draw the same conclusions as generally most studies put together a compelling case that appears logical not only to the authors, but to the readers also. This is especially so for those whose mindset has been preconditioned by prior acceptance of the author's credibility, and so are likely to be readily accept what has been written rather than to look for flaws in the reasoning. Where would that leave the debate? A feel good round of good old boys exchanging pleasantries? The process of logic which drives the reasoning of most people is such that it makes it difficult, (impossible?), to accommodate anything outside the step by step process which logic itself is. Thus those concepts that track outside the logical path, lateral to it, are left to the those who can connect seemingly unconnected concepts which ultimately become logic themselves after they have connected all the dots, which must be a great relief for that majority of people who are unable to do it themselves. Just as in history, it has been left to a few to explore for new land for those who don't want to risk leaving the comfort of close existence, but once new settlement has been established the masses are more than happy to populate it to the extent that are quite willing to pile on and live on top of one another, feeding off the sense of community that ironically had only come about by those who sought to extend the lateral boundaries the masses so willingly imposed upon themselves, and then continue to do so again. I really don't like confining myself in such a way, either in the regions I have explored, or the concepts that others present. I pay little attention to an authors name, instead look for value in the alternative concepts being developed, without which a sense of balance cannot be developed. I compare this to peoples taste in music. Many people have their favourite artists and religiously buy all their works irrespective of how the quality waxes and wanes, all the time ignoring others who have yet to establish themselves. Thus it becomes that the early works of that artist becomes valuable items as those who woke up late try to obtain them from those who saw the potential first up. However there are also those whose reputation was built on that first big hit that resonated with the masses, but then proceeded to produce duds whilst the faithful continued to believe that the talent was real. That sort of reminds me of this quote, "For example, the IPCC (2001) wrote “no significant acceleration in the rate of sea level rise during the 20th century has been detected”. In 2007 they said that “global average sea level rose at an average rate of 1.8 [1.3-2.3] mm per year over 1961 to 2003. The rate was faster over 1993-2003: about 3.1 [2.4-3.8] mm per year. Whether the faster rate for 1993 to 2003 reflects decadal variability or an increase in the longer-term trend is unclear”. end of quote.
    0 0
  2. JohnD - nature doesnt have opinions. It is surely a central tenet of science that people will reach the same conclusion from the same data - because there is only one reality. You are saying that you agree that your opinions are illogical but having illogical opinions is fine because it is the debate that matters not whether we are in fact doing future generations a hell of a lot of damage?
    0 0
  3. Johnd; Looking at your 2007 IPCC quote it is already outdated. Sea level rise is now 3.3-3.5 mm/yr. If you want to be knowledgable in anything you need to know what experts think. Not reading what experts think to keep an open mind means you cannot have an informed discussion. The rest of us have to continually correct the mistakes you make because you have not done your homework. Think about whether or not you want to be informed and up to date.
    0 0
  4. JohnD I don't expect you to overturn the results of several thousand publications by researchers armed with extensive training and experience specific to their field in a comment thread at a climate blog. The probability of such a revelation would be low even if you were trained in this topic but worse, you're not keeping in mind your own limitations. On another thread here at Skeptical Science it became apparent that you did not understand the difference between latent and sensible heat and thus were able to synthesize a hypothesis about atmospheric heat transport entirely divorced from reality. Oblivious to this perfectly innocent gap in your awareness, you were quite comfortable and confident using the fallacious product of your oversight to challenge the work of people who after all are far more knowledgeable than you or I. Concerning this topic, you're apparently still not aware of material thrust in front you showing how multiple data sources have been drawn together to narrow the confidence interval of global sea level measurements. Instead you are continuing to talk about scientists as though they're naively leaning on their favorite instrumentation without bothering to exploit available cross-checks wherever possible. Look, this is not a fair fight. It's not even a fight at all, it can't be because you don't have any weapons, not even the equivalent of bare fists. You're one person with a necessarily and perfectly ordinary and ok highly limited perspective, versus a small army of people entirely preoccupied with levels of arcana of which the both of us are quite ignorant. Unless you can articulate your disbelief of what's reported to us in a highly elaborated form, richly detailed and entirely circumspect, you're not making an argument, you're simply disagreeing. To drive understanding forward you need to take into account everything that's been published on the crux of your disbelief, comprehensively. The kind of argument you need to make is what you can look at in the form of scientific publications.
    0 0
  5. JohnD @49 - "Can you elaborate as to the reasons why 0.3mm per year must be added to the Australian records and how this adjustment was arrived at as it appears very relevant to the discussion." The 1.2mm per year rate of rise from 1920 to 2000 around the Australian coastline, did not include the 0.3mm per year adjustment which is the GIA. This is detailed in Kurt Lambeck's 2002 paper here: Sea Level Change From Mid Holocene to Recent Time: An Australian Example with Global Implications The GIA explains why there is abundant geological evidence of the sea level around Australia being up to 3 meters higher than present, some 6000 - 7000 years ago, despite the sea level rising in that time.
    0 0
  6. 48.michael sweet I was less interested in the specifics of how the numbers are generated and more the way they are being used to tell a story. Ned's post does say 5.4mm/4.9mm "compares very well" with 3.3mm. More generally with regard to acceleration we are arguing over a change in SLR of ~1.5mm/year, I was just saying on Ned's basis 1.8mm "compares very well" with 3.3mm. "Pay attention to what you are comparing." I wasn't particularly comparing anything, I think Ned was doing that. I'm still curious why there is no evidence of an acceleration in SLR over the course of the 18 year satellite record? As seen in the two papers from Peter Hogarth's post #15. Am I wrong to expect an acceleration in that period?
    0 0
  7. doug_bostrom The paper you keep quoting LEULIETTE AND MILLER: CLOSING THE SEA LEVEL RISE BUDGET seems to have a SLR of 1.5mm/year (0.8mm steric and 0.8mm mass) for 2004-2007. This is the same as the long term 20th century average. This paper seems to refute the idea that an acceleration has occured.
    0 0
  8. I know its not a scientific thing to say, but I love this site :-)
    0 0
  9. HR @ 57 - there's a very good reason that the rate of rise was small over the 4 year period analysed by Leuliette & Miller. It's something I pointed out @ 21 - ENSO. From the paper's conclusions: "Regional trends in sea level rise are driven primarily by local variations in steric sea level. During our study period the individual components of sea level experienced weak El Nin ˜o conditions in 2004–2005 and 2006–2007 and a moderate La Nin ˜a, which began developing in mid 2007. As a consequence, sea level rise (1.5–2.4mm/a)during the period is 33–50% slower than the rate reported in the 4AR." "Most of the sea level rise during 2004–2008 occurred in the Southern Hemisphere (3.1 mm/a) and the rate of sea level rise in the Northern Hemisphere (0.2 mm/a) was the lowest of any four-year period since regular altimetry observations began." Again this finding is in line with those of Merrifield 2009 - see comment @40. "In particular, the rate in sea level rise in the Indian ocean observed by altimetry was 4.7 mm/a and 7.4 mm/a from Envisat and Jason-1, respectively. Poor coverage of the Indian ocean prior to 2006 or other systematic errors may affect our analysis with SL steric, which shows a rise of only 2.4 mm/a over the basin." Yup, still issues to resolve.
    0 0
  10. Dappledwater #44 at 23:28 PM on 31 August, 2010 Ken, that set of posts was entertaining. And yet here you are still banging on the same old drum. Its an old drum for someone still in short pants - but one you seem to have trouble answering with anything other that a tweet tweet perhaps. I notice that no-one was prepared to take on BP's point about the flattening of Jason's record of SLR. Nor has anyone produced an effective answer to the serious inconsistency of flattening SLR with rising warming imbalance. Even if the warming imbalance stopped rising and stayed at the claimed 0.9W/sq.m, there would be a linearly rising energy addition to the Earth system, most of which has to be stored in the oceans.
    0 0
  11. Ken, I have a look at the tune you were playing (only glossed over it to be honest) & get back you later.
    0 0
  12. Berényi Péter at 11:03 AM on 31 August, 2010 Sorry about the late response. I hope the following is useful. First, let us look at the comment on the New York Tide gauge data that Peter B selected (from NOAA historic tide data). The overall New York linear trend is 2.8mm/yr over the entire period, though there is a short gap. This is relative sea level, relative to the local land. We need to correct this data with an estimate of local GIA (Glacial Isostatic Adjustment, or post glacial rebound) for any vertical land movement. Peter B correctly states GIA in this area is still being affected by recovery from the the last Glacial Laurentide Ice sheet “forebulge collapse”. PBs image gives us little detail but his statement that New York GIA is negligible is not supported by several lines of evidence. If we look at: Figure 1, modeled GIA, image from Horton 2009. This shows output of a global GIA model (ICE-4G (VM2), Peltier 1998) looking at the US. Horton suggests there is good agreement with sea level data from the US North Eastern coast. The updated ICE-5G (VM2) model is given in Peltier 2005 (see figure 21, the coastline near New York runs somewhere beteen the 0 and -2mm/yr contours). From the updated GIA model Kolker 2009 gives New York GIA correction as -0.85 to -1.64 mm/yr. This means the land is tilting downwards and thus relative sea level rise rates would appear higher. We can also estimate GIA from direct GPS measurements made over several years as in Woppelmann 2009. Background for the North East of the US is given in Sella 2007 below which uses GPS derived vertical references using 362 GPS sites across US and Canada to estimate GIA (in good agreement with the models). For specific detail on New York Snay 2007 gives -1.35mm/yr for the nearest Geodetic GPS station vertical velocity (14.5km from the New York “Battery” tide gauge) but with high error estimates, as there was only 4 years of GPS data 2001-2005, at that time. There are now over 1600 GPS Continuously Operating Reference Stations (CORS) - as of end 2009, so we expect detail to improve and std deviation from older individual stations to improve as Woppelmann 2009 indicates for tidal stations near New York. Using the 2007 GPS estimate of GIA we get an absolute MSL (Mean Sea Level) rise of 1.45mm/yr for New York over the past 150 years. Using the GIA model value we get 1.56mm/yr. We can also estimate GIA from late Holocene Geological RSLR (Relative Sea Level Rise) data from before any 20th Century (or potential Industrial period) acceleration and subtract this from the tide gauge records, as in Engelhart 2009, which gives another independently derived GIA estimate and overall MSL value for the New York tide station of around 1.8mm/yr. If we use the same overall measured baseline RSL tidal value of 2.8mm/yr instead of the 3mm/yr Engelhart uses, we get an MSL value of 1.6mm/yr overall. The agreement is good. A related and useful recent paper on salt marsh derived Sea Level history is Kemp 2009. Here estimates of Mean Sea Level rise in North Carolina are given and placed in the context of other data from several sites in the NE US. The agreement with the global values from Jevrejeva 2008 and Church and White 2009 is good, and the small latitudinal variations are of note. Getting back to NY, using the GPS derived value of GIA to correct the tide data from New York, and comparing the corrected data with Jevrejeva 2008, we get: The offsets are for convenience. Second order trend fits are a little different, (I also get slightly higher NY acceleration values than BP even after corrections) but within each others error bounds. The overall background acceleration is apparent.
    0 0
  13. I will, time (and space) permitting, attempt to discuss variations from these trends, and the satellite altimetry record (Ken, BP), separately.
    0 0
  14. HR at 56 YOU are comparing the 5.4 mm local rise to global 3.3 rise and saying it is similar to global changes from 1.8 to 3.3 mm/yr, not Ned. You are comparing apples and oranges and using a single standard. As I said, we EXPECT local changes to be more varied than global averages. Therefor 5.4 at a local site is comparable to 3.3 as a global average. We EXPECT global averages to be stable. Thus the global figure changing from 1.8 to 3.3 is significantly different. Even though these two data sets are similar in magnitude the meaning of the changes is different. Because of noise and other factors, single site data has more variability than global data does. You cannot use the same standard to compare two global averages that you use to compare a local point to the global average. It is often confusing to people who do not work with data all the time when there are issues like this. Even people who work with numbers all the time make mistakes. That is why we rely on experts to interpret the data. The experts have figured out how the data can be compared. Dougs post is a reasonable summary of expert opinion.
    0 0
  15. I've found 4 papers looking at closing the sea-level budget around 2003-2007. The latest is from this year. Basin patterns of global sea level changes for 2004–2007 You-Soon Chang, Anthony J. Rosati, Gabriel A. Vecchi Journal of Marine Systems 80 (2010) 115–124 Chang, like the others, calculate the steric and mass components using ARGO and GRACE and compare it to the total change calculated from altimetry. They handily summarize the 4 published attempts to close the sea-level budget in a table. Chang et al (2010) STERIC −0.11±0.22 MASS 0.70±0.34 TOT 2.67±0.52 Willis et al. (2008) STERIC −0.5±0.5 MASS 0.8±0.8 TOT 3.6±0.8 Leuliette and Miller (2009) STERIC 0.8±0.8 MASS 0.8±0.5 TOT 2.4±1.1(2.7±1.5) Cazenave et al. (2009) STERIC 0.37±0.1 MASS 1.9±0.1 TOT 2.5±0.4 Chang and Willis fail to close the budget and interestingly fail with pretty much the same numbers. Leuliette and Cazenave manage to close the budget but by very different means. Leuliette through an equal contribution from steric and mass. Cazenave primarily (80%) through mass. If we look at all the available estimates there appears to be no real concensus on this issue.
    0 0
  16. 59.Dappledwater You seem to have mixed up the sources of your quotes but I get your point about regional variation. Figure 7 from Merrifield does suggest that the lack of good data in the southern and tropical oceans prior to 1950 comprises all comparisons of early and late 20th century SLR. It looks like the experts like to compare apples and oranges as well.
    0 0
  17. HR @ 66 - Oh I see, just confusing the way I phrased it. The whole paste is from Leuliette & Miller. However, I see you've also mixed up @ 65. Willis & Chang don't appear to have the same numbers at all, assuming your paste is correct. As far as the sea level budget, nope doesn't seem to be resolved quite yet, but clearly there was a slow down in sea level rise from 2003 - 2007, driven largely by ENSO. If you have a look at Cazenave 2010 Contemporary Sea Level Rise figure 2 (the satellite altimetry record 1993 to 2008) the dip in sea level rise around 2007/2008 is very evident & coincides with a couple of decent sized La Nina's. For the satellite era Cazenave finds: "Accounting for the small correction of −0.3 mm year−1 due to global deformation of ocean basins in response to GIA (Peltier 2009), we thus get a rate of global mean sea level rise of 3.4 ± 0.4 mm year−1 over 1993–2008."
    0 0
  18. HR#65 Dappledwater #67 Nice summary of the 2003-2007 SLR scene HR. Notice that the only paper which has the steric rise anywhere near the mass rise is Leuliette and Miller (2009) with a 0.8+/-0.8mm for steric and 0.8+/-0.5 for mass. I wonder at the value of a measurement which has error bars equal to the value. If I expressed my height as 1.8m +/-1.8m, you would not know if I were a giant or a midget. If the mass far exceeds the steric, the energy budget shortfall gets rapidly worse. And Dappledwater (DW in short in future): pray tell us if the decent sized La Nina's are sending heat out to space or redistributing heat around in the Earth system (atmosphere, land, ice, oceans)?
    0 0
  19. HumanityRules at 02:23 AM on 1 September, 2010 The overall satellite trend offers true global coverage, but it is a relatively short record, though Wenzel 2010b has made an an interesting attempt to bridge the gap between Topex and GEOSAT altimeter data (1986 to 1989). The recently re-processed (corrected) altimeter datasets from Ssalto/Duacs which now includes GDR-C reprocessing for Jason 1 are now available. The overall 17 year trend, which must include GIA corrections if we are to compare with the corrected tidal values, is around 3.3 +/-0.4mm/yr. Peter B and Ken, for the record (once again), Topex/Poseidon runs to Autumn 2005, Jason 1 runs from beginning 2002 to present, Jason 2 runs from half way through 2008. Thus there is overlap which allows correction for (some quite large) offset biases. The real absolute raw offsets make any talk of “offsets” in the accessible data more than a little academic. The trends for Topex/Poseidon, Jason1, and Jason 2 (including GIA) are 3.5mm/yr, 3.0mm/yr, and 3.1mm/yr respectively. Peter Bs figures showing a split between Poseidon and Jason1 data, (and hence the trends and offset) are incorrect. In addition the uncertainties in these separate trends will certainly be greater than the 0.4mm/yr error bars for the overall series. Any suggested decrease in overall trend is therefore not significant from this data. Nevertheless, why might the interannual trends vary over short periods? As Dappledwater has mentioned, ENSO. From Nerem 2010 showing de-trended Global MSL compared to MEI (Multivariate ENSO Index). The correlation of MSL interannual variations with ENSO is significant at the 95% level over the altimeter period. This kind of variation is also observed in the tide gauge records, whose interannual variations follow global and local regional climate patterns. This is why we must take the overall satellite record and use all of the data, rather than chop the record into arbitrary mini-trends. This is why we should if possible look over longer periods than the 17 year satellite record to determine MSL acceleration (which is significant over the tidal record we have). Ken Lambert at 23:33 PM on 30 August, 2010 The GDR-C altimeter re-processing is also relevant because (from Nerem 2010) the “GDR-B bias error in Jason1 was large enough to cause GMSL from GDR-B data to be nearly 1 mm/year too high for the period from July 2003 until June 2007, which partially explains the misclosure of the sea level budget between Jason-1, GRACE, and Argo (Willis et al. 2008; Leuliette and Miller 2009)”. To some extent this answers your point (which quoted values from Sea level budget from Trenberth based on this same 2003 to 2007 data). If this is changed to something like the 1993 to 2007 value for thermal expansion (table 1 Cazanave 2010) the sea level budget appears to close, but I’m sure there will be a paper or two on this pretty soon.
    0 0
  20. Ken Lambert (henceforth KL) @ 68 - "And Dappledwater (DW in short in future): pray tell us if the decent sized La Nina's are sending heat out to space or redistributing heat around in the Earth system (atmosphere, land, ice, oceans)?" Sounds like a silly question to me KL. The answer is of course - 42. Ever wonder why the global sea level rises and falls in response to ENSO KL?. Like El Nino for instance, wasn't that heat already in the ocean?. KL @ 60 - I'll just put to one side your misrepresentations of the satellite trends, that donkey is so dead it's fossilized. Others have explained that sufficiently IMO. As to the energy budget, yeah looks to be a lot missing (maybe) Looks like you're not the only one concerned about the inability to account for it (yet). Kevin Trenberth: Where's the missing heat? KL if the missing heat is way down deep (I recall Chris steering toward some papers on the topic) then it'll soon be coming to an atmosphere near you. (The word "soon" being very subjective - and no relation to Willie)
    0 0
  21. HR writes: Ned's post does say 5.4mm/4.9mm "compares very well" with 3.3mm. More generally with regard to acceleration we are arguing over a change in SLR of ~1.5mm/year, I was just saying on Ned's basis 1.8mm "compares very well" with 3.3mm. First, the main point of my comment was to show that the Jo Nova post cited by Miekol was deeply misleading. Ms Nova was trying to convey the impression that satellite measurements of sea level rise are contradicted by data from in-situ sea level monitoring stations in the Pacific. This is quite wrong. Anyone looking at the data Ms Nova refers to, or reading the annual reports from the station network in question, will quickly see that all of the stations in that network show rising sea levels, and that the text of the annual reports explicitly states that the observed sea level rise is consistent with measurements from satellites. It would be nice if Miekol, or HR, would recognize that. With that out of the way, HR does seem very interested in the claim that a mean sea level rise of ~5 mm/year at various South Pacific stations is "consistent" with a global sea level rise of 3.3 mm/year from satellites. HR uses this comment to claim that a lower rate of 1.8 mm/year (over the 20th century as a whole) must also therefore be considered "consistent" with the current rate of 3.3 mm/year ... the point being, apparently, to establish that there hasn't been any acceleration in sea level rise. Now, IMHO that is a very confused argument, one that will probably not stand up well to dissection. The "consistency" between 5 mm/year at Pacific island stations and 3.3 mm/year in the global satellite record comes from the fact that sea level is known to be rising faster in the Southwest Pacific than the global average. In fact, if you look at the map shown in Figure 3 of Peter Hogarth's excellent post here, you will see that from 1993-2008, sea level rose by 5 cm to 15 cm in this region. That works out to a satellite-derived estimate of 3.3 to 10 mm/year for regional sea level rise in the Southwest Pacific. It seems to me that 5 mm/year (from the island stations) is perfectly consistent with 3.3 to 10 mm/year (from the satellite record). Does that make sense now, HR?
    0 0
  22. 67 Dappledwater 1) As I say I recognise the point you were making. Large differences in ocean basins means estimates will be completely misleading unless we have data from all basins. This doesn't look good for the early tidal gauge data the Merrifield Figure 7 is enlightening. In fact there is a hint in Leuliette and Miller that Willis estimates of OHC in 2003 are biased by low spatial coverage of Argo in the southern oceans. Imagine what the pre-1950 bias toward the northern hemisphere is doing to tidal gauge measurements then. 2) Looking at the error margins all three estimates from Chang and Willis overlap. This is how Leuliette and Miller justify that 1.5 steric + mass balances is the same as 2.4±1.1 for the total SLR. It seems a fair thing to do. 3) I'm not disputing the general 3.4mm/year over the satellite period. I'd be more concerned with the comparison of this to the early tide gauge era based oo the reason contained in 1). I'm still curious why the 1992-2010 satellite data shows no acceleration over this longish record, we can see the fingerprint of AGW in climate change metrics, why not this one. It seems the story goes the rate was somewhere around 1.5mm/year for much of the 20C, this was measured as a consistent rate upto the end of the 1980's. In the 1990's the rate jumped to 3.4mm/year and if we take the satellite data as the best, the rate has continued like that for 2 decades. It seems difficult to understand how this fits with the real world. (Pleased somebody tell me why the satellite data isn't showing an acceleration when OHC and land ice melt are accelerating?)
    0 0
  23. 71 Ned Sorry I don't read what Jo Nova has to say. I'm prepared to accept your assessment of her as little more than a propagandist if you want.
    0 0
  24. 69 Peter Hogarth that's great Peter, I don't think I dispute what you write about the satellite record but I will hold you to a global, 18 year data set being a "relatively short record" when we clash over data sets in future posts. Please tell me why we don't see any acceleration in the satellite record.
    0 0
  25. HR @72 - The satellite data for global sea level is inclusive of the period 2005- 2009 is it not?. Look at the graphic provided at @70 (from UCAR/NCAR) & the video from Kevin Trenberth. What acceleration are you referring to?, OHC has declined from 2005. Doesn't that go some way toward answering your question @72 & repeated again @74?. Unlike many skeptics, who are always dead keen to throw the baby out with the bath water, the missing heat concerns me. Many climate scientists, and I'm of a similar view, expect that there may be a few surprises the climate has in store - is this one of them?. Has some significant change occurred in the deep ocean that we're as yet unaware of?, and will (as Kevin Trenberth states) this come back to haunt us?. I hope not, but as far as I'm aware the "missing heat" has yet to be accounted for.
    0 0
  26. HumanityRules at 14:18 PM on 3 September, 2010 If ENSO is affecting MSL variations about the longer term trend then we need records longer than a couple of maximum ENSO "cycles" to begin to be able to determine any underlying acceleration trend that is not biased by this variability (to do with Nyquist criterion, sample rate theory, - hope this makes sense). Looking over the longer term, I was trying to create a chart showing annual trend of 17 year gradients throughout the tidal/altimeter record, which I hoped would answer (or allow more informed discussion on!) your point as well as the valid ones Ken made earlier on the 1930s/1940s rise rate. However I realized Church 2008 has already done something similar with 20 year trends: Whether we tack on the 3.3mm 17 year altimeter trend to this or not, we see that there is an accelerating trend throughout the overall record, relatively high acceleration in the early 20th century, and more recent acceleration in the late 20th century. These trends and possible causal factors are discussed in more detail in Woodworth 2009.
    0 0
  27. DW #70 Before we get into repetition please have a look at this topic from May this year: http://www.skepticalscience.com/news.php?p=2&t=78&&n=202 Note my posts #24, #30, #60, #67 - particularly #67 I came across Dr Trenberth's paper as a result of the Climategate 'travesty' emails, and have a passing familiarity with it since late 2009. If 'the missing heat' is way down deep it got there very quickly by an unknown process DW, so don't hold your breath waiting for it to burst forth.
    0 0
  28. Ken #77 While you insist on bringing up old arguments, perhaps you can explain why you haven't been able to deal with people's rebuttals of such adequately, for example here. Also you have completely failed to ever acknowledge issues surrounding measurement error.
    0 0
  29. KL @ 77 - This seems to be a recurring theme with you. You have done this to death on other blogs as well I see. So the repetition is all your doing. Yes, I agree, the media and skeptic beat up of the stolen e-mails was indeed a travesty, but global warming continues, despite the "current"uncertainties in the analysis of the global energy budget. As, for the missing heat, seems unlikely to me that's it's found it's way down in the deep ocean, so quickly (no known mechanism for starters) , more likely an "accounting" error, or errors. But sure is strange how it shows good agreement until about 2005. I am genuinely curious to see how this issue is resolved though.
    0 0
  30. DW #79 We can agree on the most important point then: Its unlikely that the 'missing heat' has found its way into the deep oceans quickly with no known mechanism.
    0 0

Prev  1  2  

You need to be logged in to post a comment. Login via the left margin or if you're new, register here.


The Consensus Project Website

THE ESCALATOR

(free to republish)


© Copyright 2024 John Cook
Home | Translations | About Us | Privacy | Contact Us