


 Arguments


An update on methane emissions from fracking (in the US)
Posted on 30 August 2016 by gws
A relatively large number of research publications has appeared in the peer-reviewed literature since we last updated our readers on fracking and methane, CH4, emissions. We cannot discuss them all here. However, in summary, it can be concluded from these papers that EPA is very likely underestimating fossil fuel related methane emissions in its greenhouse gas inventory, anywhere between 30% and 100%, possibly even more. Meaning, in order for the US to effectively lower its greenhouse gas emissions, it also needs to get fugitive methane emissions under control.
The EPA inventory
The US administration has reacted to the new data, and EPA issued a number of regulatory actions. In addition, EPA has begun to update its inventory. However, a look at the inventoried totals …
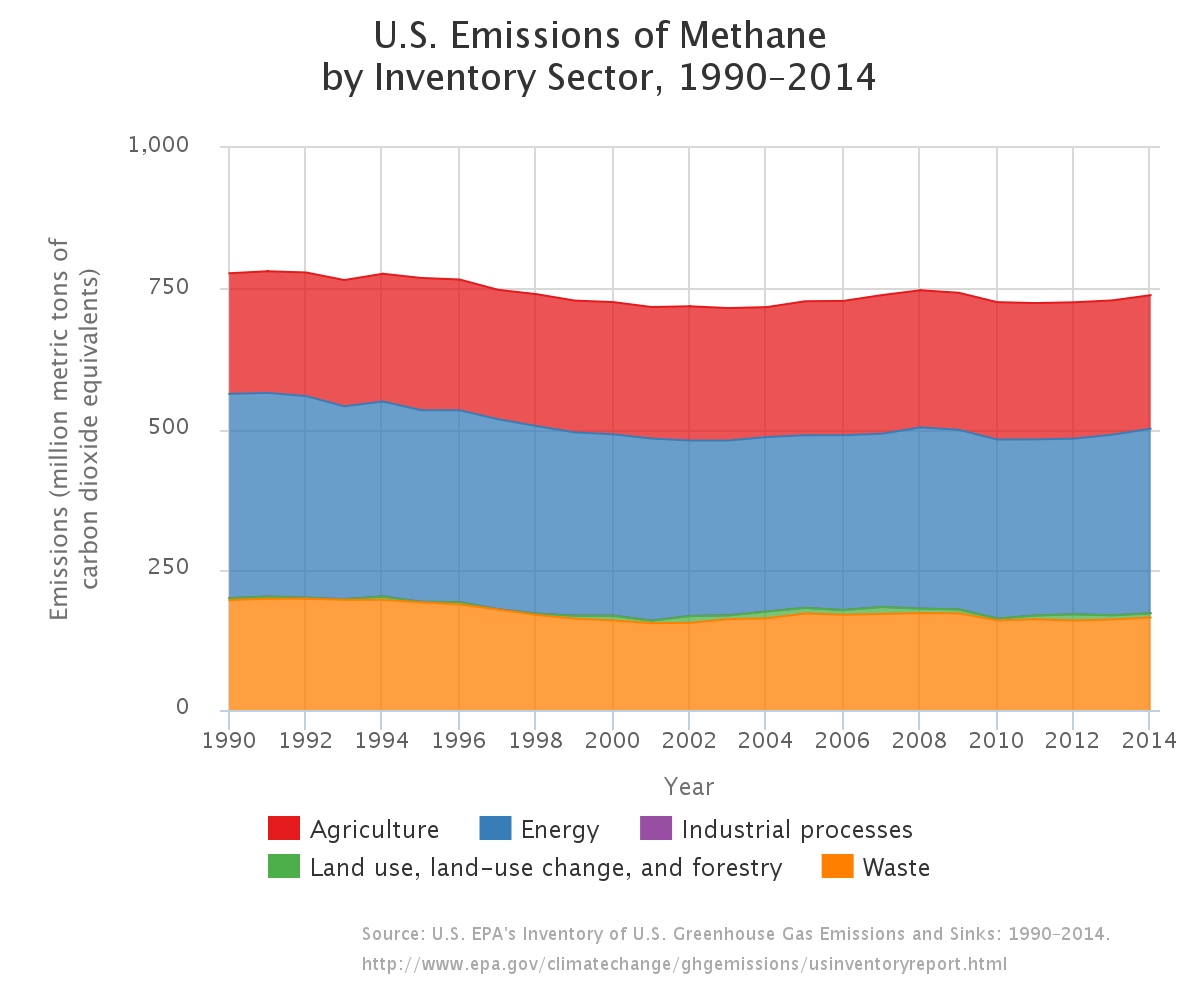
… and the “energy” related emissions …
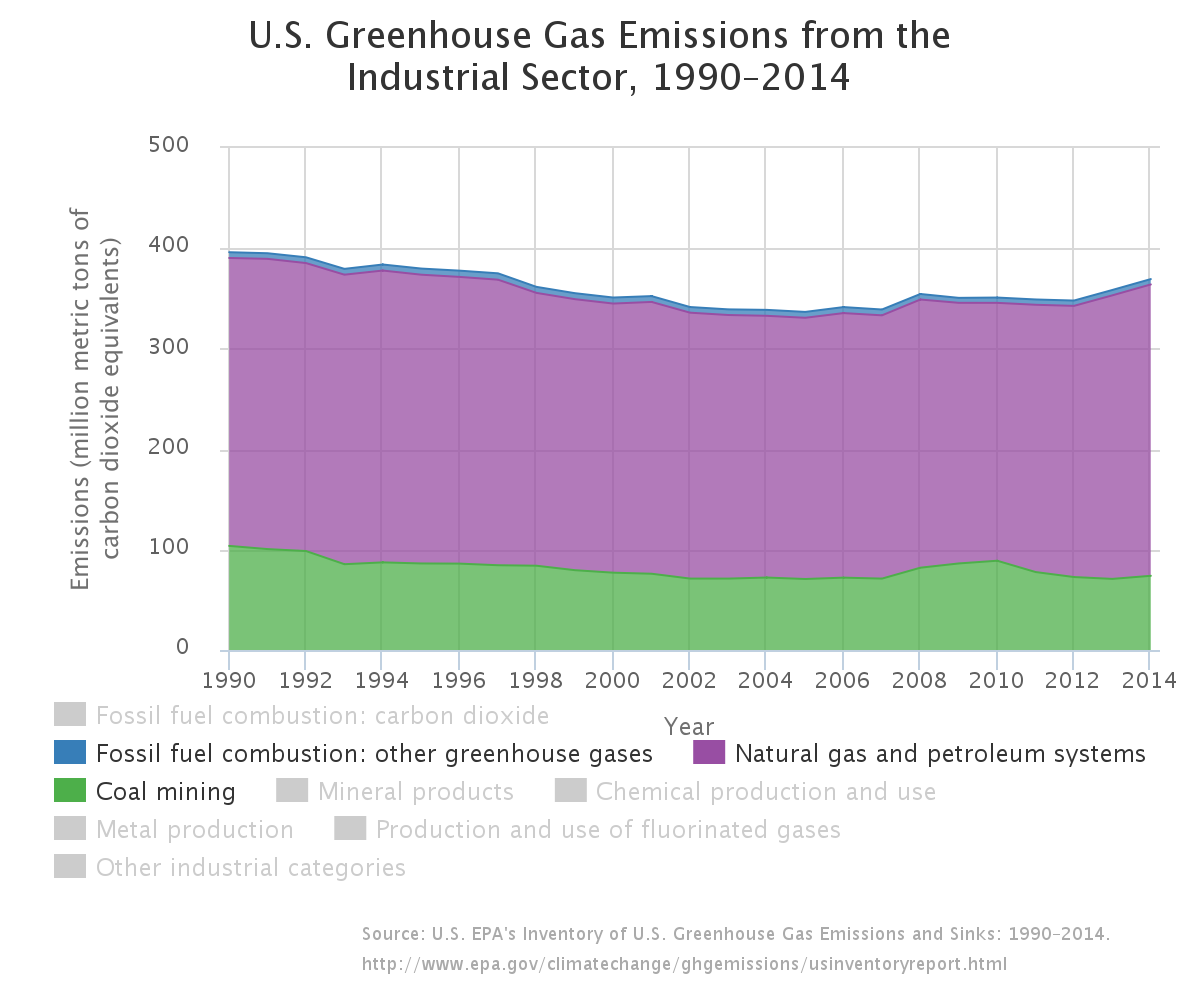
… suggests that inventoried methane emission totals have not been increasing over the last ten years. Decreases in “waste” related emissions (primarily from landfills) have been counteracted mostly by increases from “agriculture” related emissions (mostly exhaling cows) and increases in “energy” related emissions.
Reality
Meanwhile, global atmospheric methane concentrations continue to rise. There is evidence from satellite observations that US emissions have increased by 30% or more in the last decade, and a substantial amount of the global increase could be explained by increasing US emissions.
 (from Turner et al.: 2016: A large increase in U.S. methane emissions over the past decade inferred from satellite data and surface observations, DOI: 10.1002/2016GL067987)
However, there is also indirect isotopic evidence that the global increase is dominated instead by a biogenic source, with the authors highlighting agriculture in East Asia. The latter is somewhat corroborated by where most of the atmospheric methane seems to come from, namely the tropics, but there remain large estimate ranges in part due to limited measurement capabilities at tropical latitudes.
Global vs. Regional
Independent evidence comes from global observations of atmospheric ethane, which turns out to be an excellent tracer of fossil fuel related hydrocarbon emissions. While ethane’s abundance had been dropping for decades as the industry’s fossil fuel exploration activities had been becoming more efficient, it appears to be increasing in the atmosphere again, with especially high emissions from shale regions that produce oil. The Nature Geoscience authors estimated an ethane emissions increase of approximately 0.4 million metric tons per year, seemingly all from North America. Since, ethane is typically five to ten times less abundant relative to methane in oil and gas sources (on a molar basis), one can estimate an annual methane emission of 1-2 million metric tons from that, with a likely range of 0.5-4 million metric tons CH4 (Helmig et al. estimate a lower median ethane-to-methane ratio, thus arrive at the upper end of this range). That turns out to be about 5-10% (at most about 25%) of the observable global annual increase of methane in the atmosphere (virtually all of it in the northern hemisphere), and is therefore roughly consistent with the above notion from isotopic analysis that the renewed global methane increase is not dominated by increasing fossil fuel related emissions.
However, an additional 1-2 million metric tons of methane per year is equivalent to 25-50 million metric tons of CO2 equivalent using methane’s 100-yr global warming potential adopted in 2007, which the EPA is currently using for international compatibility reasons. As is obvious from EPA’s graphics above, the current growth rate estimated by EPA is much smaller, actually around 10 million metric tons of CO2 equivalent for the “energy” sector. While I consider it unlikely that EPA is off by a factor of 5, this clearly shows that its estimates are still woefully off the mark.
Ethane was also used in another study to estimate that, globally, relative leak rates are likely in the 2-4% range, and Carbon Brief has just summarized some data to show that the US and Russia are among the worst offenders.
The "super-emitter" story
Part of the reason for the discrepancy to inventories comes from what has been dubbed “super-emitters”; the fact that the distribution of emission rates from the plethora of individual sources in the oil and gas industry (such as leaking valves, tanks, compressors, etc.) is poorly characterized by a well-behaved bell-curve. Instead, emissions appear to be dominated by a relatively small subset of high emitting sources, creating highly skewed emission rate distributions. This has been discussed in various research papers, such as here, here, here, and a presentation by Stanford University’s Adam Brandt here.
It turns out that hydrocarbon emissions from storage tanks are a major source, a source however, that could rather effectively be abated, and that has been known for many years, with EPA addressing “VOC new source performance standards” as early as 2012. This has yet to make a difference, because it addresses only new, not existing sources (including storage tanks).
Since EPA is not accounting for super-emitters through a skewed emission rate distribution, it is blind to their emissions.
In addition, since EPA’s inventory is based on a classical bottom-up calculation that relies on input data from individual, small-scale measurements such as performed by industry itself and in industry’s favorite peer-reviewed study, it is useful to point out that a significant subset of those measurements have been shown to be biased low.
What does it all mean?
Keeping global warming below 2 degrees Celsius relative to pre-industrial average surface air temperatures requires keeping most of the known fossil fuel reserves in the ground. The term “unburnable carbon” has become widely used to describe how much fossil fuel assets could become stranded assets in the coming years, were we to follow the goals as laid out by the Paris agreement. While industry is heavily promoting the replacement of coal with natural gas to lower CO2 emissions from electricity production, now, an additional caveat has been proposed, namely that the amount of unburnable carbon is in fact even larger considering the amount of methane that may be leaked while exploring the fossil carbon already on the books (aka “burnable carbon”). The authors call it “unleakable carbon”, stating that
“We demonstrate that unless unleakable carbon is curtailed, up to 80–100% of our global natural gas reserves must remain underground if we hope to limit warming to 2°C from 2010 to 2050.”
Their best case scenario assumes that relative leak rates, globally, are about 50% higher than what EPA currently estimates (based on Brandt et al., 2014). Since we know by now that even that could be too optimistic, it becomes more and more obvious that a switch from coal to natural gas for electricity production is not likely to curb global warming effectively, but rather delay effective measures further.


"According to a weekend report in The Wall Street Journal, 85% of Texans support expanded renewable generation and only 9% opposed continued expansion." Read More
People are getting the message even in states that are historically pro oil and gas.
EPA underestimation of US CH4 emissions is compounded by underestimation of the effects those emissions have on global warming.
The EPA insists that in determining the effects of CH4 emissions should be calculated on the basis of the GWP of CH4 calculated over a 100 year period. This dictate has been adopted by most climate scientists.
It ignores the fact that CH4 emissions to the atmosphere have a life of no more than 12 years, during which time its GWP = >85, considerably higher than the 34 ascribed to CH4 by the IPCC (assuming a 100 years life span) or the more common 27 used by the EPA.
There is no scientific justification for selecting a 100 years span when calculating the GWP of CH4 to determine its contribution to global warming. However, a political imperative, the need to minimise the effect of US CH4 emissions on global warming, most certainly does exist and is addressed by minimising the GWP of CH4.
Some readers may think that science is about determining the truth, not manipulating it for the sake of political expediency.
[JH] Please document the sources of the information that you have presented and the bases for the assertions you have made. In other words, pretend that you are a scientist and not just a blowhard.
Although some of its contents is outdated, the new paper in PNAS basically confirms the above calculations. For instance, they estimated an increase in annual methane emissions from fossil fuel sources of 21 Tg (terragrams, (same as millions tons per year) over the 2000s, which is at the upper end of the 1-2 million tons of anual increase accumulated over 10 years. Other results differ from the competing isotopic study in Science, so I guess we will have post another update some time next year ...