Climate Science Glossary

Term Lookup

Enter a term in the search box to find its definition.

Settings

Use the controls in the far right panel to increase or decrease the number of terms automatically displayed (or to completely turn that feature off).

Term Lookup

Settings


All IPCC definitions taken from Climate Change 2007: The Physical Science Basis. Working Group I Contribution to the Fourth Assessment Report of the Intergovernmental Panel on Climate Change, Annex I, Glossary, pp. 941-954. Cambridge University Press.

Home Arguments Software Resources Comments The Consensus Project Translations About Support

Bluesky Facebook LinkedIn Mastodon MeWe

Twitter YouTube RSS Posts RSS Comments Email Subscribe


Climate's changed before
It's the sun
It's not bad
There is no consensus
It's cooling
Models are unreliable
Temp record is unreliable
Animals and plants can adapt
It hasn't warmed since 1998
Antarctica is gaining ice
View All Arguments...


Username
Password
New? Register here
Forgot your password?

Latest Posts

Archives

Should The Earth Be Cooling?

Posted on 17 September 2010 by Michael Searcy


Current Climate Running Against the Grain

When considering whether or not the human influence on the Earth’s climate is discernible, one of the immediate questions that comes to mind is, “What would the climate be doing in the absence of human interference?”

Easterbrook Quote

Indeed all climate models strive to identify the impact of natural mechanisms as compared to anthropogenic, or man-made, ones. The general conclusion has been that models of strictly natural influences do a pretty good job at reproducing real world, pre-industrial climate conditions but that the influence of mankind must be incorporated in order to reproduce the climate conditions of the industrial era. But at what point does the human component overwhelm its natural counterparts, when Mother Nature says we should be going in one direction while reality is going the opposite?

While it’s impossible to know exactly what the climate conditions would be in the absence of mankind, we should be able to get a pretty good sense of at least whether or not the global climate would be warming or cooling. The simplest method to make this determination is by examining the trends of a few major natural mechanisms that influence the climate, namely solar irradiance, the El Niño Southern Oscillation (ENSO), and the Pacific Decadal Oscillation (PDO).

Solar Irradiance, ENSO, and PDO

Shifts in solar irradiance generally follow the Sun’s roughly 11-year sunspot cycle, but the magnitude of these cyclic changes is quite small. However, longer term, multi-decadal trends of rising or declining solar activity can have notable climatic impacts here on Earth. Longer periods of high solar activity or dormancy are often associated with the Medieval Warm Period (MWP) and the Little Ice Age (LIA) respectively.Wolter Quote
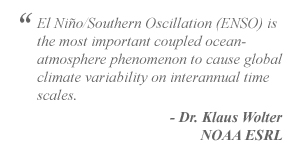
ENSO and PDO both refer to oceanic and atmospheric patterns in the Pacific Ocean, but they differ from one another. ENSO focuses on conditions near the equator. These conditions alternate between warmer (El Niño) and colder (La Niña) phases, with individual phases lasting from a few months to a year. Each phase can have a noticeable impact on global temperatures, with El Niño conditions driving temperatures higher and La Niña having the opposite effect. A particularly strong El Niño in 1998 is credited with pushing global temperatures to some of their highest levels on record.

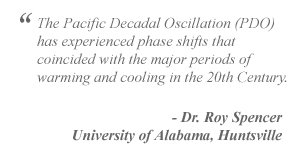
Similar to its equatorial cousin, the northern Pacific PDO alternates between warm and cold phases with a warm PDO encouraging warmer temperatures and a cold PDO the opposite. While its phases are less predictable than ENSO they can last much longer, up to multiple decades.

Examining the Last 30 Years
Spencer QuoteSo what has been going on with these three significant and natural climate drivers, particularly when compared to the warming influence of human industrial carbon dioxide (CO2)? NOAA's National Climatic Data Center (NCDC) states, "The average value of a meteorological element over 30 years is defined as a climatological normal," so let’s examine the current 30-year history of each of these natural mechanisms and their respective influences on the global climate.

Figure 1 below depicts the 30-year trend from 1979 to the present of solar irradiance, ENSO, PDO, and atmospheric carbon dioxide. Each trend has been normalized in order to facilitate comparisons on equivalent scales. Each graph also includes the general warming or cooling influence of the trended data on Earth’s climate. Lastly, the normalized trend of global temperatures over the last 30 years is included.

Climate Forcings (Last 30 Years)

Figure 1: 30-Year Climate Forcings - Solar Irradiance, ENSO, PDO, Atmospheric CO2

Based on the combination of decreased solar activity, a steady ENSO and a declining PDO over the last 30 years, we would expect to be experiencing a cooling climate. However, despite this opposition from multiple natural factors, global temperatures have risen throughout this time period as the concentration of atmospheric CO2 has escalated. Nature indicates the planet should be cooling. The reality has been just the opposite.

What Do Climate Models Say?

But do the climate models concur with this divergence?

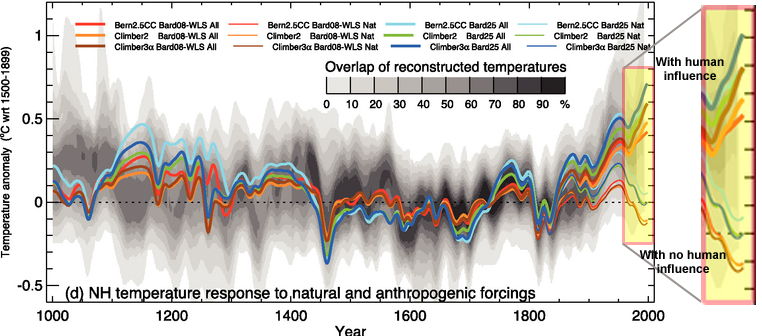
Figure 2 is an excerpt from the IPCC’s 4th Assessment in 2007. Depicted is the output of three climate models. Each model was run reflecting just natural climate influences and also with the inclusion of anthropogenic influences. The different model runs are depicted in color with those reflecting natural+human factors shown in bold. Actual conditions based on direct measurements and proxies are reflected in the background gray range.

Climate Models

Figure 2: Climate models, Figure 6.14, IPCC AR4 WG1 (Click for larger)

Examining the model outputs, as the world enters the industrial age, the models begin to show a split between the results from purely natural influences and those from natural+human factors. However, while the overall trends begin to diverge, the shorter term fluctuations remain in agreement. As the natural result warms, the natural+human result warms. As the natural result cools, the natural+human result cools.

Then things change.

Over the section of the model runs depicting the last 30 years or so, the two model run types diverge completely. While the natural results show a distinct cooling trend in line with the actual observations of solar irradiance, ENSO, and PDO, the results from the natural+human runs show a marked warming trend. This divergence is highlighted in the figure.

Looking at both the actual observations of historically significant climate forcings including solar irradiance, ENSO and PDO and the results from model runs depicting solely natural climate influences, we would expect our planet to be notably cooling.

However, examining climate models including both natural and human influences, we would expect a continued warming trend over the last 30 years.

Which is exactly what's been happening.

0 0

Printable Version  |  Link to this page

Comments

1  2  Next

Comments 1 to 50 out of 70:

  1. How much warmer might it be if the sun hadn't been so quiet for the last several years?
    0 0
  2. Re #1, Global SATs might have been up to about 0.1 C higher had the sun not been so quiet. Don't quote me on that though.
    0 0
  3. Re: (1 & 2) That matches what I've read (0.1 differential between minima and maxima, IIRC). If I wasn't fighting an ear & sinus infection (plus, to be honest, laziness) I'd look it up for you. The Lazy Yooper
    0 0
  4. Can it be clarified that the solar irradiance being referred to is that measured at the outer atmosphere and not that as received at the earth's surface. If it is the sun's output is being considered, that cannot be considered in isolation without taking into account any changes due to the effects of clouds, as clouds are a major factor determining the amount of solar radiation that reaches the earth's surface, which is where it matters. With reference to the PDO, looking at it from the Australian perspective, it also cannot be considered in isolation without considering how it interacts with all other ocean and atmospheric patterns, in particular for Australia those in the Indian Ocean. Prior to the identification of the Indian Ocean Dipole,IOD, it was considered that the systems in the Pacific Ocean were the major drivers of Australian climate. Many people could not understand this as it went against what was readily observed, in that it was from the west that all weather originated from. However once the IOD had been identified it became clear that the systems in the Pacific Ocean were not nearly as influential over Australia as previously thought, and much of what had been attributed to those systems actually were due to systems cycling in the Indian Ocean. At times the systems on either sides of the continent complemented each other driving the nett effects higher, whilst at other times they tended to reduce the nett effects. Since this identification of the IOD the understanding of events that affect the Australian region, past and present, and indeed of all regions that bound the Indian Ocean has increased significantly, and I believe that studies are being done to re-evaluate whether those systems in the Pacific Ocean are as influential as previously thought, at least for this region. With regards to CO2, given natural processes are deemed to be accounting for half of the anthropogenic emissions, it has to be considered whether or not the natural processes have increased in response to the additional CO2 emissions, and if so what has caused this, or if nothing has driven them higher, what would be the effects of 2ppm CO2 being stripped from the atmosphere each year for the last 150 years since industrialisation began.
    0 0
  5. Of course the TSI trend is accounted for by just the past few year's decrease. And in fact, the linear trends for most global measures of temperature since 2002 do indicate cooling: RSS_MT -1.29 K/century UAH_MT -0.25 K/century RSS_LT -0.15 K/century CRU -0.53 K/century CRU SST -0.46 K/century While these indicate warming: UAH_LT 0.37 K/century GISS 0.35 K/century
    0 0
  6. johnd - change reflectivity is albedo. For change in this, try albedo effect. Trend is hard to be sure about but note the SCALE of the change. If there is any change its small.
    0 0
  7. #5: "And in fact, the linear trends for most global measures of temperature since 2002 do indicate cooling:" So you suggest that climate is to be determined by less than 8 years of data? From which you can extract a gradient in degrees per century??? Looking at a recent RSS file, for example, does indeed give a linear trend with negative slope for the cherry-picked period of 1/2002-7/2010. But the R^2 of such a line is 0.0038. That's not worth much. Try a longer time period, say 1979-2010 (the extent of the UAH/RSS data set). Your cooling trends will go up in a puff of CO2.
    0 0
  8. Re: ClimateWatcher (5)
    "And in fact, the linear trends for most global measures of temperature since 2002 do indicate cooling: RSS_MT -1.29 K/century UAH_MT -0.25 K/century RSS_LT -0.15 K/century CRU -0.53 K/century CRU SST -0.46 K/century While these indicate warming: UAH_LT 0.37 K/century GISS 0.35 K/century"
    That's odd. This is what the RSS Website shows: RSS_LT 0.163 K/decade or 1.63 K/Century RSS_MT 0.099 K/decade or 0.99 K/Century RSS_TS 0.005 K/decade or 0.05 K/Century RSS_SL -0.313 K/decade or -3.13 K/Century Smelling a cherry pick, opted for the quick, down-and-dirty Eyeball Mk. 4 method from here on. This is from CRU.: CRU 0.80 K/century (eyeball Mk. 4) CRU SST 0.70 K/century (eyeball Mk. 4) This is from GISS.: GISS 0.80 K/century (eyeball Mk. 4) Didn't even bother with UAH. Pointless. Unless you're looking at all of the data available, or at least snippets of 30 years or more (or you can demonstrate high correlation values that are statistically significant), you're wasting our time. The Yooper
    0 0
  9. You have to be very careful about any "trend" in the TSI data, because of the strong 11-year cyclic nature of it. Any trend should be based on an integer number of cycles, so 22 or 33 or 44 years. Otherwise the partial cycle will influence the trend. That said, the bit of extra cycle you chart would tend to influence the trend upward, and yet the overall trend is down...
    0 0
  10. One major wild card I would add to your discussion is ocean heat content (or if you prefer, ocean cold content-just to be language-neutral), and the current disagreements (ie non consensus) surrounding this.
    0 0
  11. #10: "ocean heat content (or if you prefer, ocean cold content-just to be language-neutral)" Nope, it would be heat content. Cold is the relative lack of heat energy and therefore not something that can be contained. Just to be language-correct. Why would non-consensus over OHC matter in this context? We're not talking about a global energy balance; we're talking about the observable temperature increase which already includes whatever the oceans are doing.
    0 0
  12. >Unless you're looking at all of the data available, or at least >snippets of 30 years or more (or you can demonstrate high >correlation values that are statistically significant), you're >wasting our time. Great. Don't say that it's not cooling though, because using this criteria, you'll have to wait thirty years.
    0 0
  13. Re: ClimateWatcher (12)
    "Great. Don't say that it's not cooling though, because using this criteria, you'll have to wait thirty years."
    To reiterate, using data from 1979 to 2010: RSS_LT 0.163 K/decade or 1.63 K/Century RSS_MT 0.099 K/decade or 0.99 K/Century RSS_TS 0.005 K/decade or 0.05 K/Century RSS_SL -0.313 K/decade or -3.13 K/Century (stratospheric cooling, as predicted by the physics of greenhouse gases) Using data from 1900 to 2000: CRU: CRU 0.80 K/century (eyeball Mk. 4) CRU SST 0.70 K/century (eyeball Mk. 4) GISS: GISS 0.80 K/century (eyeball Mk. 4) To paraphrase Shakespeare: the Trend is the thing. The trends, using 30 or more years of data, all show the hallmark of the effects of GHG accumulations (significant warming in the oceans and troposphere, cooling in the stratosphere, northward expansion of the Hadley cells, 10 mile-per-year northward relocation of the northern polar jet, mass-loss in the GIS, the WAIS AND the EAIS, acidifying seas, 40% loss of oceanic phytoplankton in the last 40 years, etc). And doing it over the last 30 years, during which TSI has been flat or down, GCR's have been flat, UHI invalidated and aerosols have been retarding the forcings from GHG's to some degree (meaning: temperature increases and resultant negative effects should've been worse than observed). Therefore, looking at 30 or more years of data which also covers the period to date, IT'S NOT COOLING! This focus on short-term noise/variability does you a great disservice. The Yooper
    0 0
  14. muoncounter #7 Just the fact that we are all niggling about whether the Earth is slightly heating or cooling over the last 8-15 years, or whether it is statistically significant is pretty good proof that the theory of CO2GHG forcing as the main driver of global warming is in serious trouble. My understanding of events such as ENSO, La Nina, PDO, AMO are internal to the Earth system - they are re-distributors of heat energy already there; and not a cause of external forcing imbalances globally gaining or losing heat. The 11 year cycle in the TSI curve is well documented and effectively a +/-0.5W/sq.m ripple on complex long term Solar-Earth cycles. In the absence of other AG forcings (including aerosol albedo effects) we need to know the value of TSI which produces no heating or cooling of the Earth system. Then we can easily calculate whether a reduced TSI (excluding the 11 year ripple) is above or below the 'zero' forcing value. Just showing a downtrend in TSI (as in the chart above)means that heat gain from solar radiation is less than it was; but not necessarily less than the 'zero' forcing value - which would still mean net heat gain but at a lower rate from TSI alone rather than cooling (or heat loss). You then need to assess the values of the other AR4 AG forcings - the most uncertain being cloud and aerosol albedo cooling (currently 2005 at -1.2W/sq.m with wide error bars). I would be having a small wager on reduced TSI warming, greater albedo cooling and a smaller CO2GHG warming effect than theorised by the IPCC all producing flat temperatures over the last 8-10 years; further evidenced by little gain in OHC as measured by an imperfect Argo.
    0 0
  15. There is a long term cooling from the holocene maximum due to orbital forcing. Over a millenium it mounts up. I have only looked this up on Wikipedia however. I believe at present the effect is smaller than in the past. A small fall in temperature over the last 1000-2000 years as indicated by proxy reconstructions and models is consistent with this. If someone has literature references giving reasons for the trend of the last 1000-2000 years, (eg. consistentcy with post holocene cooling) then it may be worth adding to this article. The literature may posit other reasons/observations worth posting too for a millenial scale trend.
    0 0
  16. ClimateWatcher, trends from 2000 to present for all temperature data sets show warming. Same goes if you select any year prior. There's a mix of results up to 2005. Then, from 2006 onwards, all data sets show warming again. Here are the trends from 2006. HadCRUt - 1.8K/century GISTEMP - 2K/century UAH - 4.6K/century RSS - 4.1K/century As you can see, warming has recommenced at an alarming rate. Or....? The top post is about climate trends (20 - 30 years). As your time periods are not climatic, what is it that you are talking about? Even in a clearly warming world, we will always get reruns of 'no warming since 1998'. The meme will stay the same, only the date will change. 2002 was the favourite for a while because a year or so ago, all the data sets showed a negative trend. In a few more months the 'skeptics' will be obliged to cherry-pick a more recent year.
    0 0
  17. mdenison makes good points about the longer term (millennial or longer) cooling trend. Wanner et al. 2008 provides a nice overview of climate change from the mid-Holocene to the start of the industrial era. There was a long, slow cooling trend in NH summers, due to orbital geometry, plus more spatially complex changes in humidity, winds, and temperatures elsewhere. Read the paper for all the details, but the following figure from the paper (click to enlarge) provides a nice overview. Figure 18 from Wanner et al. 2008. Spatial synthesis: global climate change for the preindustrial period (AD ~1700) compared to the Mid Holocene (~6000 cal years BP). People refer to the Mid-Holocene as a "warm period" (I just did in a comment in another thread!) so it's tempting to guess that you could just invert all those changes and get a pretty good idea of where we're headed, warming-wise. But unfortunately that won't work, since the change from Mid-Holocene to modern conditions was driven by orbital geometry, which involves changing the spatial-seasonal distribution of solar irradiance, rather different from the spatial-seasonal distribution of warming caused by increased CO2.
    0 0
  18. Ken Lambert@14... "Just the fact that we are all niggling about whether the Earth is slightly heating or cooling over the last 8-15 years, or whether it is statistically significant is pretty good proof that the theory of CO2GHG forcing as the main driver of global warming is in serious trouble." That statement makes absolutely no sense to me at all. By that logic the "theory of CO2GHG forcing" would have been "in trouble" several times over the past 50 years. Look at the temperature record and plot out all the 8 and ten year trends. I just got on the Wood for Trees site and started imputing dates. You literally have to go through each possible year to present and pick out 2002 to get the lowest trend. That is by definition cherry picking. Here are the results of those searches... Not only that, but to claim that CO2GHG theory is in trouble you have to completely ignore the fact that we're winding down the hottest year in the temperature record, in a negative PDO, during a solar minimum and in a La Nina.
    0 0
  19. You also have to believe that everything else should stop happening under CO2 warming. Skeptics don't believe in interannual variability, which is why they conflate short-term weather phenomena and climate. No, it has to be monotonically warming, year-by-year, or there's a 'problem with AGW'. Ask a skeptic what the minimum period is to get a bead on climate and they'll say nothing, or that 30 years is wa-a-y too short. It's like asking them when the Medieval Warm Period was supposed to have occurred. Makes them silent or uncomfortable.
    0 0
  20. Regarding oceanic heat content. (OHC). From Palmer et l. (2010; "State of the climate in 2009" report): "Even so, errors are too large to obtain reliable trends over a few years. However, the three curves all agree on a significant decadal warming of the upper ocean since 1993, accounting for a large portion of the global energy imbalance over this time period (Trenberth 2009), and the three sets of maps (not shown) from which the curves are produced show similar largescale features." For the same period covered in the above graphs (from 1979 onwards)0-700 OHC has increased by about 10x10^22 J [From Fig. 3.9 in the "State of the climate report"] That said, their Fig. 3.8 gives a different picture, so I am not entirely sure which one to trust.
    0 0
  21. Rob Honeycutt writes: we're winding down the hottest year in the temperature record, in a negative PDO, during a solar minimum and in a La Nina. Agreed 100% on the rest of your post, but the "in a La Nina" bit is somewhat confusing since we started out the year in a (moderate) El Nino cycle and temperatures typically lag ENSO slightly IIRC. My guess is that now that La Nina conditions have returned we'll see temperatures drop a bit from the highs of recent months. Nonetheless, Rob's main points are right -- KL's selection of 2002 is obvious cherry-picking, and his claim that this means "trouble" for AGW is just nonsense.
    0 0
  22. Here is another chart that I did. Without even trying very hard I identified 5 different points where "CO2GHG theory has been in trouble." It's actually pretty easy to pick out sharp declines over short time periods. And, it seems to get a little harder to identify sharp declines as you move forward in time.
    0 0
  23. #22: Your graph puts these brief 'coolings' into perspective as the short-term noise superimposed on a long term cycle. That's a pretty basic concept in signal or time series analysis. I suppose a denier would look at the seasonal decrease in monthly atmospheric CO2 and conclude that there is a downwards trend: for 5 months out of 12, CO2 concentration is decreasing. Problem solved! Yet the peak and the average each year go up. Same picture: short-term variation superimposed on a long-term increase. Yooper had it exactly correct: The trend's the thing.
    0 0
  24. Ned and Rob, Thanks for the great posts. Research has found that global SAT anomalies are best correlated with El Nino/La Nina indices when they lagged said indices by about 5-6 months. Specifically, "Christy and McNider [1994] and Angell [2000] show that the entire troposphere warms up with an overall lag of 5 to 6 months, but the lag is slightly less in the tropics and greater at higher latitudes." (from here) . DeepClimate undertook an analysis and identifed a 6-moth shift. So the marked impact on global SATs from the current (and quite strong) La Nina should be felt in the next two to three months.
    0 0
  25. So, the warming is masking the cooling? Where have I heard that before? Anyway, we ARE cooling.
    0 0
  26. Soory, that didn't work http://upload.wikimedia.org/wikipedia/commons/c/ca/Holocene_Temperature_Variations.png
    0 0
  27. John, sorry for breaking your web design - stay happy.
    0 0
  28. Re: Baz (26) Try this, replacing the asterisks with < and > on the outsides of the text: *img width="450" src="http://upload.wikimedia.org/wikipedia/commons/c/ca/Holocene_Temperature_Variations.png"* Should work. The Yooper
    0 0
  29. Baz, "Anyway, we ARE cooling." Over which window of time and for how long has this "global cooling" period been occurring Baz? Are you referring to the Fig. you linked to? If so, look at the insert in the Fig. in the link that you just posted...see that arrow in the top RHS, or the arrow at 2004? The long-term trend (20-30 yrs)in global temperatures is most definitely positive, only those in complete denial about what is happening think that the planet is not warming. Regardless, you are taking us off topic (ably assisted by me)-- this post/thread is on the last 30 years, not the last 10 000 years.
    0 0
  30. Baz, I noticed in your graph that 2004 is hotter than any other year on the graph. 2010 would be higher again. The warming has overtaken the cooling and it is now hotter than the previous 8,000 years: your data shows that!! You give a prefect example of what the post states. It is too bad when sceptics point us to data that proves themselves wrong. Unfortunately they can't read their own graphs.
    0 0
  31. Baz... Are you missing the point of that chart? Yes, the overall natural trend should be a very slow (geologic scale) cooling. But that chart makes a hard break to the positive trend around the industrial revolution. You are doing exactly what Barry @ 19 pointed out. You skip from way too short of a trend to prove a point (5 or 10 years) to way to long of a trend (8000 years). The entire issue is about current warming and statistically significant trends. I think I understand where the focus on short term trends comes from though. What if, for some reason not yet understood, climate is taking a turn toward cooling? Do we need to wait for 30 years to find out? I'm sure someone here can answer this better than I can but I believe statistically you can see that turn in temps without waiting 30 years. You'd be looking to see if the temps start falling outside the 2 standard deviation boundaries of the trend. Alden Griffith does a really good job of addressing this whole idea of current cooling here.
    0 0
  32. Re: Baz (25)
    "Anyway, we ARE cooling."
    By ignoring the 20th & 21st Century temperature rise, you're still wrong. Anyway, this would have been a better version of that graph to use: As the other commentators point out, you're not using the correct resolution of time-frame for this thread. The Yooper
    0 0
  33. Daniel... Do you have a source for that diagram? I had never put that together that the emergence of agriculture is timed exactly with coming out of the Younger Dryas. Let's hope we don't later have to add to the other side of the chart a captions that says "agriculture ends."
    0 0
  34. Re: Rob Honeycutt (33) Michael Tobis ran across it somewhere & posted on it, so a bunch of us ran around trying to find the original source image (buried in a ppt somewhere). This is the source for the image that caused the controversy. I forget the thread post at OIIFTG. If it's important, I can look it up for you. The Yooper
    0 0
  35. Daniel... Not so important to waste time on it. I just wanted to bookmark it so I would be able to locate it in a pinch. Thx!
    0 0
  36. Ken #14 "Just the fact that we are all niggling about whether the Earth is slightly heating or cooling over the last 8-15 years, or whether it is statistically significant is pretty good proof that the theory of CO2GHG forcing as the main driver of global warming is in serious trouble." How do you make these illogical leaps? It simply means you're asking the wrong questions. Have you considered the possibility thatyour ideological preconceptions contaminate your ability to evaluate the science in a level headed way? I might write up a post for SS on statistical power and trends in the next week or two to dispel this rubbish once and for all.
    0 0
  37. @Baz: "Anyway, we ARE cooling." ...only if you cherry-pick a very specific time frame. By any other (scientifically-correct) measures, we are not.
    0 0
  38. It's about frame of reference. There's nothing wrong per se with saying, "the globe has been cooling", when this applies to a time frame in which the globe has actually been cooling. If the statement is void of the word climate then it can be 'true' for short-term periods, but the point of confusion is that 'skeptics' reading such statements, and probably also writing them, implicitly assume that it is climate that is being discussed, instead of short-term weather phenomena. archiesteel in the post above this one is thus dragged into the murky waters by such omissions. By 'scientifically correct', they mean 'climatically significant'. 'The globe has cooled since X' may be 'scientifically correct', but it is tosh with respect to recent global climate. So much care has to be taken with contrarians. They are not interested in a reasonable conversation or with seeking the *truth* They only want ammunition, and careless phrasing provides them with it.
    0 0
  39. @barry: you are completely right, my choice of words was ambiguous. In my mind I was saying it in the context of climate science, where "we are cooling" means the climate is cooling in a statistically significant way. To claim otherwise would have been scientifically incorrect, in other words. Indeed, one has to carefully phrase what they say, especially when confronting others about their own rhetorical inconcistencies. In my defense, I'll say English is not my first language, but I'll try to be more careful.
    0 0
  40. @baz: "So, the warming is masking the cooling? Where have I heard that before?" I glossed over this passage before, but it kind of nags me. Where *did* you hear that before? This sounds like a reference to something else, but I can't figure it out. Anyway, I had a look a the graph you tried to embed, and I don't understand why you think this shows a cooling. Did you not see the "2004" arrow, indicating the current range of temperatures? In fact, this graph clearly shows the warming is currently masking any long-term cooling effects. Note, however, that the subject of this article is about shorter time frames (to the order of 30 years).
    0 0
  41. Oops, I was waaay late on that one (hadn't refreshed the page in a while before writing #39). I see others have responded better than I, and am again grateful for the general quality of comments on this site.
    0 0
  42. #41: "the warming is masking the cooling" Maybe it was this junk from the junkman, circa 2005. "One of the more interesting "Sky Is Falling" postulations made in recent years has been the claim that the apparently cooling stratosphere is masking observation of anticipated warming in the troposphere."
    0 0
  43. RH, kdkd, Ned, muoncounter; Gentlemen (maybe ladies for muoncounter): The most recent 8-15 years is not cherry picking. 1-2 years is cherrypicking. Given that AGW was recently declared a post-pubescent 35 year old, the most recent one third of this period cannot be regarded as insignificant - particularly since the CO2 concentration and logarithmic forcing therefrom is at its highest level and increasing every year up to the present. There is little doubt of a flattening in warming over the last 8-10 years. All temp records show it, and OHC measurement is showing less heat gain (or no heat gain), the more accurate it becomes - even with the imperfect Argo. Even Jason is showing about 2.1mm of yearly SLR since 2002, with most of this (3 of 4 recent analyses) attributing to ice melt (mass) and not steric rise (OHC rise causing thermal expansion). OHC measurement prior to Argo is next to useless - very high noise, poor spatial coverage and no baseline. OHC increase claimed by splicing charts from 1993 with Argo (2003-04) has been dealt with elsewhere ie; "Robust Warming of the Upper Oceans", and found to be anything but robust. Muoncounter won't engage on the TSI needing a baseline of 'zero' forcing, because he has probably worked out that I am right, and we could well be seeing a 250-300 year slice of heat accumulation from Solar forcing imbalance which the IPCC AR4 has wrongly dealt with in Fig 2.4 and has been repeated elsewhere. Could this be another IPCC AD2035 or AD2350 moment? 8-10 years of flattening temperatures can't be attributed to ENSO, PDO, AMO unless these complex circulations actually cause a net global heat loss rather than re-distribute heat internally within the Earth system over that sort of time period - and who is suggesting that? Mind you it is not impossible - but contrary to our current understanding, and would be a welcome burp of heat to space to relieve some of that AGW if real. Finally Dr Trenberth's speculation that the 'missing heat' could be sequestered down below the 700-1000m level and might belch forth to king hit us, is looking increasing unlikely by the latest Willis analysis which is finding nothing much down there.
    0 0
  44. #43: "The most recent 8-15 years is not cherry picking." Really? Examine: The blue points are a full 10 years of RSS data for all latitutdes; the pink are just the most recent 8 years. The 'trend' for the blue is positive; the 'trend' for pink is slightly negataive. So it would appear that choice of sample directly influences the apparent outcome. We have 30+ years in RSS and lots more in surface temperatures; please use all available data. As for your continued insistence that I must provide some hypothetical baseline TSI value for you: we've already discussed this ad nauseum elsewhere. I'm not a solar irradiance expert and I'm not going to speculate. Its time to stop asking the same question every time we cross posts. This is a public forum; if anyone else felt your question was important, no doubt they would have chimed in by now.
    0 0
  45. Ken Lambert, there's not a fixed amount of time (or whatevre) that tells us how much is enough, it is a statistical problem. Five years may be enough for a set of data but not enough for another, it depends on the noise and/or natural variability of the physical quantity that is being analyzed. There's one more thing that needs to be understoood. If we have, say, 5 years of flat trend, although we can still say that it has been flat (it's our best guess, afterall) we need to explicitly state its statistical significance. So the problem is not on the claim by itself but on the conclusions that can be drawn.
    0 0
  46. Ken Lambert wrote : "There is little doubt of a flattening in warming over the last 8-10 years. All temp records show it..." Really ? I tried it out for UAH (the favourite of the so-called skeptics - although am I right in thinking that they doubt even that now, because it doesn't give them what they want ?), and came up with this : I have used trends for the last 6-12 years, to encompass the years since which you believe there has been 'flattening' as well as a couple of years on either end, and the trend details are : From 1998 - 0.00559773 per year From 1999 - 0.0203245 per year From 2000 - 0.0160839 per year From 2001 - 0.00678464 per year From 2002 - 0.00372316 per year From 2003 - 0.0102541 per year From 2004 - 0.0168241 per year From what I can see, the flattest trend shows up if you take 2002 as your start date but it's certainly not as flat (in fact the trend is increasing) for the following two years. Now, I don't like to use any trends of only 6-12 years (let alone your 8-10) but surely even you can see that your assertion ("flattening in warming") is desperate ?
    0 0
  47. JMurphy #46 Ned's Chart at post #18 here: http://www.skepticalscience.com/The-Pacific-Decadal-Oscillation-and-global-warming.html shows smoothed GISS land + SST and RSS temperatures which sure looks like flattening over the last 8-10 years. That's if a clear reduction in the slope of a curve is flattening - which for most people it is. Not desperate - just fact JM.
    0 0
  48. Re: Ken Lambert (43)
    "The most recent 8-15 years is not cherry picking. 1-2 years is cherrypicking."
    I could quote other bits, but I believe the entire gist of your comment revolves around this fulcrum. As other commenters have ably demonstrated above, this insistence upon a narrow focus of time, without the relevant context of the available larger dataset of time, is Cherry Picking. You conflate natural variability of noisy datasets with interrupted warming. This has been addressed many times here on Skeptical Science. Outside commentators have also addressed it, such as here and here. The long term trend, with natural periodicity properly removed, is what is important. Tamino gives a good example of how to adjust for that INRE: Sea Level Rise here. The Yooper
    0 0
  49. Re: Ken Lambert (47) Would that analysis you conduct be with your Mark 4 eyeball? Still cherry picking. A good background on statistics, and inherent dangers therein, is here. The Yooper
    0 0
  50. KL #43 While you clearly have some intelligence, your comment shows that your understanding of applied statistics is pretty zero. To wit: "The most recent 8-15 years is not cherry picking. 1-2 years is cherrypicking. Given that AGW was recently declared a post-pubescent 35 year old, the most recent one third of this period cannot be regarded as insignificant" Is illogical, incorrect, and theoretically unsupportable. I must prepare a post on linear trends and statistical power in order to deal with this oft-repeated rubbish of yours and others' once and for all.
    0 0

1  2  Next

You need to be logged in to post a comment. Login via the left margin or if you're new, register here.


The Consensus Project Website

THE ESCALATOR

(free to republish)


© Copyright 2024 John Cook
Home | Translations | About Us | Privacy | Contact Us