Climate Science Glossary

Term Lookup

Enter a term in the search box to find its definition.

Settings

Use the controls in the far right panel to increase or decrease the number of terms automatically displayed (or to completely turn that feature off).

Term Lookup

Settings


All IPCC definitions taken from Climate Change 2007: The Physical Science Basis. Working Group I Contribution to the Fourth Assessment Report of the Intergovernmental Panel on Climate Change, Annex I, Glossary, pp. 941-954. Cambridge University Press.

Home Arguments Software Resources Comments The Consensus Project Translations About Support

Bluesky Facebook LinkedIn Mastodon MeWe

Twitter YouTube RSS Posts RSS Comments Email Subscribe


Climate's changed before
It's the sun
It's not bad
There is no consensus
It's cooling
Models are unreliable
Temp record is unreliable
Animals and plants can adapt
It hasn't warmed since 1998
Antarctica is gaining ice
View All Arguments...


Username
Password
New? Register here
Forgot your password?

Latest Posts

Archives

Is Greenland losing ice? (psst, the answer is yes, at an accelerating rate)

Posted on 28 September 2010 by robert way

Confusion caused by anecdotes of structures being buried by accumulating snow on Greenland's ice sheet leads some skeptics to believe Greenland is Gaining Ice. As always, the best way to tease out the truth here by following the research of scientists investigating Greenland's ice mass balance.

In general, the best available science tells us that Greenland is losing ice extensively (Figure 1) and that these losses have drastically increased since the year 2000.


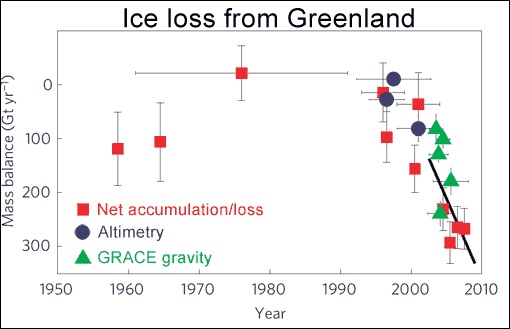
Figure 1: Estimated Greenland Ice Sheet mass balance changes since 1950 using three different methods (Jiang 2010). Mass Balance Measurement Techniques are discussed here.

The evidence suggested by a multitude of different measurement techniques suggests that not only is Greenland losing ice but that these ice losses are accelerating at a rapid pace (Velicogna 2009). Further evidence suggests that although ice losses have up to this point primarily occurred in the South and Southwest portions of Greenland, these losses are now spreading to the Northwest sector of the ice sheet (Khan et al 2010).

Although there have been some gains at high altitudes, significant ice losses are occurring at low altitudes (Wouters 2008) along the coastline where glaciers are calving ice into the oceans far quicker than ice is being accumulated at the top of the ice sheet (Rignot and Kanagaratnam 2007).

In conclusion Greenland is losing ice extensively along its margins where fast flowing ice streams are pushing more ice into the ocean than is gained in the center of the ice sheet. For more information on how ice sheets lose mass, a more comprehensive discussion is available here.

This post is the Basic version (written by Robert Way) of the skeptic argument "Greenland is gaining ice". Robert has also written a number of richly informative posts on Greenland ice loss. A good starting point is Why do glaciers lose mass. Part two in this series was How do we measure Antarctic ice loss. Part Three responded to disinformation from Steve Goddard about Antarctic ice loss.

0 0

Printable Version  |  Link to this page

Comments

Comments 1 to 40:

  1. i believe that there has been an update to the grace data, due to incorrect calibration for continential rebound... is this post with the updated data?
    0 0
  2. I believe so, check the following links from the post - Khan et al 2010, and the paper cited in the graphic caption, Jiang 2010.
    0 0
  3. The article fails to mention that a new paper, Wu et al. (2010), has concluded that that losses have not in fact accelerated as claimed. Although the ice-sheets are losing mass, the losses estimated by the authors represent less than half of the other GRACE-based estimates, which undermine the collusions the four papers cited in Wray's article. Wu et al. conclude that "a significant revision of the present estimates of glacial isostatic adjustments and land-ocean water exchange is required". Reference: Wu et al (2010) "Simultaneous estimation of global present-day water transport and glacial isostatic adjustment" Nature Geoscience 3, 642 - 646 (2010)doi:10.1038/ngeo938 (Link to www.nature.com)
    0 0
  4. The graphs probably need to be updated, incorrect accounting for post glacial rebound is probably doubling the figures given there!
    0 0
  5. I think it should be noted that the mass balance estimates based on GRACE might be a bit exaggerated in some literature (Velicogna et al 2009 and Chen et al 2009). The linked paper argues that redistribution of the mass of the ice loss around the globe and isostatic rebound due to unloading is not fully accounted for in a number of papers which use GRACE data. However, while this papers disputes the magnitude of the loss in some literature, it does not dispute the acceleration of the loss. (A more elaborate summary is here.)
    0 0
  6. Too early to say really. The writers of the earlier papers based on GRACE data believe they got the isostatic rebound correct. A new paper by Wu suggests it is a larger factor. Frankly, the jury is still out. One issue with the Wu analysis is that if significantly less ice has melted than previously thought then we have a bigger problem explaining the observed sea level rise. Any decrease in ice loss must be made up by increased expansion due to heating. In any case, given that they confirm the increasing rate of ice loss the magnitude isn't really a major issue... the rate has been doubling every few years, so if the current rate is half what had been thought then we'd still be back up to the previously estimated rate within the decade. The long term difference is negligible.
    0 0
  7. #3 Falcon, we reference the same paper but we disagree in details: 1. I have not found any reference that the paper disputes acceleration of the losses. 2. The paper does not "less then half" all other GRACE-based estimates: Luthcke et al 2007 used GRACE data and applied a method with greater spatial and temporal resolution to come up with -101 Gt/yr between 2003 and 2005 which seems to correlate perfectly with the Wu et al paper. Perhaps Luthcke has found a way around the isostatic rebound and mass redistribution using the greater spatial and temporal resolution. It sounds plausible to me but I'm not qualified to judge that.
    0 0
  8. Whether the rate of loss is increasing is an important issue. Don't forget this article claims that "that these losses have drastically increased since the year 2000" Velicogna et al (2009) concluded that the mass loss increased from 137 Gt/yr in 2002–2003 to 286 Gt/yr in 2007–2009. However, Wu et al (2010) cite mass losses between 2002 and 2008 of 104 +/- 23 Gt/yr which would suggest that there is little evidence in the data that the rate of melt has been increasing. I suggest it won't be long before someone jumps all over the way this article has summarized the issue.
    0 0
  9. #7 cynicus I hadn't seen Luthcke et al 2007, thanks for that. In my view it reinforces the need to point out and quantify the uncertainties rather than unintentionally marginalise them.
    0 0
  10. Can someone explain the meaning of the error bars in the graph. The various, almost simultaneous, estimates of mass loss by the Grace system have relatively small error bars, but many of them are non-overlapping. It seems that the error bars reflect only statistical sampling error and grossly underestimate the true potential error of the measurements.
    0 0
  11. Charlie A: As you might have noticed from the previous comments in this thread, there has been some disagreement among different groups processing the GRACE data (though all show declining mass balance). The different green diamonds (and the black line, too) come from different groups working with the same GRACE data. I don't have the Jiang paper in front of me, but IIRC the black line is from Velicogna, some of the green triangles are from Luthcke, and the other green triangles are from ... someone else I don't remember.
    0 0
  12. #8 Falcon, there is a slight difference between "on average -101 Gt/yr" and "-101 Gt/yr". The former allows for acceleration and the latter doesn't. From the Geoscience publication: "[..] for the period spanning April 2002 to December 2008, Wu and colleagues find an average annual ice-mass change of −104 ± 23 Gt yr−1 for Greenland and −64 ± 32 Gt yr−1 for West Antarctica."
    0 0
  13. @Ned, #11 "the black line is from Velicogna, some of the green triangles are from Luthcke, and the other green triangles are from ..." Thanks for the info, but that's not my question. The various green triangles have relatively small vertical black lines, drawn in the manner which is usually used to denote error bands. These bands are relatively small, indicating that the various authors of these estimates believe that they have a relatively precise, accurate measurement. Unfortunately, it appears that these multiple, relatively precise measurements are inconsistent with each other. Am I interpreting the graph incorrectly? For example, if two simultaneous measurements of some parameter are expressed as -220+/-10 and -90+/-10 is there not an obvious underestimation of the error of the measurements?
    0 0
  14. Do the majority of people really care if Greenland is losing a little ice and the oceans are rising a few centimeters and it's getting a little warmer? The people I know have air conditioners for when it's too hot, and more days for the beach, golf, and tennis than before. I've sent them links to Skeptical Science, but they've trashed them. They don't understand all that technical stuff. They don't care whether this or that paper has errors or not, they just know from watching TV, reading magazines and newspapers, and experiencing the weather, that global warming research has been inconclusive. Skeptical Science would have more impact if the topics and discussions swung around to introducing and describing real-world environmental and economic scenarios that will unfold in the wake of climate changes. Write scripts for those disaster movies, but make them realistic. Global warming is not going to bury the Statue of Liberty or send tidal waves over cities. Turn all those meaningless warnings written in technical papers into realistic scenarios the average Joe can understand and interpret, and maybe he will start to notice and reason. Otherwise he will continue along the paths set by big business and the oil industry.
    0 0
  15. JOURNAL OF GEOPHYSICAL RESEARCH, VOL. 115, F03026, 15 PP., 2010 doi:10.1029/2009JF001522 Ocean regulation hypothesis for glacier dynamics in southeast Greenland and implications for ice sheet mass changes Ocean regulation hypothesis for glacier dynamics in southeast Greenland and implications for ice sheet mass changes T. Murray
    0 0
  16. JOURNAL OF GEOPHYSICAL RESEARCH, VOL. 115, F03026, 15 PP., 2010 doi:10.1029/2009JF001522 Ocean regulation hypothesis for glacier dynamics in southeast Greenland and implications for ice sheet mass changes. T. Murray et al I recommend a read of the above paper if you can get past the paywall. It proposes a slightly more complex process controlling glaciers in SE Greenland. They even dare to suggest re-advancing glaciers in this region in the late 2000's.
    0 0
  17. I think a lot of people have been talking about the Wu et al. 2010 paper with respect to these Greenland estimates. A newer paper (Bamber and Riva, 2010) was recently published and included an estimate for both ice sheets. I submitted a comment on the paper asking why the authors chose to go with Van Den Broeke's (2009) estimate rather than the Wu et al (2010) estimate. The Bamber and Riva Paper can be accessed here: http://www.the-cryosphere-discuss.net/4/1593/2010/tcd-4-1593-2010.pdf Their reply is listed here: http://www.the-cryosphere-discuss.net/4/C813/2010/tcd-4-C813-2010.pdf Some highlights of the reply include: "Because a paper is the most recent does not, necessarily, make it the most reliable or "best" estimate." "It is important to realise that they are producing a global solution for GIA and PDMT by finding a least squares minimisation for the GRACE, GPS and modelled OBP data sets. The solution has not been tuned for any one location and the quality of the solution will depend on the quality and spatial density of the data sets that went into it. As far as we can tell, the solution is not constrained to pass through the observations. In Greenland, there are very few GPS site with a sufficiently long record (just 3) that could be used and none in the interior of either Antarctica or Greenland." Bamber and Riva are both very well known glaciologists and Bamber is well-known as being a world leading glaciologist. One of the best, therefore we should take his estimates quite seriously. What I think the take home message is that Wu et al (2010) use a new approach to calculate Greenland mass balance. This approach may become the best approach in the near future when more GPS stations are available (IPY put up a lot) but that currently this approach (although novel and useful) is not accurate enough to be termed the "best" estimate for Greenland Ice Losses. I have identified quite a few issues myself with the Wu et al (2010) paper that are not big but that require maybe some questioning. I think that a lot of people have to watch out how quickly they jump on the bandwagon of a new paper. Funny how well reported the Wu et al (2010) paper was compared to Bamber and Riva (2010) which is newer...
    0 0
  18. As part of the Arctic Report Card Hanna, Box and Huybrechts (2008) summarized the mass balance state of the Greenland Ice Sheet. The mass balance has been assessed using multiple measures only one of which is GRACE. Reading this report card will indicate that the bulk of the studies are closer to the Wu et al., (2010) results discussed above. Ten years ago we could not assess the mass balance of the ice sheet. Today we are still developing this skill. As usual it is best to rely on multiple data sets. We have laser altimetry, surface mass balance models and GRACE. A couple of sentences from the aforementioned authors ..." A recent survey concludes that the GrIS is currently losing ~100 Gt yr-1 (Shepherd and Wingham 2007). However, there remains considerable discrepancy among these pioneering observational estimates. " and "Airborne and satellite laser-altimetry data analyses indicate a volume loss of about 60 km3 yr-1 in the 1993/4 - 1998/9 period, that increased to about 80 km3 yr-1 in 1997-2003 (Krabill et al. 2004, Thomas et al. 2006). Various recent analyses of gravimetric (GRACE) satellite data suggest greater mass (volume) losses in the 101-226 Gt yr-1 (111-248 km3 yr-1) range within the recent few years, that is, 2002-2006 (Luthcke et al. 2006, Velicogna and Wahr 2006). " The time periods and methods are not identical but do indicate that the low 100 Gt yr-1 has been a frequent result. It is evident that the loss has not stopped, as the volume losses of Humboldt, Jakobshavns, Petermann and many others continued in 2010
    0 0
  19. Here's a screen grab from the paper that suggests the mechanism controlling mass loss for SE Greenland glacier. ( http://i51.tinypic.com/2wqvkab.png ) This got me thinking whether it's sensible to produce a whole Greenland mass loss and then try to attribute this to a single forcing? As Kahn 2010 paper suggests NW Greenland acceleration in mass loss began in 2005. The Murray 2010 paper suggests SE Greenland accelerated early 2000's and then the rate declined late 2000's. I assume acceleration in SW Greenland began in early 2000's but I don't know how it then developed. Let's ignore what's going on in the NE. If we have multiple different processes occuring at different times in different regions of Greenland over the past decade can we lump the results from these different processes into a single whole Greenland ice mass loss and get any real meaning from that? (BTW Murray et al 2010 suggest the above mechanism as the main process controlling mass loss in SE Greenland.)
    0 0
  20. I agree with some posting here that the results from Wu et al. should be included. With that said, as Cynicus pointed out @12, nowhere in their paper do Wu et al. speak to the rate of change of loss with time (i.e., acceleration or a slow down), they talk about the mean loss between 2002 and 2008. Wu et al. do confirm recent studies which found that the once thought to be stable EAIS may be losing ice (albeit with large error bars). They also confirm that Alaska Yukon are lost about 100 Gt a year between 2002 and 2008-- that is about as much as the loss from GIS, or as much loss as EAIS and WAIS combined. Also, there is a note of caution required. From a summary of the Wu et al. paper by Bromwich and Nicolas(2010): "However, the revised estimates of glacial isostatic adjustment carry their own uncertainties: they depend strongly on a small number of GPS records that are all located on the ice-sheet margins." So, the jury is still out as someone else here has noted ...in the mean time the data indicate that GIS, WAIS and EAIS continue to lose ice mass, very likely at an accelerating rate.
    0 0
  21. The Rignot & Kanagaratnum paper cited in the OP is 2006, not 2007.
    0 0
  22. CBDunkerson: "One issue with the Wu analysis is that if significantly less ice has melted than previously thought then we have a bigger problem explaining the observed sea level rise. Any decrease in ice loss must be made up by increased expansion due to heating." The sea level rise can be explained very well from the gradual rise in temperature and the moderate ice loss from Greenland. Wu's suggestion that the Greenland ice loss is far less than was assumed so far is in perfect agreement with the fact, that there is no significant change in sea level rise. Contrary to popular claims the sea level rise is not accelerating. From 1993 to 2010 the sea level rose 2.7 mm/year. From 2005 to 2010 it was only 2 mm/year. These data can be checked here.
    0 0
  23. fydijkstra @22, You are making deductions using data over too short a period of time to be of statistical significance, and have not supported why you chose 2005. I could take those SL data (you should actually be using the data with both the inverse barometer correction, and with seasonal signal removed), and could argue that the rate of increase from 2007 until present is 3.3 mm/yr, which is above the long-term trend of +3.2 mm/yr. See the CSIRO site . So focusing on short-term trends does not make sense-- b/c the data are so noisy one can select short windows of time to support whatever point of view you wish to make. The CSIRO also state that: "This data has shown a more-or-less steady increase in Global Mean Sea Level (GMSL) of around 3.2 ± 0.4 mm/year over that period. This is more than 50% larger than the average value over the 20th century."
    0 0
  24. Okay, if we're going to talk about sea level rise and all this stuff, Check out Bamber and Riva (2010) http://www.the-cryosphere-discuss.net/4/1593/2010/tcd-4-1593-2010.pdf
    0 0
  25. If cold water pouring into the North Atlantic below Greenland is supposedly the motor that drives the ocean's conveyor belt, accelerated melting should favor this mechanism, which I assume helps the Gulf Stream, which I assume means warmer temperatures in New England and Northern Europe, which I assume will convince people that global warming is really happening. The question is whether it is happening as much as people need to be concerned, or is this just a merry go round type convenient political distraction?
    0 0
  26. RSVP, no, you've got it backwards. Fresh water is less dense than salt water, so a sudden inflow of fresh water (e.g., from a collapsing ice cap) is hypothesized to reduce the velocity of the "conveyor belt" because it doesn't sink.
    0 0
  27. RSVP@25 "The question is whether it is happening as much as people need to be concerned, or is this just a merry go round type convenient political distraction?" Ned@26 "Fresh water is less dense than salt water,..." No. Here is an example where too much of a good thing isn't good. Cold fresh water from melting glaciers is denser than returning warm salty ocean water, so it sinks way up north and flows south along the ocean floor, gradually rising on its way down to the equator and mixing with the warmer salty water, to eventually flow back north along the surface. But if the amount of cold fresh glacial water becomes too great, it can't all sink to the ocean floor, so more and more of it will start flowing southward closer to the surface. This surface flow of cold water will have two main effects. First, it will oppose the flow of warm salty water coming up from the equator, which had been tempering the air, and second it will further cool down the air above it. These two factors will work together to keep northern land masses near the ocean from being warmed by the ocean air currents, which may be a temporary respite from global warming for some unlucky folks.
    0 0
  28. Roger, I don't think you have this quite right. The driving factor in North Atlantic deepwater formation is salinity, and the presence of a lens of fresh water on the surface will reduce the vertical flux. From Ganopolski and Rahmstorf 2001: For a large freshwater input (such as a large release of icebergs), the model's deep water formation is temporarily switched off ... From Hu et al. 2009: Since Greenland is close to ocean deep convection sites associated with the oceanic meridional overturning circulation (MOC), the discharge of the melting ice sheet water could potentially stabilize the upper ocean at these sites and lead to significantly weakened deep convection there. Presently, some modelling studies indicate a dramatic weakening of the MOC in a future warmer climate after the melting is taken into account ... From Jungclaus et al. 2006: Climate projections for the 21st century indicate a gradual decrease of the Atlantic Meridional Overturning Circulation (AMOC). The weakening could be accelerated substantially by meltwater input from the Greenland Ice Sheet (GIS). Here we repeat recent experiments conducted for the Intergovernmental Panel of Climate Change, providing an idealized additional source of freshwater along Greenland's coast. For conservative and high melting estimates, the AMOC reduction is 35% and 42%, respectively, compared to a weakening of 30% for the original A1B scenario. Even for the high meltwater estimate the AMOC recovers in the 22nd century. and so forth. The conventional description of this is clearly that a reduction in surface salinity caused by inputs of meltwater from decaying ice caps will reduce the vertical flux in deepwater formation zones and lead to a slowdown in the MOC. I have never read an explanation that matches your description of this process, so if you've got a reference to a study showing this, I'd be very interested in reading it. That's not to say that meltwater from the Greenland ice sheet would cause some kind of "Day After Tomorrow" catastrophe. But the general effect is to reduce rather than increase the meridional overturning circulation; RSVP did indeed have this backwards.
    0 0
  29. Roger@27: Sorry, I meant to say, "temporary reprieve from global warming," not "temporary respite from global warming." Well, either may be applicable...
    0 0
  30. Ned@28: "Roger, I don't think you have this quite right." Stand corrected.
    0 0
  31. Roger, Do you think that the gulf stream is the exact same thing as the AMOC?
    0 0
  32. I'm curious how people are reading figure 1? The long straight line from 1960-1990 had given me the impression that there was stability in the Greenland ice sheet over this period. But when I went back to the original paper that Jiang got the data from it looked very different. The paper seems to be Hanna et al 2005 while they do present an average for that period which is what Jiang presents (and 1998-2003 which is also in Jiang's figure) they also show a full series from 1958-2003. I screen grabbed it. ( http://i52.tinypic.com/j0h091.png ) I'm not actually sure what the graph is telling me except that it looks like a huge amount of variability over that time period. And I wonder whether you have to temper any conclusions about the recent mass balance estimates in light of that? It seems to me that buried in the idea that "Greenland is losing ice extensively and that these losses have drastically increased since the year 2000" that this is going to be part of a trend stretching into the future when in fact it could just be part of the variability seen in Hanna's data series.
    0 0
  33. I've got a question that maybe is at the root of why I don't understand the figure above. Here's the GRACE data from another SkSci page Is this image saying that pre-2006 that Greenland was gaining mass (although at a slowing rate). Around 2006 it was in balance and post-2006 it was lossing mass? I'm confused about the positive and negative numbers.
    0 0
    Response: The confusion is my fault, apologies. I titled the graph "Change in Greenland ice mass" but I should've used the scientifically more precise "Greenland ice mass anomaly". No, Greenland wasn't gaining ice mass pre-2006 - it was losing ice mass throughout this entire period. What that graph shows is the deviation from the 2003 to 2010 average. As the ice is steadily falling, naturally ice mass levels will be above the average in the first half and below the average in the latter half.
  34. HumanityRules, the graph you show is Surface Mass Balance (SMB), just part of the story. The mass balance is reported in table 5. You can see that, altough none of the values is statistically significant, there has been a reduction from +22 for 1962-1990 to -36 (km3/yr WE) for 1998-2003. Also, the authors warn: "However, the ‘‘real’’ mass balance is probably substantially more negative because we do not take into account dynamical factors" and "our best estimates of -14 ± 55 km3 yr-1 and -36 ± 59 km3 yr-1 mass balance for 1993 – 1998 and 1998 – 2003 are much less than the -59 km3 yr-1 and -80 km3 yr-1 mass losses derived from airborne laser surveys for the same respective periods [Krabill et al., 2004], the latter including dynamical effects."
    0 0
  35. Having read a post about Greenland temperatures on the 'Real Science' website, I responded, based on graphs from the NASA GISS website. Steve Goddard has now made a post out of my response called 'A Glimpse Inside the Alarmist Mind' with a graph that appears to show that Nuuk temperatures have been steadily going down while CO2 has been rising. I have no idea where he gets his data (he doesn't say) which seem to contradict data from other websites. I'd be interested in any thoughts which might help my response.
    0 0
  36. John Russel @35, I refer you to my previous discussion of this topic. A key point is why is Goddard using a purely local temperature as representative of the whole island of Greenland. He knows that there have been two peer reviewed reconstructions of Greenland average temperatures (of which the most recent is Box et (2009), and knows also that if he used a different station it would show a different pattern: Indeed, of the stations in Greenland with long records, Nuuk shows one of the lowest overall trends, and I'm sure he knows that too. Even more telling, why is he using just one station to represent global temperatures in a comparison of the effects of CO2 on global warming. One station is not a global average, and it is global average temperatures that rise with increasing CO2. Individual stations can be dominated by local or regional factors and show all sorts of trends. Indeed, according to the BEST project, one third of all stations show a negative trend, in a data set for which the global land area average shows as strong a trend as GISS. Frankly I am getting sick of the smoke and mirrors game of the fake skeptics. I am told by a wise person never to attribute to dishonesty what can be attributed to stupidity, but frankly, the fake skeptics are not that stupid. Anyway, for more station data, go to this page and click on the map of Greenland to bring up a list of the nearest geographical sites (not all in Greenland). If you click on a particular site, in the lower left corner you have the option of text data which is where Goddard gets his station data. The CO2 data is probably Mauna Loa plus an Antarctic Ice Core. The real question is again, not where he got that data, but why won't he show the equivalent plot for global data: (Note, the vertical access shows CO2 increase above the preindustrial average) Oh, that's right. Because he's not that stupid.
    0 0
  37. ("access" should be "axis". Sorry, these things happen at 3:40 AM.)
    0 0
  38. Thanks, Tom. Actually the cherry-picking of just Nuuk was one of the points I was originally going to make but then decided, for the sake of simplicity, to concentrate on the fact he started his cherry pick in 1930 when there was already 50 years of (warming) data by that date. Anyway now to compose a response while you have a well-earned rest.
    0 0
  39. John Russell: see this prior Greenland thread, where the very same cherrypick was made by the very same cherrypicker.
    0 0
  40. OK, I've posted a response on Real Climate. In looking at the 'Box et al 2009' paper I notice that the Western side of Greenland (which, surprise, surprise, is where Nuuk is situated) has experienced regular volcanic-related cooling episodes; which appears to be the attraction for Mr Goddard. I also came across this recent 'ice update' which I guess people will probably have already seen.
    0 0

You need to be logged in to post a comment. Login via the left margin or if you're new, register here.


The Consensus Project Website

THE ESCALATOR

(free to republish)


© Copyright 2024 John Cook
Home | Translations | About Us | Privacy | Contact Us