Actions today will decide Antarctic ice sheet loss and sea level rise
Posted on 1 March 2018 by dana1981
A new study published in Nature looks at how much global sea level will continue to rise even if we manage to meet the Paris climate target of staying below 2°C hotter than pre-industrial temperatures. The issue is that sea levels keep rising for several hundred years after we stabilize temperatures, largely due to the continued melting of ice sheets in Antarctica and Greenland from the heat already in the climate system.
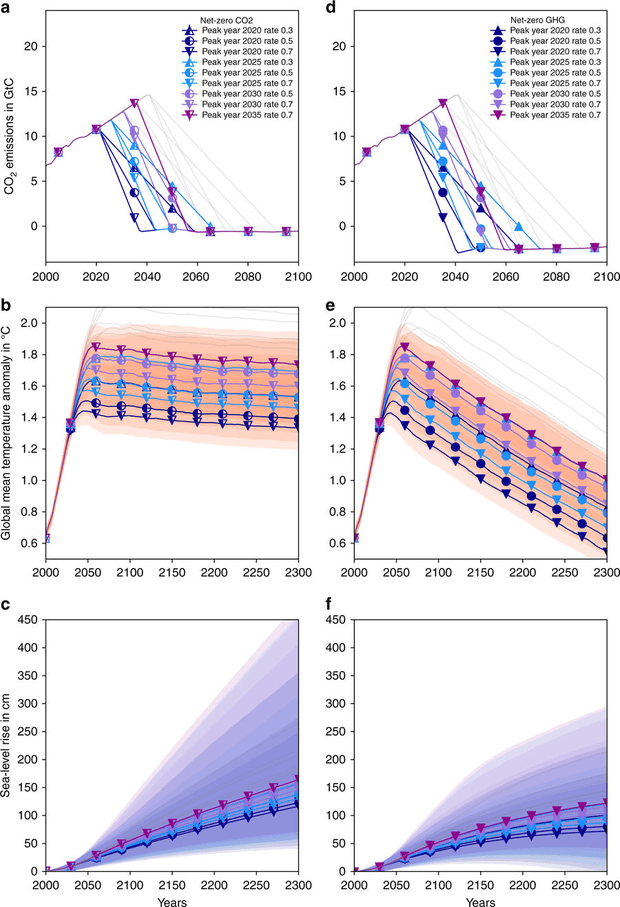
The study considered two scenarios. In the first, human carbon pollution peaks somewhere between 2020 and 2035 and falls quickly thereafter, reaching zero between 2035 and 2055 and staying there. Global temperatures in the first scenario peak at and remain steady below 2°C. In the second scenario, we capture and sequester carbon to reach net negative emissions (more captured than emitted) between 2040 and 2060, resulting in falling global temperatures in the second half of the century.
The authors found that global average sea level will most likely rise by about 1.3 meters by 2300 in the first scenario, and by 1 meter in the second. However, there is large uncertainty due to how little we understand about the stability of the large ice sheets in Greenland and especially Antarctica. At the high end of possible ice sheet loss, we could see as much as 4.5 meters of sea level rise by 2300 in the first scenario, and close to 3 meters in the second scenario.

Carbon emissions (top frames), global temperatures (middle frames), and sea level rise (left frames) in the study’s two scenarios (left and right frames). Illustration: Mengel et al. (2018), Nature Communications
The study also shows that it’s critical that our carbon pollution peaks soon. Each 5-year delay – a peak in 2025 instead of 2020, for example – most likely adds 20 cm of sea level rise by 2300, and could potentially add a full meter due to the uncertainty associated with the large ice sheets:
we find that a delay of global peak emissions by 5 years in scenarios compatible with the Paris Agreement results in around 20 cm of additional median sea-level rise in 2300 … we estimate that each 5 years of delay bear the risk of an additional 1 m of sea-level rise by 2300 … Delayed near-term mitigation action in the next decades will leave a substantial legacy for long-term sea-level rise.
And remember, this is all for scenarios in which we meet the Paris climate targets, which we’re currently not on pace to achieve. If we miss the Paris targets, sea levels will rise higher yet.
Another new study, published in the Proceedings of the National Academy of Sciences, found that sea level rise has been accelerating. If the rate of acceleration continues – which the lead author notes is a conservative estimate – we would see an additional 65 cm (close to a meter above pre-industrial sea level) of sea level rise by 2100.
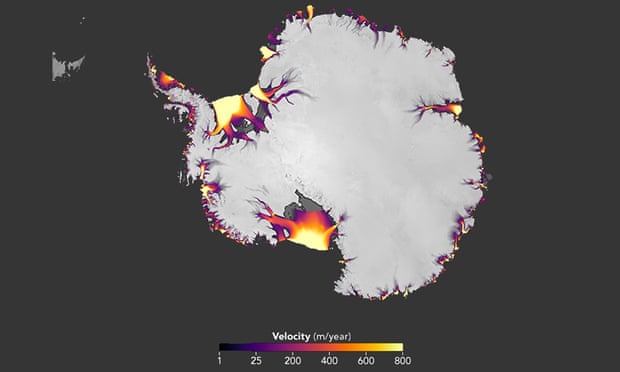
Yet another new study published in The Cryosphere using satellite data found that while the East Antarctic Ice Sheet has remained stable in recent years, ice loss from the West Antarctic Ice Sheet has accelerated. Antarctica is now discharging 1.93 trillion tons of ice each year, up from about 1.89 trillion tons per year in 2008. When accounting for snow accumulation, the continent is losing about 183 billion tons of ice per year – enough to raise sea levels by about 3 to 5 millimeters per decade by itself. The melting of the Greenland Ice Sheet is likewise accelerating and is now responsible for about 25% of annual sea level rise (8.5 millimeters per decade).

The flow of Antarctic ice, derived from feature tracking of Landsat imagery. Illustration: NASA Earth Observatory
Meanwhile, the Arctic has been remarkably warm in February – as much as 35°C hotter than average in some areas. In mid-winter, when sea ice should be growing, in the Bering Sea it’s instead shrinking.


 Arguments


When talking about SLR contribution, you should look at the ice mass balance, i.e. difference between accumulation and discharge. Accumulation number by itself is meaningless, esp. if warming sub-zeroC temperature results in higher snow precipitation. There is an abrupt tipping point though, when air temp reaches freezing point and snow turns to rain but Antarctica is far away from that point yet.
The only sentence about the ice balance in the article
Doesn't say how much the balance has been changing in the last decade and if the loss's been accelerating. Hansen 2012, for example claims that the loos has been doubling every 7-10 years and that's the number we should concentrate on here as we talk about SLR prediction as antarctic IS loss wil be dominant contribution to future SLR. But the number's missing in the article.
The interesting number to note though, is that ice mass exchange due to melting from below and accumulating from above is ATM 10 times bigger than the ice loss (simlarly to CO2 exchange with the ocean). I wonder if it's going to stay that way (i.e. snow precipitation steadily increases in the warming weather until an abrupt tipping point metionaed above) or we are going to see the ratio lowering as the gap in favour of melting inevitably increases. So far, the ratio is big enough so that, theoreticaly at least, we could slow down the melting by inducing more precipitation of we knew how (aerosol spraying?) before the radiation balance & climate is stabilised.