Climate Science Glossary

Term Lookup

Enter a term in the search box to find its definition.

Settings

Use the controls in the far right panel to increase or decrease the number of terms automatically displayed (or to completely turn that feature off).

Term Lookup

Settings


All IPCC definitions taken from Climate Change 2007: The Physical Science Basis. Working Group I Contribution to the Fourth Assessment Report of the Intergovernmental Panel on Climate Change, Annex I, Glossary, pp. 941-954. Cambridge University Press.

Home Arguments Software Resources Comments The Consensus Project Translations About Support

Bluesky Facebook LinkedIn Mastodon MeWe

Twitter YouTube RSS Posts RSS Comments Email Subscribe


Climate's changed before
It's the sun
It's not bad
There is no consensus
It's cooling
Models are unreliable
Temp record is unreliable
Animals and plants can adapt
It hasn't warmed since 1998
Antarctica is gaining ice
View All Arguments...


Username
Password
New? Register here
Forgot your password?

Latest Posts

Archives

Do critics of the hockey stick realise what they're arguing for?

Posted on 19 October 2010 by John Cook

The hockey stick, a reconstruction of temperature over the last 1000 or so years, is a much maligned graph. Critics of the hockey stick insist it underestimates past climate change. In particular, many insist that temperatures during the Medieval Warm Period were warmer than now. The next logical leap is that if past natural climate change is comparable to today, then current climate change must also also natural. The irony of this line of thinking is that if the Medieval Warm Period did turn out to be much warmer than currently thought, this doesn't prove that humans aren't causing global warming. On the contrary, it would mean the danger from man-made global warming is greater than expected.
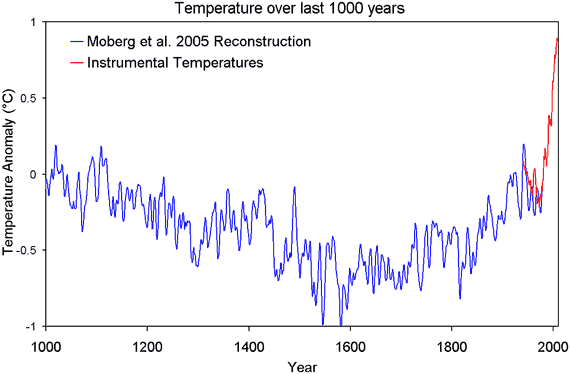

Figure 1: Northern hemisphere temperature reconstruction from Moberg et al 2005 plus instrumental measurements of northern hemisphere land temperature (CRUTemp).

To understand this, you first need to grasp the fact that climate doesn't change by magic. It changes when it's forced to change. When our planet suffers an energy imbalance (eg - the energy imbalance caused by rising CO2), it gains or loses heat. This change in heat is known as a radiative forcing or climate forcing. When our climate experiences a forcing, global temperature changes.

So to understand climate change over the last 1000 years, you need to look at the climate forcing over that time. The overall or net climate forcing is the combined effect of the drivers of climate over this time frame: mainly solar variations, changes in carbon dioxide, volcanic eruptions and aerosols:
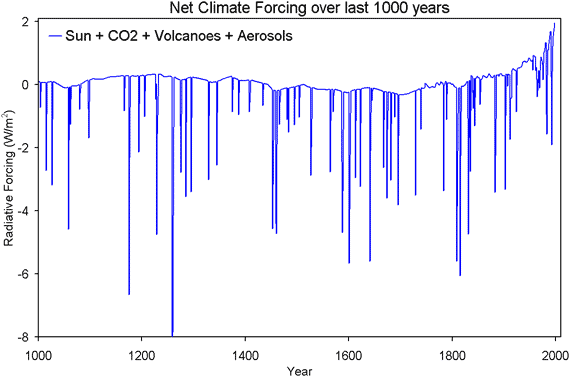
Figure 2: The combined radiative forcing from solar variations, CO2, volcanoes and aerosols (Crowley 2000).

The dramatic spikes are the strong negative forcing from volcanic eruptions. To gain some visual clarity, Figure 3 shows net climate forcing without volcanic eruptions. This gives us a good approximation of net climate forcing as volcanoes for the most part only affect climate for a few years before the sulfate aerosols from the eruption are washed out of the atmosphere.
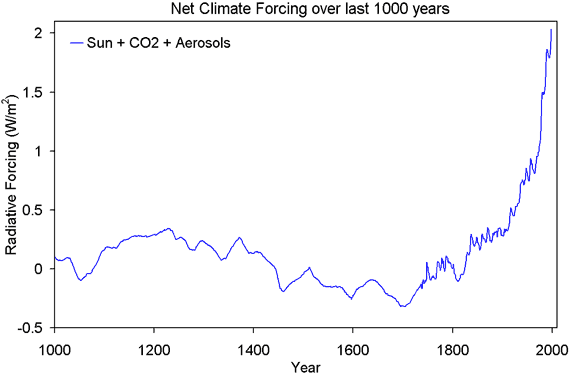
Figure 3: The combined radiative forcing from solar variations, CO2 and aerosols - volcanoes are omitted (Crowley 2000).

The reason we see a hockey stick shape in temperature is because the climate forcing that drives temperature also shows a hockey stick shape. But from this data, we can do a lot more than compare shapes. We can calculate how much global temperature should change when it's subjected to a climate forcing. This information is crucial in enabling us to predict how climate will act in future decades in response to rising greenhouse gases.

The temperature response to a climate forcing is known as climate sensitivity. Technically, climate sensitivity is defined as the change in global temperature if the planet experiences a climate forcing of 3.7 Watts/m2 (which is how much climate forcing you get from a doubling of CO2). The amount of positive feedback in our climate system determines how sensitive our climate is. If there's net negative feedback, the climate sensitivity will be less than 1.2°C. If climate sensitivity is greater than 1.2°C, our planet has net positive feedback. Climate sensitivity can be calculated by using temperature change over the past 750 years along with the change in radiative forcing (Hegerl et al 2006). Doing this yields the following result:
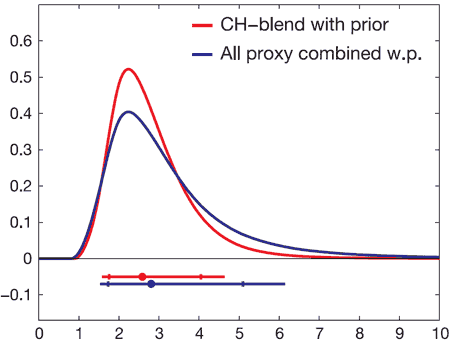

Figure 3: Climate sensitivity from palaeoreconstructions going back 750 years, combined with climate sensitivity calculated from instrumental records. The horizontal bars represent the 5 to 95% range, indicating a climate sensitivity range of 1.5C to 6.2C (Hegerl et al 2006).

When you combine the temperature record over the past millennium with climate forcings, you get a climate sensitivity around 3°C. In other words, net positive feedback. This is consistent with the IPCC climate sensitivity range of 2°C to 4.5°C. Positive feedback is the reason why we expect to see strong warming over the next century in response to the climate forcing from rising CO2.

Can you now see the irony in insisting on a warmer Medieval Warm Period? If for some reason, temperatures over the Medieval Warm Period turn out to be warmer than previously thought, this means climate sensitivity is actually greater than 3°C. The climate response to CO2 forcing will be even greater than expected. So to argue for a warmer Medieval Warm Period is to argue for greater climate sensitivity and greater future warming due to human CO2 emissions.

UPDATE 21 Oct 2010: I've corrected the labelling of Figure 1 from "instrumental temperature measurements of northern hemisphere (HadCRUT)" to "instrumental measurements of northern hemisphere land temperature (CRUTemp)" to clarify that the instrumental data is land temperature, not land and ocean (as the Moberg data is also land only).

0 0

Printable Version  |  Link to this page

Comments

Prev  1  2  3  Next

Comments 51 to 100 out of 115:

  1. Humanity Rules #40 - I suggest you do some reading on efficacies of different forcings. The aforementioned (and linked) climate sensitivity rebuttal is a good starting point.
    0 0
  2. kdkd: Wide error bars arise because of limited information. Do you prefer making decisions based on limited information by artificial foreclosure or would you prefer informed decision making in the context of acknowledgement of uncertainties? Would you rather everyone decided to treat clouds as an inconvenient distraction or would you prefer to see climatologists striving to understand their role better? Eyeballing the AR4 graphic, the cumulative aerosol and cloud albedo effect even *without* the error bars actually approaches the CO2 effect. This is not trivial. The size of the error bars in this context highlights the urgency of the need for better data and better understanding.
    0 0
  3. Phila @ 50: I'm not saying, 'Things won't be that bad.' I'm saying, 'There are many things we don't know which we really need to know.' I certainly think what we know is sufficient to warrant action and I have said so often enough. In my professional life, I'm no stranger to the need for decisive action in the face of major uncertainty. I have to explain this uncertainty to people - indeed, if I failed to do so, I would expose myself to a malpractice suit. Moreover, I prefer being honest with my clientele (it actually feels better doing things that way). At the same time, I certainly want to know more whether it's in my professional life or in an area of interest.
    0 0
  4. chriscanaris #52 All I'm saying is that making strong conclusions about cloud feedbacks, and climate risks is unwarranted from that paper. Meanwhile the bulk of the information available to us suggests that any negative feedback from clouds won't be big enough to remove the anthropogenic forcings. Your strategy suggesting that we should account for this unobserved large negative feedback mechanism would seem unnecessarily risky
    0 0
  5. so there's clearly a good reason to study the role of clouds in forcing feedback, but assuming that it might provide a get out of jail free card seems unwarranted. That is all.
    0 0
  6. kdkd: 'Your strategy suggesting that we should account for this unobserved large negative feedback mechanism would seem unnecessarily risky...' What's the risk? '...assuming that it might provide a get out of jail free card seems unwarranted.' Who said it was get out of gaol free card? Not me.
    0 0
  7. chriscanaris #56 The risk is that if we make unwarranted assumptions that a number is large and negative, if it's small, or positive then we will end up basing policy on a false premise. If you don't want to be seen to be trotting out unsupported climate sceptic talking points, then you need to be more careful in the way that you express yourself ;).
    0 0
  8. 51.dana1981 Thanks for the condescending reply but at least it directed me to some useful info which was what I really wanted. http://www.ipcc.ch/pdf/assessment-report/ar4/wg1/ar4-wg1-chapter2.pdf So this basically confirms what I said was correct. From section 2.8.5.3 (Efficacy and Effective Radiative Forcing - Solar) "These studies have only examined solar RF from total solar irradiance change; any indirect solar effects (see Section 2.7.1.3) are not included in this efficacy estimate." Section 2.7.1.3 rates the scientific understanding of some of these possible indirect effects as low and very low. Let's not mention what the Haigh paper might do to all this. The incorrect statement here is your suggestion that we can't have it both ways. Having it both ways is still an option until we fill the gaps in our knowledge. Which is all I've been arguing here. I thought the concluding statement about volcanic RF in section 2.7.2.2 was also enlightening. "Because of its episodic and transitory nature, it is difficult to give a best estimate for the volcanic RF, unlike the other agents. Neither a best estimate nor a level of scientific understanding was given in the TAR. For the well-documented case of the explosive 1991 Mt. Pinatubo eruption, there is a good scientific understanding. However, the limited knowledge of the RF associated with prior episodic, explosive events indicates a low level of scientific understanding" I wonder just how many bold staements one can make on this subject.
    0 0
  9. Sordnay #25: "Just wondering, on your first graph, is CRUTemp NH, but what is exactly this serie? a 12 month mean of CRUTempNH does not rise more than 0.657" You're looking at anomalies calculated from different baselines. Same data, different 'zero point'. "Anyway, looking again to the first figure, the recent temperature anom. would be about the same as the drop estimated from around 1480-1550 (eyeballing) without a net forcing and in time period somewhat similar to recent anom, a bit higher. What is the reason for this drop?" Cherry picking. You've looked at the noise and picked out the highest peak and lowest drop. Shifting 20 years earlier or later yields radically different results (indeed, the temperature INcreases). Judging by figure 2 the ~1550 drop appears to have been caused by volcanism. The ~1480 peak could have been due to any number of weather factors... like the large up and down swings between them which invalidate the entire premise that this was some sort of trend comparable to the current warming.
    0 0
  10. Posted by John Cook on Tuesday, 19 October, 2010 at 18:07 PM If for some reason, temperatures over the Medieval Warm Period turn out to be warmer than previously thought, this means climate sensitivity is actually greater than 3°C. The climate response to CO2 forcing will be even greater than expected. So to argue for a warmer Medieval Warm Period is to argue for greater climate sensitivity and greater future warming due to human CO2 emissions. Houston, we've had a problem. Reconstruction of climate forcing in Crowley 2000 may be bogus. He assumes an essentially zero CO2 radiative forcing prior to 1600 AD and a very small one before the 20th century. However, in reality it may not be the case. This paper uses density of stomata on fossil leaves, tiny pores doing gas exchange to reconstruct historic CO2 levels. Geology, 01/2005, vol. 33, Issue 1, p.33 DOI: 10.1130/G20941.1 Atmospheric CO2 fluctuations during the last millennium reconstructed by stomatal frequency analysis of Tsuga heterophylla needles Kouwenberg, Lenny; Wagner, Rike; Kürschner, Wolfram & Visscher, Henk Long term average of preindustrial CO2 might have been pretty stable around 290 ppmv, however, they say there were large century scale fluctuations which are invisible in the ice core record due to late bubble enclosure time in the firn-ice transition zone (and diffusion in ice proper, I must add). The most robust feature of their millennial CO2 analysis is a decline after 1000 AD followed by a sharp increase during the 13th century. After that time CO2 forcing based on their data matches Crowley 2000 reasonably well, but for the MWP there is a huge mismatch. The excess warming goes right against changes in forcing and there is no way solar forcing could compensate for it. Strong negative forcing (~ -1 W/m2) between 1160-1180 went with higher than average temperatures while a 1 W/m2 increase of CO2 forcing during the next century is accompanied by steadily decreasing temperatures. A multidecadal transient solar burst of such magnitude and at just the right time is out of the question. Therefore most of the medieval warming must have been unforced variation. Climate can do that, for a strong random walk component with red noise statistics is always present. However, as soon as the possibility of century scale unforced changes is acknowledged, the entire conceptual framework your climate sensitivity calculations are based on collapses.
    0 0
  11. kdkd @ 57: What false premise? I didn't create the numbers - I merely quoted AR4. I was actually surprised by the data - they don't get much prominence in most AGW sites though I'm aware Roy Spencer talks a lot about this stuff. I've never delved into his site barring a very occasional glance but these data suggest I ought to take him more seriously. However, your suggestion that I should be more careful in how I express myself lest I be seen as trotting out sceptical talking points does test my patience. Such language is redolent of heresy hunting. Facts are facts and numbers are numbers. As scientifically minded folk, we are not bound by articles of faith nor should we be wary of doctrinal transgressions. I come to this site for science and not for spiritual sustenance. For the latter, I go to church :-).
    0 0
  12. chriscanaris - you keep suggesting clouds might have a large negative feedback, and that therefore the climate sensitivity would therefore be lower. But I don't see you reconciling that with the evidence presented in Knutti and Hegerl for both observational and modelled equilibrium sensitivity being rather similar. As angliss put very well, we know from palaeoclimatic data the value of the equilibrium sensitivity (within it's error constraints, which seem to range from scary to terrifying), and this necessarily includes clouds, therefore all that can change is just how we get there. The only impact clouds can have is some temporary alteration of the manner in which we get from our present climate to the new equilibrium climate. It seems pretty unlikely, given a total lack of evidence to the contrary, that the trajectory from our lower equilibrioum temperature to our higher equilibrium temperature would involve an initial negative or very low slope excursion from that trajectory (which would then have to accelerate to make up the difference in order to reach the new, higher, equilibrium temperature).
    0 0
  13. BP - why should you trust that obscure paper, which relies entirely on a proxy (and which has been almost exclusively cited only by it's own authors and those who wish to promote a certain point of view) rather than papers that rely on the actual measurements? Did it ever cross your mind that those results could be incorrect? I'm not suggesting they i>are incorrect, just suggesting that a single paper evaluating data from a proxy necessarily has more errors than multiple papers relying on direct measurements... The key here is the large excursion that is not represented in direct measurement data is still present when smoothed, suggesting that the stomatal data may be in error here.
    0 0
  14. #63 skywatcher at 23:43 PM on 20 October, 2010 the large excursion that is not represented in direct measurement data is still present when smoothed You'd better check your facts. Tellus B Volume 57, Issue 4, pages 351–355, September 2005 DOI: 10.1111/j.1600-0889.2005.00154.x Atmospheric CO2 during the 13th century AD: reconciliation of data from ice core measurements and stomatal frequency analysis THOMAS B. Van HOOF, KARSTEN A. KASPERS, FRIEDERIKE WAGNER, RODERIK S. W. Van De WAL, WOLFRAM M. KÜRSCHNER & HENK VISSCHER "A significant CO2 change during the 13th century AD is evident from direct measurements of CO2 in gas enclosures in the Antarctic ice core D47 as well as from stomatal frequency analysis of fossil oak leaves. The independent detection of this CO2 shift, and the good agreement between the different records, provides persuasive evidence for the reality of this event."
    0 0
  15. chriscanaris writes: Ned @ 27: 'It's not reasonable to assume a high value for climate sensitivity in order to get a large MWP, while also assuming a low value for climate sensitivity in order to minimize the effect of AGW.' With respect, Ned, I'm not making any assumptions. I'm simply looking at the range of possibilities which flow from the AR4. On one scenario, clouds may exert a negative feedback greater than the positive feedback of CO2. Is this so? At this stage, we can only guess. I'm afraid I must not be explaining my argument well. You're free consider scenarios where negative feedbacks from clouds are larger than expected. The logical consequence of that is that those scenarios would presumably have a climate sensitivity on the low end of the range (< 3C). But the point is that under such scenarios it would be hard to get a warm MWP or a cold LIA. (If you make the negative feedbacks strong enough, it would be hard to get any glacial/interglacial cycles.) The problem arises when somebody (not necessarily you, just a hypothetical commenter) claims that the MPW/LIA variance was large and simultaneously claims that climate sensitivity is low and/or there are large negative feedbacks from clouds or whatever. This is the climate-skeptic equivalent of trying to have one's cake and eat it too.
    0 0
  16. Reading the posts by "skeptics" (or critics of the HS (reconstructions) on this thread seems to perfectly illustrate that they indeed do not realise/know what they're arguing for....what I see are non-coherent and sometimes even contradictory arguments.
    0 0
  17. HumanityRules - there are certainly gaps in our knowledge. However, a significantly higher climate sensitivity to solar effects than greenhouse gases is not consistent with what we know. Consider for example the early 20th century, during which there was a significant increase in solar activity to the "Modern Maximum". Yet during that period, when there were other positive radiative forcings at play, the planet only warmed about 0.4°C. The data just doesn't jibe with a higher climate sensitivity to other forcings.
    0 0
  18. skywatcher @ 62: I suspect that clouds (like the poor) will always be with us. AR4 pretty well declares that they comprise a substantial negative feedback albeit with what certainly looks like a 'scary to terrifying' margin of error. Some cloud cover changes under a warming scenario may comprise a positive feedback - hence presumably the size of the error margin though agreement between these data and model projections remains problematic. I've just noticed Ned's post @ 65 - assuming we're on the same continent, we both seem to live by a most uncivilised timetable :-). Thank you for putting in the time and effort to explain your argument. Climate sensitivity on a purely intuitive basis seems clearly 'high' - I think Mt Pinatubo serves as prima facie evidence. Mt Pinatubo significantly exerted its transient effect in the face of what was already a substantial CO2 forcing. So what forcing comes most strongly into play will depend very much on whether increased CO2 will be accompanied by concomitant rises in aerosols and the nature of changing cloud cover all of which as best as I can ascertain from my forays on the Internet remain very uncertain (though for the sake of coherence, I have highlighted work pointing towards a more pessimistic scenario). I certainly don't believe we should quietly continue business as usual in the expectation of a series of volcanic eruptions conveniently saving our bacon. I guess the question remains whether a low range (as opposed to a very low range) climate sensitivity renders a LIA or MWP impossible or highly implausible as opposed to merely unlikely. I don't feel remotely qualified to attempt an answer to that one but can't help but wonder in the light of the error margins involved. Moreover, while any atmospheric aerosol or cloud at a particular point in time represents a transient phenomenon (in contrast to anthropogenic CO2 which is very long lived), cloud cover and aerosols comprise a self-renewing and hence non-transient process. Ultimately, I'm asking because I'm curious rather than contrary.
    0 0
  19. chriscanaris writes: I certainly don't believe we should quietly continue business as usual in the expectation of a series of volcanic eruptions conveniently saving our bacon. [...] Ultimately, I'm asking because I'm curious rather than contrary. Yes, I understand that and appreciate your reasonableness. However, I do think you're still stuck on the (mistaken) idea that cloud cover is somehow independent of climate sensitivity. The uncertainty in cloud albedo feedback is directly responsible for much of the uncertainty in climate sensitivity. So, if someone looks at the MWP/LIA (or at Pinatubo for that matter) and concludes that those events had a significant impact on climate, you're right that that implies a "high" (or at least non-"low") climate sensitivity. But the further implication is that there isn't a huge negative feedback from clouds. Remember that with no feedbacks at all, climate sensitivity is around 1C. The sensitivity range given in IPCC (2-4.5C, with a best estimate of 3C) specifically includes the effects of feedbacks. If feedbacks turn out to be more negative than the best estimate, then sensitivity must also be lower than the best estimate, and that would argue against the existence of a high-amplitude, globally consistent MWP or LIA. assuming we're on the same continent, we both seem to live by a most uncivilised timetable Actually, I am writing this from New England, USA, where it is just about noon on a gorgeous autumn day.
    0 0
  20. chriscanaris: At the same time, I certainly want to know more whether it's in my professional life or in an area of interest. What may be confusing people is the apparent implication that this somehow makes you different from anyone else, or that this view is some sort of alternative or corrective to what the what of us think. Everyone here wants to know more. Climate scientists also want to know more, obviously, and are working hard to do so, even though it's a thankless task at the best of times. That said, we also know that we need to act, for the simple reason that the uncertainties here are unlikely to work in our favor. Things could be much worse than we expect, a little worse, about the same, a little better, or a lot better. The only one of these possibilities that doesn't require timely action is the last one, and it's also the least likely.
    0 0
  21. I encourage people to actually read the discussion section of the paper by van Hoof et al. that BP is citing @64. There are many caveats in there. BP also left out this part regarding what is meant by "A significant CO2 change during the 13th century AD" as inferred from their research: "The effect of the synthetic smoothing of CO2 [SI] leads to a 25% reduction of the amplitude from 34 ppmv in the raw data to a maximum of 25 ppmv according to the model output." Others found an increase of 12-15 ppmv in the 14th Century. So the changes are at most < 10% of pre-industrial levels of CO2; to place that in context we have already increased CO2 by 40% over pre-industrial levels and will go on to double the concentration of CO2. And we know form isotope analyses that the increase in CO2 levels are primarily from anthropogenic activities, not hypothetical random walks or hypothetical "century scale unforced changes" (more on that below). It should also be noted that that particular study found the increase in CO2 in the Antarctic ice core to occur around 1300 AD, whereas multiple paleo temperature reconstructions for the N. Hemisphere show the peak MWP to be around 1000 AD (e.g.,Ljungqvist, Mann, Moberg), with notable cooling starting shortly thereafter. So the MWP occurred some 300 years earlier than the small increase found by van Hoof et al. This is not surprising given that in the past CO2 changed primarily in response to feedbacks, and probably indicates that the small (<10%) increase observed in CO2 circa 1300 AD was in response to the warming in the N. Hemisphere (most likely arising from regional warming b/c of changes in internal climate modes) during the MWP some 300 years prior. So, to me, these papers that BP is citing demonstrate that in ambient CO2 levels can increase/decrease in part because of (lagged) positive feedbacks, and that these feedbacks can occur on account of internal climate variability or internal climate modes (such as the AMO and NAO, see Mann et al. 2009). Looking forward, the contribution of the feedbacks to global CO2 levels will probably be dwarfed by present and future anthro emissions. I am a little suspicious of the CO2 levels shown in Kouwenberg et al. Note the huge decadal variability/noise-- with shifts in CO2 levels of 50-100 ppm between subsequent data points (separated by as little as 50 years). We have over 50 years of high temporal resolution and reliable CO2 measurements from Mauna Loa, and there is no sign whatsoever of natural variability or random walks causing huge departures (on the dacadal time scale) from the long-term trend. So again, Kouwenberg seems to be way too noisy and it is quite conceivable that the century-scale variability in CO2 that BP is alluding to is an artifact of that noise. Regardless, the climate sensitivity has been derived from multiple, independent lines of evidence, including estimates of climate sensitivity following volcanic eruptions (e.g., Pinatubo). And they all point to a climate sensitivity of near +3 C for doubling CO2. At the end of the global SATS are currently warmer were observed during MWP (e.g., Mann et al. 2009), and Hansen et al. (2010) has showed that the long-term rate of warming has continued more or less unabated. What we are going to experience ion terms of warming will dwarf the MWP, so "skeptics" harping on the MWP is, IMHO, a simple diversionary tactic from this:
    0 0
  22. I see you have rattled a cage over with Steve Goddard who is claiming your Moberg graph is 'a new level of BS'; http://stevengoddard.wordpress.com/2010/10/20/cooks-hokey-stick/
    0 0
  23. Oh that precious Steve Goddard. After ranting about how John's graph shows more recent warming than the Hadley land+ocean data, he adds an update. "Reader “robert” tells me that Cook is using land-only northern hemisphere data in his “northern hemisphere” graph." No freaking duh. Past temperature reconstructions are based on land proxies (mainly in the Northern Hemisphere), and thus represent land-only NH temps. So that is the appropriate instrumental data to use. As usual, Goddard spends an entire blog post criticizing somebody who's correct. What a joke. Goddard also claims that John "goes on and does climate sensitivity calculations based on bogus data from a cherry-picked hemisphere." Aside from the data neither being bogus nor from a cherrypicked hemisphere (anyone even slightly familiar with temperature reconstructions should know they're usually done for the NH, from which more proxy data is available), John doesn't do any climate sensitivity calculations at all in this post. It amazes me that somebody so completely ignorant about climate science could be so utterly oblivious as to write a climate science blog.
    0 0
  24. Chriscanaris #61 "What false premise?" The one where one creates policy based on assuming that the true value of an estimate is at the extreme negative value of a very wide error bar. "However, your suggestion that I should be more careful in how I express myself lest I be seen as trotting out sceptical talking points does test my patience." Sorry, I should be more clear here. Scientific language is generally very cautious and conservative. Much of the 8 year or longer training process for practicing scientist involves getting practitioners used to this aspect. It's not a personal attack, or a search for heresy, it's an observation about the conventions that allow us to use scientific data to draw conclusions.
    0 0
  25. Phila @ 70 What may be confusing people is the apparent implication that this somehow makes you different from anyone else, or that this view is some sort of alternative or corrective to what the what of us think. Sorry to confuse :-) I've long shed any pretensions to any unique status. KDKD: With respect, your language was certainly neither conservative nor cautious. I've been reading scientific literature principally in my field for as long time - I do have some passing familiarity with academic writing. Moreover, I did *not* at any time suggest that 'one creates policy based on assuming that the true value of an estimate is at the extreme negative value of a very wide error bar.' Ned: You're right - I genuinely do find the notion of the apparent mutual exclusivity of high climate sensitivity and negative feedback from clouds difficult to grasp. Give me time - and I'll certainly go hunting around the Internet for ideas.
    0 0
  26. chriscanaris #75 Can you please point out where you perceive my language was incautious? If you're not advocating policy based on assuming that the true value of an estimate is at the extreme negative value of a very wide error bar, then that's fine. However you haven't made this clear. What would climate sensitivity be with strong negative feedback from clouds assumed by the way?
    0 0
  27. Goddard is just trying to get attention, and should probably be ignored. The comment here by Albatross is just great. I too had read through the van Hoof 2005 paper but didn't get around to commenting, and I'm glad I didn't waste my time because Albatross's response is better than mine would have been. Once again BP is making strong claims that don't really stand up under close examination. This is IMHO unfortunate because many of the papers or sources that BP cites in his comments on this site are very interesting and could probably lead to some good discussions if he could just stop making these exaggerated claims that every one of them conclusively disproves AGW. A more modest approach to interpreting the evidence would probably do wonders for BP's credibility on this site, IMHO.
    0 0
  28. chriscanaris writes: Moreover, I did *not* at any time suggest that 'one creates policy based on assuming that the true value of an estimate is at the extreme negative value of a very wide error bar.' I agree, you didn't suggest that. This is a busy site and when the comments get flying it's easy for us all to misinterpret each other. I know it's very annoying when people misunderstand me, or attribute someone else's views to me, or whatever. In kdkd's defense it gets a bit tiresome being repeatedly confronted with an argument that appears to be, in essence, "Well, there is a large uncertainty band around the best estimate for [whatever], so maybe things won't be as bad as those doomsayers claim." Your comments have much more nuance than that, and all of us should probably do a better job of being alert to nuances in others' comments. It's difficult when one's patience is worn down by some of the more unreasonable and unhelpful commenters here. More chriscanarises among our SkS "sceptic" contingent would be a distinct improvement, IMHO.
    0 0
  29. Ned @ 69: Take a look at this excerpt on climate impact of volcanoes. 'Volcanic aerosol particles scatter and absorb a fraction of incoming solar radiation, as well as absorbing a fraction of outgoing terrestrial radiation. The change in global temperatures caused by the aerosols from El Chichon and Mt Pinatubo is estimated to be 0.2¡C and 0.5¡C. However both these values lie within the natural variability of temperature.' Volcanic forcings don't seem to behave differently from aerosol and cloud albedo forcings though undoubtedly they are presumably nearly entirely independent of temperature whereas the relationship between aerosols, clouds, and temperature eventually becomes very complex and, somewhat to my regret, confusing partly because of the uncertainties around the feedbacks.
    0 0
  30. chriscanaris, what am I supposed to be seeing in that quote? I'm afraid I'm not getting it. Volcanic aerosols are a forcing. Anthropogenic aerosols are also a forcing, but cloud albedo is a feedback. The terminology is important, but even with that aside I'm still not quite following what you're trying to say. Maybe if I sign off for the night and get some sleep it will be obvious in the morning...
    0 0
  31. I guess we should leave it alone, Ned - sometimes communication fails with the best will in the world. I supect the fault (for want of a better word) lies much more with me than with you. The AR4 graphic in your comment @ 8 refers to forcings only seemingly including cloud albedo under that rubric. Maybe that has contributed to the confusion. Thanks for trying :-).
    0 0
  32. chriscanaris #81 Probably all you need to do is to provide an unambiguous, justifiable set of conclusions at the end of your post. This is standard practice in the scientific literature, and prevents misunderstanding.
    0 0
  33. Sorry about the broken link. I'll try again. Judith Curry makes an interesting statement in the comments over at her place “This argument about strong MWP and LI implying strong sensitivity drives me nuts. It implies that the MWP and LI are forced. If they are natural internal oscillations, then this would imply lower sensitivity to CO2.” She promises a series on climate sensitivity next year. Paul
    0 0
  34. pm, Personally I don't find hand-waving over "natural internal oscillations" particularly convincing. Whether it technically counts as a "forcing" or not is somewhat beside the point. If the temperature is changing then there must be some underlying physical process responsible for the change. If the MWP was warmer than it is today, then there are two ways this can be squared with current knowledge: a) Sensitivity to known forcings is higher than predicted. b) Some as yet unknown or misunderstood physical process is responsible for the MWP and LIA Most skeptics obsessed with the MWP seem convinced that option b is automatically implied by a warmer than expected MWP. In reality, the only convincing evidence of option b would be a explanation of what this mysterious process is exactly combined with robust empirical evidence that it functions as hypothesized. I have yet to see a single skeptic scientist provide anything close to this. Given the fact that known forcings already recreate the general shape of the temperature trend (the MWP and LIA), option a would fit better with the current evidence.
    0 0
  35. In response to BP and Albatross I'm reading a follow up paper from the same authors: Van Hoof et al 2008. I still notice a +/- 10 to 20ppm difference at times between the ice core and stomata data which the paper partly blames on smoothing of the ice core data. The authors also argue for a larger role and acceptance of stomata proxies as a decadal to millenial resolution proxy by the IPCC. They appoint the 13th century increase to massive forest clearing in Europe and the 14th century decrease to reduced human activity after the black death outbreak. Antropogenic changes as such. They then note (which will please BP so he can claim 'bad data'): The presence of high-amplitude CO2 fluctuations as documented by stomatal frequency studies may falsify the IPCC concept that preindustrial temperature variability is constrained by relatively stable atmospheric CO2 levels. But, hold on, don't get exited yet... They also note: A higher degree of CO2 variability during the last millennium must have resulted in a more prominent role for CO2 as a forcing factor of air-temperature changes. So BP's victory over the flatness of the ice core CO2 records is of the Pyrrhic kind which fits perfectly to this threads subject: "Do critics of the of ice core CO2 records realise what they're arguing for?"
    0 0
  36. e at 05:16 AM on 22 October, 2010 No, energy distribution plays a massive role in climate, that is all the malankovitch cycles do... the younger dryas episode is believed to be the direct result of the slow down of oceanic energy transport. These things matter, and would need to be quantified to calculate sensitivity. I would hate to think what the inferred sensitivity would be using this method on the holocene climate optimum... Or the massive negative feedback inferred from the younger dryas... Ok so we can calculate malancovitch cycles effect through changes in solar distribution, how about the oceans? So currents are going to be driven by variable salinity and energetic state, and atmospheric interaction, driven by variable convection, with pressure systems being affected by stratospheric interactions with variable UV... Its not a case o co2 is this, there fore the average T is thus.. you need to know how the energy is being distributed around the globe, and whether this is affecting the inferred climate of the reconstructions. You need to know all the variables.
    0 0
  37. BP - Albatross has provided a better explanation than you could hope for in the explanation of your stomatal paper link. cynicus' last comment is distinctly relevant. You have to be very creful when you base your whole argument on cherry-picked sections of a single dataset, especially if you do not consider the uncertainties or come to the same conclusions as the authors. But what it ultimately comes down to is the fact that every climate change requires a forcing, and to date there is no coherent evidence for large internal variations in climate, let alone large internal variation that just so happen to occur when we are forcing the climate which a factor that even at the low end ought to produce substantial warming.
    0 0
  38. Joe Blog, I never claimed that internal energy distribution plays no role. What I said was that no skeptic has come forward with a specific physical theory on how exactly the MWP and LIA came about, if not by the existing known processes and forcings. I also pointed out that a warmer than currently accepted MWP in no way implies that there must be some sort of additional unknown process at play, as many skeptics seem to assume. Since the overall shape of the temperature trend reflects the effect of known forcings, then a higher climate sensitivity would be consistent with the observation of a warmer than expected MWP. I see no reason to assume some unknown process. If skeptics believe there is a natural oscillation at play, they need to explain the physics and provide evidence why their theory is true and prevailing theory is false. Otherwise its nothing more than a guessing game.
    0 0
  39. e at 12:58 Its possible that long term ocean/THC oscillations are driven by the gradual build up of energy in the north Atlantic, and its effect on arctic melt and salinity. A strong THC will build up energy over time in the north atlantic(increasing sst, increasing evaporation/GHE), leading to increasing arctic melt, resulting in reducing salinity in the arctic regions, reulting in a slowing of the thc, which will lead to reduced energy transport(reduced SST/evaporation/GHE), which leads to increased ice cover, and reducing salinity, increasing density of the colder waters leading to increasing the energy export through the THC. etc This isnt really an unknown, and it would be capable of considerably influencing climate, without a need for a change in forcings, but oscillate around a mean, driven by a greater differential in energy, and slowed as the differential across latitudes reduces. The fact is we dont have enough high resolution data to say why, its all speculation... but this would fit what i have read on the MWP, being more noticable in the NH, with less ocean/more land, less thermal capacity than the SH.
    0 0
  40. Joe, So how would an extra warm MWP be evidence for this particular hypothesis over existing theory? That's the core issue I see with skeptic claims regarding the MWP. When I say I've seen no specific theory offered by skeptics, I mean at a level of detail that makes specific testable claims. An implication of the hypothesis you described is that whatever oscillation caused the MWP may have a role in warming today. So how do you prove it? What evidence would tell you that this particular hypothesis may be true and existing theory flawed or mistaken? Another thing I consider: if this hypothesis is true and the current understanding of climate is significantly flawed, why does it work so well? Why do current models recreate historical temperatures as well as they do? How do millenia of climate data just happen to synch up with an incorrect theory? Any theory that rewrites the explanation of the MWP needs to square itself with the remaining bulk of evidence. If robust evidence arises to the contrary I'd be happy to change my mind, but at present I see no reason why the MWP - whether it is warmer or not - should cast doubt on the mainstream science.
    0 0
  41. e at 14:58 PM As to the science, this is part of it, the extreme swings during glaciations would be evident of it. The younger dryas is "generally" accepted as an extreme case of this scenario, where ice dams breaking, causing a sudden massive flux of fresh water stalled the THC. It would be evident with greater lower water anomalies than atmospheric(during times o greater THC export), it could potentially i suppose show a reduction in hurricane intensity in the tropics during times o greatest increase in THC(just due reduced depth o warm water, greater export of energy from tropics), changing the opacity o the atmosphere changes things o course. It would mean a more rapid build up of energy, and slower decline than during pre industrial times. Im not saying this is driving climate at the present, im saying this is one physical mechanism capable of driving unforced climate oscillations. And is certainly a contender for the likes o the MWP/LIA It would also cause outgasing at times of warming(increasing co2) and reduce co2 during cooling phases. Although no where on the scale o anthropogenic contributions.
    0 0
  42. Going a little further than "e," it doesn't really seem as though the MWP-- whatever its extent and magnitude-- addresses the current physics problem at all. That's something that leaves me not really caring about the MWP, except as a more abstract puzzle. The MWP seems just a specific case of "the climate's changed before." So what?
    0 0
  43. Joe> Im not saying this is driving climate at the present, im saying this is one physical mechanism capable of driving unforced climate oscillations. Fair enough, but I think this (a change to our knowledge of the physics in action today) is exactly what skeptics imply when they focus on the MWP, when that conclusion really does not follow.
    0 0
  44. "The irony of this line of thinking is that if the Medieval Warm Period did turn out to be much warmer than currently thought, this doesn't prove that humans aren't causing global warming. On the contrary, it would mean the danger from man-made global warming is greater than expected." Surely this is circular reasoning? It's like saying that previou ice ages and interglacials, where average temperatures swung by more than 8 C also makes the danger from AGW greater. Flawed logic in my book.
    0 0
  45. It is arrogant to claim, that we know the climate forcins since 1000 years. It is actually very arrogant. You simply dont have the required data to sort it out. Surely, to some extent, we know the TSI and CO2 forcings on the past, with at least some accuracy. But we have no information at all, about the decaedal and even possibly centennial cycles on ocean dynamis, for example. If climate modelers cant explain MWP they are definitely also unable to explain the modern maximum. Only thing they can explain with the models is a hockey stick with a flat handle. It is absolutely impossible to replicate an oscillating climate with CO2 as a driving component - as we know fisrst rise the temperatures and then CO2 - it has been definitely a secondary factor, since the unknown forcings X could turn the events in to global cooling, even when CO2 ppm was at the highest. You just cant understand the future before understanding the history. And history is something that is definitely not well understoond. And for those people who praise the (in)famous Hockey Stick and its blade I suggest you open McShane & Wyner pg. 3 and read what they write about adding thermometer temps on proxy records. The overall variation in proxies is necessarily a lot smoother, and placing thermometers on top of the proxy reconstructions it gives an illusion that the proxies are more accurate than they really are. So please. Treat proxy data as proxy data and thermometer as thermometer data. They are not comparable and in common statistics it is not allowed to combine differently measuret datasets together.
    0 0
  46. Dana: "This post sums up perhaps one of the worst skeptic contradictions. They love to say the MWP was hot, and they love to say the climate isn't sensitive. You can't have it both ways." I don't think that makes sense. As a sceptic, I believe that the mainstream science, up until recently. considered the MWP to be warmer than today and global. On the point of sensitivity, I thought everyone more or less agreed than climate sensitivity is around 1 to 1.5 C, without feedbacks. The real question (and unknown) is the magnitude and direction of the feedback.
    0 0
  47. #80 @ Ned: Provide us evidence, that clouds are only a feedback. Please, explain an oscillating climate with positive feedbacks with TSI and CO2 as driving components. How can temperatures fall on any occasion? Only if TSI dominates over CO2? How is this possible on either scenarios, either positive or negative feedbacks? The problem with positive feedbacks is that it would lead in to unending loop of warming. Since CO2 concentration in the atmosphere used to be controlled by sea surface temperatures. If CO2 is also driving the temperatures it would definitely need a forcing on a larger scale to turn it into cooling. The problem with negative feedbacks would be the overall variation, since they would also compensate any warming effect but also compensate any cooling effect. And here comes my thought: the feedbacks on sun variations are actually positive, since the sun has an ability to control the coulds so that more TSI will be let in. This theory is also being tested on the CLOUD project in CERN. But feedbacks to any radiative forcing would be negative, while increasing humidity thus increasing clouds. Unfortunately we dont have the data to prove either case from the history. We just dont. Therefore we cant understan the present either. Only thing we have, is a strong historic correlation between cosmic rays and tropical monsoon, glacier retreat and temperatures. This suggest, there very well might be an effect, thus the feedbacks being "measured" from the radiative budget are being biased being positive when actually the change is natural while negative feedback is occuring (R. Spencers cause vs effect problem).
    0 0
    Moderator Response: You'll need to use the search box at upper left to find an appropriate thread for discussing forcing, which is not the topic of this thread.
  48. craig wrote : "As a sceptic, I believe that the mainstream science, up until recently. considered the MWP to be warmer than today and global." Perhaps you could give some examples of the "mainstream science" which "until recently" considered any of that as being true ?
    0 0
  49. craig, please provide some examples not involving Wiki, if you wish. I don't mind where they come from, as long as they are from the original sources and mainstream, i.e. not filtered via other websites/blogs.
    0 0
  50. #97: "a strong historic correlation between cosmic rays and tropical monsoon, glacier retreat and temperatures." What correlation is this? Provide some evidence, rather than just a claim. We've gone through this in detail here. No such correlation stands up to scrutiny. "the sun has an ability to control the coulds so that more TSI will be let in. This theory is also being tested on the CLOUD project in CERN." No, CLOUD is testing the effect of cosmic ray flux on cloud formation; that doesn't measure TSI in any way.
    0 0

Prev  1  2  3  Next

You need to be logged in to post a comment. Login via the left margin or if you're new, register here.


The Consensus Project Website

THE ESCALATOR

(free to republish)


© Copyright 2024 John Cook
Home | Translations | About Us | Privacy | Contact Us