Climate Science Glossary

Term Lookup

Enter a term in the search box to find its definition.

Settings

Use the controls in the far right panel to increase or decrease the number of terms automatically displayed (or to completely turn that feature off).

Term Lookup

Settings


All IPCC definitions taken from Climate Change 2007: The Physical Science Basis. Working Group I Contribution to the Fourth Assessment Report of the Intergovernmental Panel on Climate Change, Annex I, Glossary, pp. 941-954. Cambridge University Press.

Home Arguments Software Resources Comments The Consensus Project Translations About Support

Bluesky Facebook LinkedIn Mastodon MeWe

Twitter YouTube RSS Posts RSS Comments Email Subscribe


Climate's changed before
It's the sun
It's not bad
There is no consensus
It's cooling
Models are unreliable
Temp record is unreliable
Animals and plants can adapt
It hasn't warmed since 1998
Antarctica is gaining ice
View All Arguments...


Username
Password
New? Register here
Forgot your password?

Latest Posts

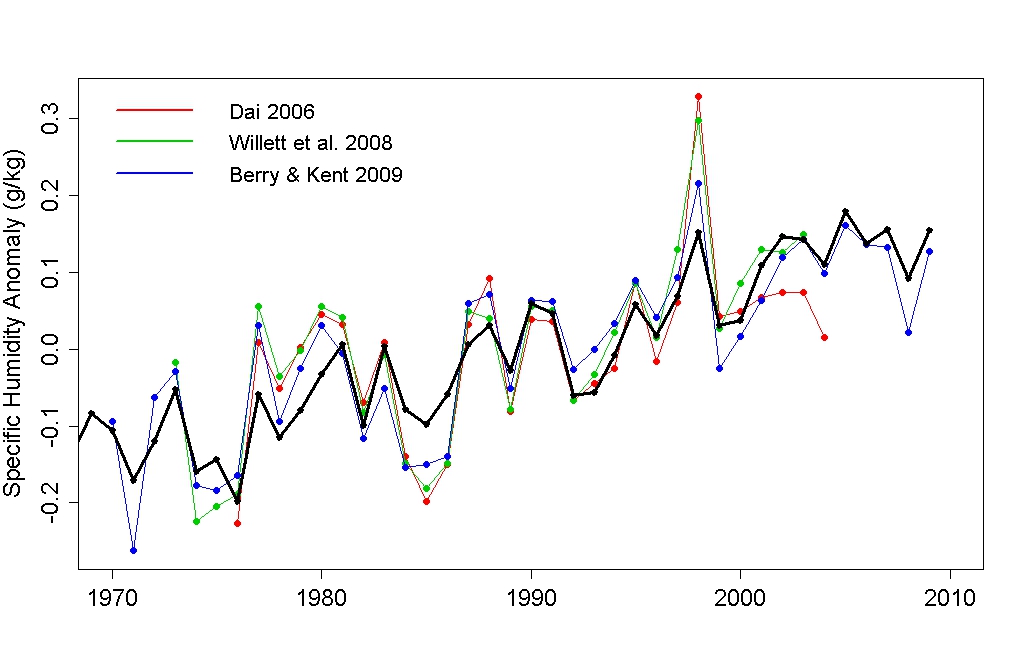
Archives

The human fingerprint in the daily cycle

Posted on 20 November 2010 by John Cook

During the day, the sun warms the Earth's surface. At nighttime, the surface cools by radiating its heat out to space. Greenhouse gases slow down this cooling process. This is why deserts cool so much at night. Water vapour is a strong greenhouse gas and the dry desert air traps much less heat than more humid areas.

A more extreme example is the moon which has no atmosphere. At nighttime, there are no greenhouse gases to trap the outgoing heat. Consequently, the difference between day and night is more extreme with daytime temperatures getting up to around 118°C and nighttime temperatures falling below -168°C. In other words, the stronger the greenhouse effect, the smaller the difference between daytime and nighttime temperatures.

We are currently experiencing global warming. If an increased greenhouse effect is a significant part of this warming, we would expect to see nights warming faster than days. There have been a number of studies into this effect, which confirm that this is indeed the case. One study looked at extreme temperatures in night and day. They observed the number of cold nights was decreasing faster than the number of cold days. Similarly, the number of warm nights was increasing faster than the increase in warm days (Alexander 2006).
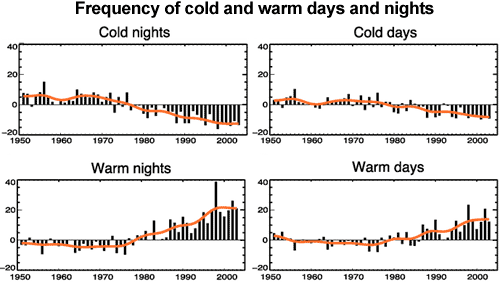
Frequency of cold and warm days and nights
Figure 1: Observed trends (days per decade) for 1951 to 2003 in the number of extreme cold and warm days and nights per year. Cold is defined as the bottom 10%. Warm is defined as the top 10%. Orange lines show decadal trend (IPCC AR4 FAQ 3.3 adapted from Alexander 2006).

The difference between daytime and nighttime temperatures is also known as the diurnal temperature range (DTR – the difference between minimum and maximum daily temperature). An increased greenhouse effect should cause the DTR to decrease. Over the last 50 years, DTR over land has shown a large negative trend of ~0.4°C (Braganza et al. 2004). The reason for the falling DTR is because nighttimes have been rising faster than daytime.

The daily cycle also offers interesting insights into climate change over the 20th Century. From the 1950s to early 1980s, global temperatures cooled slightly. A large contributor to the cooling was "global dimming" from 1958 to 1990 where less sunlight made it to the Earth's surface due to air pollution. However, over this period, the nighttime minimum temperature increased. While global dimming was cooling daytime temperatures, the increased greenhouse effect was warming the nights (Wild et al 2007). Even during mid-20th Century cooling, greenhouse warming was percolating away while we were sleeping.

0 0

Printable Version  |  Link to this page

Comments

1  2  Next

Comments 1 to 50 out of 77:

  1. Hasn't this very post been published on Skeptical Science before...? I vaguely recall reading something very much like this post. Unfortunately, I can't recall when or I'd be able to produce a cite. Okay, I think I found it: http://www.skepticalscience.com/What-happened-to-greenhouse-warming-during-mid-century-cooling.html The concluding remarks are (almost) exactly the same:
    Nevertheless, the CO2 warming was still percolating away while we were sleeping. [Emphasis mine for the only difference.]
    Now that I look at it, the posts as a whole are not quite the same.
    0 0
    Response: Yes, I did plagiarise myself a little. This post is a focus on the daily cycle (plus explaining in more detail WHY the daily cycle should shrink) but as an afterthought, I decided to tack on that bit about mid-century cooling. I couldn't resist rehashing the percolating line at the end.
  2. Shoot, HTML fail when posting hyperlink. Try this instead.
    0 0
  3. A glaring fingerprint are the so-called 'urban CO2 domes' in large cities. Various studies show consistent evidence that CO2 concentrations 30-40% higher than the global 'background' are found in urban centers. For example, Koer et al, 2002: Phoenix, Arizona had a peak concentration in excess of 500 ppmV in 2000 (while MLO was 369). CO2 concentration is are higher during weekdays than weekends and especially during peak traffic hours. ... anthropogenic sources of CO2 appear to be largely responsible for the CO2 dome present in the Phoenix valley. Vehicles are by far the largest contributor (79.9%) of CO2 in Phoenix. There is also strong seasonal variation, corresponding with the heating season. Wang et al 2002: The seasonal variation of atmospheric CO2 concentration in Beijing exhibits a clear cycle with a minimum in summer and a maximum in winter almost every year. From 1993 to 2000, the concentration of atmospheric CO2 averaged 384.1±13.5 in spring (Mar Apr May), 369.0±6.9 in summer (Jun July Aug), 400.4±15.7 in autumn (Sep Oct Nov), and 426.8±20.6 in winter (from Dec Jan Feb next year). In winter, the combustion of fossil fuel for heating emitted a great quantity of CO2 in Beijing, and the photosynthetic sink of CO2 is quite low because most of the plants in Beijing are deciduous plants. The human fingerprint is unambiguous. From Velasco 2005, reporting about Mexico City: ... an average difference of 20 ppm was observed during the morning rush hour between the Holy Week (week 2) and the first week of the campaign. This difference represents the vehicular traffic reduction due to the national holiday period during week 2. The average difference between week 1 and week 3, in which almost all schools were still on holiday, was 6 ppm.
    0 0
  4. It does make sense that the stronger the greenhouse effect, the smaller the difference between daytime and nightime temperatures. But it doesn't make much sense why the moon, which doesn't have a greenhouse effect, has daytime temperatures of 118 degrees celsius. Why is it very different on Earth when it experiences global warming? Why aren't daytime temperatures decreasing as the greenhouse effect strengthens, like on the moon?
    0 0
  5. Karamanski, daytime temperatures on Earth are not decreasing, they are increasing. They just aren't increasing as fast as nighttime temperatures are. The cooling of daytime temperatures from the 1950s to the early 1980s was not due to increasing greenhouse gases, but to reflective aerosol pollution.
    0 0
  6. Karamanski, see the post How Much Did Aerosols Contribute to Mid-20th Century Cooling?.
    0 0
  7. Why should greenhouse gases (GHGs) reduce diurnal temperature range (DTR)? Yes, the sun warms the earth's surface during the day, but some of the heat is radiated into space. GHGs reduce that radiation loss both day and night. It's not obvious to me that the effect of GHGs should be greater at night. None of the three papers cited presents an argument that greenhouse gases should reduce DTR. Braganza's simulations predict a much smaller change in DTR than has actually been observed. See his Figure 2. The same claim is made here: http://www.skepticalscience.com/Empirically-observed-fingerprints-of-anthropogenic-global-warming.html, "Climate models predict that as a consequence of anthropogenic global warming, the planet should warm more at night than during the day." This argument needs more support and a reference or two.
    0 0
  8. Karamanski, without much of an atmosphere, the Moon lacks the Earth's 26% reflected and scattered by atmosphere and clouds. So during the day, the Sun has little impediment to heating the surface.
    0 0
  9. Jeff T, I don't know why DTR should decrease due to GHG increase. But I do know that increased radiance from the Sun should increase DTR by increasing day temperatures more than night temperatures. DTR's failure to increase is yet more evidence that the Sun is not to blame for overall warming.
    0 0
  10. This is just my own thinking here without looking into the scientific literature on the matter: I think the reason for DTR decrease has something to do with the differences in the ratios of the forcings during the day and during the night. During the day the sun contributes to the temperature strongly and GHG forcing is not so large player during the day. During the night the solar forcing gets very small and GHG forcing dominates. If GHG forcing increases, it has larger effect during the night because its fraction of the whole forcing is bigger then.
    0 0
  11. Jeff T @7 - It's not obvious to me that the effect of GHGs should be greater at night. You make a valid point. Further to Ari's suggestion: Effects of Clouds, Soil Moisture, Precipitation, and Water Vapor on Diurnal Temperature Range "The nighttime minimum temperature is largely controlled by the greenhouse effect of lower atmospheric water vapor, while the daytime maximum temperature depends heavily on the surface solar heating, which is strongly affected by cloud cover, and the amount of it that is released into the air by sensible and latent heat, which depends on soil moisture content."
    0 0
  12. #7: "Why should greenhouse gases (GHGs) reduce diurnal temperature range (DTR)?" You've answered your own question: "GHGs reduce that radiation loss both day and night." During the day, there is more incoming solar radiation, so the ground/water heat up or maintain an equilibrium. At night, there is no incoming solar radiation, so the ground gives up heat with little to replace it - except by conduction/convection. Since more GHGs are in the atmosphere, more of that outgoing LWIR is trapped -- and what should be cooler nights turn into warmer nights. Here's a primer: CO2 ... traps radiation or heat given off by the earth. This captured heat warms the lower atmosphere, preventing strong nighttime cooling. Carbon dioxide levels are highest near industrial sections since carbon dioxide is the by-product of combustion, a common manufacturing process. The atmosphere surrounding large cities contains higher concentrations of carbon dioxide, thus nighttime cooling in large cities is less than in surrounding areas.
    0 0
  13. muoncounter, how much higher can carbon dioxide concentrations be around densely populated urban areas compared to the global CO2 concentration? How large of an impact can local variations in carbon dioxide concentrations have on nightime temperatures?
    0 0
  14. Rob @11, thank you for the link to Dai et al. (1999). They find that changes in cloud cover cause the reduced DTR. Therefore, GHGs would be responsible for reduced DTR only if they change the clouds. That sequence of causation seems to be a negative feedback. muoncounter @12, I don't follow your logic. Here is a simplified version of my argument: During the day, the vertical heat flux is D = SolarInsolation(S) - NetLongWaveRadiation(R) At night, the flux is N = -R The difference in the fluxes is D - N = S - R -(-R) = S Suppose that GHGs reduce R to R'. Then we have D = S - R', N = -R' and D - N = S. The day/night difference doesn't change. If the difference in fluxes doesn't change, the temperature range shouldn't change. The argument that GHGs cause the observed reduction in DTR seems pretty weak.
    0 0
  15. #13: "how much higher can carbon dioxide concentrations be around densely populated urban areas" Phoenix, due to its topography, is one of the worst CO2 domes I've found in the literature, as in Wang and Starzewski 2004: Recent measurements reveal that atmospheric carbon dioxide (CO2) concentrations in the urban core of Phoenix, Arizona, are often 200 ppmv above the surrounding areas. This increase is up to two orders of magnitude higher than comparable values in other cities. ... Measurements taken to date reveal that the CO2 levels are greatest during the winter morning periods when the atmosphere is most stable and Phoenix vehicular traffic is increased substantially by its many winter visitors. As far as the direct impact on temperature due to 'locally' increased CO2, that seems to be an open, and in my opinion, very interesting question. Balling et al 2001 concluded that the impact was small, as the "elevated levels of CO2 decline rapidly to the height of the morning inversion layer". How they measured this by airplane during the morning rush hour is not clear. On the other hand, Stott et al 2004 spoke in terms of probabilites: ... estimate the contribution of human-induced increases in atmospheric concentrations of greenhouse gases and other pollutants to the risk of the occurrence of unusually high mean summer temperatures throughout a large region of continental Europe. Using a threshold for mean summer temperature that was exceeded in 2003, but in no other year since the start of the instrumental record in 1851, we estimate it is very likely (confidence level >90%) that human influence has at least doubled the risk of a heatwave exceeding this threshold magnitude.
    0 0
  16. #14: "a simplified version of my argument:" I suspect that daytime R is much greater than nighttime R, as a hotter body radiates more energy. So D = S - Rd and N = -Rn; with Rd > Rn, the difference is D - N = S - Rd + Rn. Another component of the impact of GHGs and anthropogenic aerosols in this process is the DTR difference between weekdays (typically higher urban CO2, corresponding with urban traffic patterns) and weekends. From Forster and Solomon 2003: The “weekend effect,” which we define as the average DTR for Saturday through Monday minus the average DTR for Wednesday through Friday, can be as large as 0.5 K ... We conclude that the weekend effect is a real short time scale and large spatial scale geophysical phenomenon, which is necessarily human in origin. We thus provide strong evidence of an anthropogenic link to DTR, an important climate indicator."
    0 0
  17. Disentangle the different contributions to the DTR change is not easy. As for CO2, the reason lies in the non linearity of the temperature-forcing relation. If you apply the forcing F starting at temperature To, the temperature change depends on To. Though, it's true that this is not the whole story, effects not directly related to CO2 play a role.
    0 0
  18. "Water vapour is a strong greenhouse gas and the dry desert air traps much less heat than more humid areas." And this statement in the article, in and by itself, shows why temperature is such a poor metric when measuring climate.
    0 0
  19. The ghosts of two centuries' worth of physical geographers will be astonished to learn that "temperature is [...] a poor metric when measuring climate".
    0 0
  20. The ghosts are laughing at us right now, astonished that we are using temperature, by itself, as a measurement of heat of the atmosphere.
    0 0
  21. I was working out in the garage when I heard the sharp shrieking of moving goalposts... First there was this:
    "And this statement in the article, in and by itself, shows why temperature is such a poor metric when measuring climate."
    When pointed out that by Ned (19) that two centuries' worth of physical geographers had been using temperatures to measure climate, there came the loud shrieking noise of this:
    "The ghosts are laughing at us right now, astonished that we are using temperature, by itself, as a measurement of heat of the atmosphere."
    (emphasis added). Those ghosts are still laughing, but now at all the backpedaling. The Yooper
    0 0
  22. #20: "The ghosts are ... astonished that we are using temperature, by itself, as a measurement of heat of the atmosphere." There's very little that can be said in reply, except perhaps: temperature is a measure of the thermal energy held by matter. An immediate way of sensing this is by touching the material and deciding whether it is hot, warm, or cold. A thermometer precisely measures the temperature and records a numerical value for the temperature. Astonishing that we rely on numerical values as well. Perhaps the ghosts will also be astonished by that.
    0 0
  23. Daniel@21, Not to mention that stating "we are using temperature, by itself, as a measurement of heat of the atmosphere" is wholly inaccurate. Several other, independent,metrics are used by scientists and they all point to a warming planet.
    0 0
  24. I didn't say we aren't warming. I did say...and will state strongly, that temperature by itself is a poor metric.
    0 0
  25. Albatross: What are those other metrics?
    0 0
  26. Re: Camburn (24) If I understand you correctly, then yes, temperature by itself is a poor metric indeed (in the sense that it's extremely difficult to establish contextually what is really going on in the climate due to the noise in the signal). Would there only exist other, more accurate, ways of tracking climate change... Fortunately for us, climate scientists today use many metrics, such as temperature anomalies derived from terrestrial, marine & orbital data collection platforms, various proxy records, and many other measurable signatures of a warming world. See here and here for starters. Many more posts exist on this at SkS. Try the search box at the upper left of every page. The Yooper
    0 0
  27. John can you just clarify why this is specifically a "human fingerprint"? As you point out water vapour is a very strong GHG. Increased water vapour (as shown in the graph below) is a product of a warmer world rather than specifically a human-induced warmer world. I'm guessing you consider most of the GHG effect is coming from water vapour? Just to emphasis the importance of water vapour I'm going to take a stab that the highest year in the warm nights graph (fig1) is 1998 and is a product of El Nino, the peak is there in the Tamino graph as well. I'm suggesting that the interpretation of this data goes way beyond what the actual data is telling us.
    0 0
  28. 3.muoncounter From memory there are many specific urban effects. Particulate and pollution domes and changes in evaporation and hydrology processes compared with the surrounding rural area being a couple of them. As with many aspects of the climate discussion things go way beyond just CO2.
    0 0
  29. Daniel Baily: Ref@26: A temp anomoly is based on temperature. Humanity Rules@ 27: Thank you. I was trying to lead to those studies by showing what a poor metric temperature is. It would appear that you study climate as I do. With an open mind, willing to absorb all sources of information and thought process.
    0 0
  30. Continuing #28, this page is OT but interesting.
    0 0
  31. Re: Camburn (29) Go here, then scroll down to number 6. Temperatures are useful to describe weather. Anomalies are used to describe climate. Did you wonder why I said climate scientists use anomalies instead of temperatures & why that is? The Yooper
    0 0
  32. Daniel: No matter how you cut it, a temp anomoly is based on temperature. Yes, it is a deviation, but the base is still the raw data.
    0 0
  33. Camburn - What would you consider a reasonable metric when measuring climate? You have disparaged temperature, and changes in long term temperature averages (anomalies); what are the alternatives you propose? Top of atmosphere radiation balance? Perhaps ocean thermal content or stratospheric cooling? Or ocean acidification? Flora matter, perhaps plant zone changes? Ice balance at the poles and on glaciers (numerous links, all measures are declining, use the search box)? If you have issues with temperature, essentially stating that rising temperatures do not indicate climate change, it's upon you to state what changes you would consider valid measures of climate change.
    0 0
  34. Camburn: I'm not really sure what your point is. Are you suggesting that temperature anomaly is not a measure of the relative energy content of a body of matter? Or are you just complaining that its sensitivity is relatively poor. The first proposition is absurd. The second proposition is valid, but it does not make it a useless metric, just that it should be triangulated for consistency with other data.
    0 0
  35. Re: Camburn I'm wasting my time with this one. He seems to be cut from the "we-can't-know-anything-so-we-shouldn't-do-anything" cloth. He's all yours, guys. The Yooper
    0 0
  36. kdkd: The 2nd proposition. Temperature is not a useless metric in given circumstances. It, by itself tho, is a useless metric when talking about climate. A temperature anomoly is based on temperature data. That is a given. When talking about climate one must think in terms of heat content. A temperature in a desert, @ say 100F, is not the same heat content as a temperature in the tropics of 100F. Can we agree on that? If anyone knows of a temp base that includes heat content as part of the anomoly I am all eyes.
    0 0
  37. #28: "Particulate and pollution domes and changes in evaporation and hydrology processes" Indeed. But if we're looking for a human fingerprint, evaporation won't cut it. How do 'hydrology processes' know when the weekends are and what the weekday peak traffic hours are? And how does water vapor know to take Easter week off in Mexico? I had a reference that showed different weekly patterns in the Arab countries (Friday is the weekly low in urban CO2 in Kuwait City, compared to Sunday in Rome), but it has escaped my sieve-like filing system for the moment. But riddle-me-this: where does the 500 ppm CO2 from urban traffic eventually wind up? Can it be seen 'downwind'? Are there any temperature anomalies that follow that distribution? I'd love to see evaporation and clouds changing with traffic density, but I'm betting that's not happening. That's why I don't get the point of the graph you posted in 27; nor do I give what I think Camburn is hinting at -- atmospheric moisture as a 'metric' for heat content -- much credit as a 'human fingerprint'. I'll give you that particulates and NOx are probably factors, but if the folks that think the urban CO2 domes don't extend upwards more than a few hundred meters are correct, then neither do those exhaust products. I live near a freeway with heavy rush hour traffic; I have a fine coating of black dust on my front porch on a regular basis. Never had it analyzed, but I bet its full of particulates from car and truck exhaust settling out.
    0 0
  38. #36: "A temperature in a desert, @ say 100F, is not the same heat content as a temperature in the tropics of 100F." Just for fun, which way would heat flow: from 100F desert air to 100F tropical air or vice versa?
    0 0
  39. Camburn #36 "by itself tho, [temperature anomaly is] a useless metric when talking about climate" A bit strong. Must be treated with caution would be a more temperate way of making your point. However (cherry picking so-called-sceptics excepted) generally we do not use temperature anomaly alone to examine climate, although it is a useful and reasonably valid measure that makes good intuitive sense. There. It would appear that as you want to throw the baby out with the bathwater, that your argument is not valid.
    0 0
  40. #36 cont "When talking about climate one must think in terms of heat content. A temperature in a desert, @ say 100F, is not the same heat content as a temperature in the tropics of 100F." This argument is also fallacious. Aside from your clear confusion over the difference between temperature anomaly and temperature (the quote above should have referred to anomaly rather than absolute value), you are making the assumption that the temperature anomaly measured in the desert is being compared to the temperature anomaly being measured in the tropics. In fact what happens in practice is that we measure a mean anomaly for a given spatial area, and compare that at different points in time. So long as the sample of measures are reasonably consistent with each other for a given spatial area at the different times, there is nothing wrong with this. Procedures have also been developed to deal with heat island effects, and changes in station location to improve the validity of this approach. Do you have any more fatally flawed arguments for us to deal with? I'm trying to write something quite difficult at the moment, and the ease with which your arguments are demolished is nice light relief.
    0 0
  41. kdkd: You are missing my point entirely. An anomoly, even within a spatial area, using temperature is not a valid climatic heat indicator. You would have to assume that the RH is constant, which in most areas it is not. Where I live, rh can be as low as 15% and as high as 99%. There is absolutely no pattern to the rh, and is not dependant on temperature. The heat content of the air at say 30% rh @80F is a lot less than 80%rh @80F. Do you agree with me on that?
    0 0
  42. 37.muoncounter This paper seems to link UHI with water vapour and identify an urban-specific diurnal cycle (based on the abstract). I wasn't really trying to counter what was written by you, or the references, rather just point out there are other factors involved in the mix. I now notice you mentioned some of them in your following posts. I'd still like to know if the research mentioned in John's article is really specifically a human fingerprint or just the fingerprint of a warmer world?
    0 0
  43. Camburn #41 As well as more humid air containing more heat than less humid air, I'd also expect that air at low pressure contains less heat per unit volume than air at high pressure too. Given that there's a fairly close relationship between humidity and temperature anomaly (the graphs show humidity over time, but it's worth comparing the trend to a temperature anomaly plot over roughly the same time period), then your point seems to be valid and interesting. However, the interest here is that it seems to provide a visualisation confirming that your argument is incorrect.
    0 0
  44. camburn 41. Surely if the records are kept night and day, spring to winter, el Ninos and La Ninas, rain and shine, high tide and low tide, these variations in humidity or insolation or precipitation or whatever are all taken into account. We've been measuring what we can. We've got more and more sophiticated and getting more and more measurements and at working out what those measurements tell us. But for global warming, what we do know is that there's a certain amount of energy delivered by the sun and we can measure that precisely. We also know how to measure what's being released at the TOA as outgoing radiation. What you're worrying about is where the energy that's not escaped through the troposphere is at particular moments. Most of it's in the oceans and we're doing our best to catch up with measuring that. What's in the atmosphere is measured pretty well in the large scale and over longer lengths of time. You're just asking for day by day accuracy and precision that just isn't yet available from the systems we've got. But we don't need that level of accuracy. My mum and her peers were able to produce perfect roasts, cakes, bread and scones with wood stoves that had no measuring devices at all. Most of us don't need the baby health nurse to tell us that our precious little one is gaining or losing weight. We can make perfectly reasonable judgments and decide on appropriate actions without pinpoint accuracy all day every day.
    0 0
  45. Camburn - Any reply to my questions here? You've responded to several others since then...
    0 0
  46. Camburn @25, Sorry for the late response, have been busy. After reading your response to others who have answered your question, I have reason to suspect the sincerity of your question, but for what it is worth I will also do so. Please read the following and references cited therein. Specifically, the ones found: here, here, here, and here. A consistent and coherent story.
    0 0
  47. KR@33: With the tech we now have available to us, I would like to see heat content rather than temperature as the metric. We should be able to measure rh and temp, and yes pressure, and extrapolate the heat content. The anomolies should reflect heat content as that is a true constant within verifiable metrics.
    0 0
  48. Albatross: I am not worried that warming is happening. That is a given is it not? I am not even worried that it may be partially co2 related. The climate sensativity to co2 will be in question for 10-20 years at least, and potentially longer. My point, once again is: Temperature, as in a mercury bulb reading, is a poor metric of climate heat of the atmosphere and even of the ocean as heat content is relative to water pressure as well.
    0 0
  49. Camburn - Rh? Do you mean "pH"? (I actually have a personal connection to the soap opera mentioned in that link...) The pressures are known, so are the temperatures. I still fail to see your issue with long term, highly sampled, multi-decade surface temperatures (air and ocean) as at least part of the data for tracking climate changes. Please point out what temperature records you feel are unreliable. You have yet to clearly state why you doubt temperature records are poor indicators.
    0 0
  50. KR: Temperatures as presented ARE part of the data. My point is....once again......they are NOT a good measure of HEAT content. WE have the tools at hand do we not? Let's use those tools. We all know that urban island heat effect is real. What we don't know, because of the lack of incorporation, how much actual heat is retained by the micro climate because we are NOT using all the tools available. And some cities are so large that "micro" climate really doesn't apply. There have been papers published about this exact thing I am talking about. There has been no attempt to incorporate the knowledge from these papers...one referenced above...to improve the data.
    0 0

1  2  Next

You need to be logged in to post a comment. Login via the left margin or if you're new, register here.


The Consensus Project Website

THE ESCALATOR

(free to republish)


© Copyright 2024 John Cook
Home | Translations | About Us | Privacy | Contact Us