Climate Science Glossary

Term Lookup

Enter a term in the search box to find its definition.

Settings

Use the controls in the far right panel to increase or decrease the number of terms automatically displayed (or to completely turn that feature off).

Term Lookup

Settings


All IPCC definitions taken from Climate Change 2007: The Physical Science Basis. Working Group I Contribution to the Fourth Assessment Report of the Intergovernmental Panel on Climate Change, Annex I, Glossary, pp. 941-954. Cambridge University Press.

Home Arguments Software Resources Comments The Consensus Project Translations About Support

Bluesky Facebook LinkedIn Mastodon MeWe

Twitter YouTube RSS Posts RSS Comments Email Subscribe


Climate's changed before
It's the sun
It's not bad
There is no consensus
It's cooling
Models are unreliable
Temp record is unreliable
Animals and plants can adapt
It hasn't warmed since 1998
Antarctica is gaining ice
View All Arguments...


Username
Password
New? Register here
Forgot your password?

Latest Posts

Archives

Ten temperature records in a single graphic

Posted on 26 January 2011 by John Cook

Last week in Monckton Myth #2, Robert Way published an intriguing graph 'All Method Temperature Index'. The graph plots the average of ten different global temperature datasets:

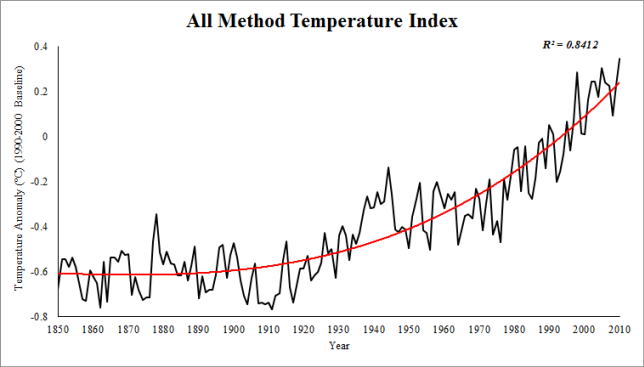
Figure 1: All Method Temperature Index (AMTI). 1990-2000 Baseline.

To create this graph, Robert had to track down a number of different temperature series. There were your classic "rock star" datasets - NASA GISS, NOAA and HadCRUT. The other favourites, although not going back as far as the thermometer records, are the satellite records UAH and RSS.

But another great addition are a number of other "reanalysis products". These are datasets that use a wide range of sources to reconstruct temperature. This includes thermometers, radiosondes, satellites, buoys and ship measurements. This way, they're able to create temperature records covering the entire globe, even Arctic regions that other datasets such as UAH, RSS and HadCRUT fail to cover. This is important because the Arctic is warming faster than the rest of the planet. To omit the Arctic is to underestimate the global warming trend.

Robert has also plotted a graph of all ten temperature records in a single graph, a vivid reminder that many independent lines of evidence all tell us the same thing. I've added it to our steadily growing Climate Graphics resource:
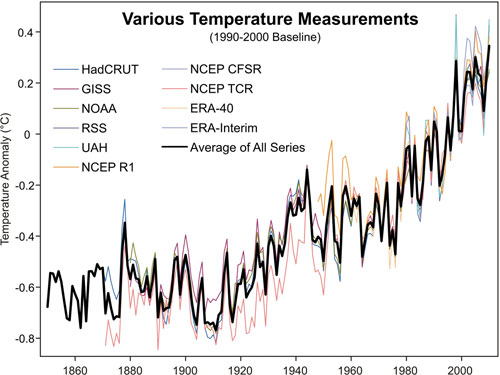
As with all our climate graphics, this is under a Climate Commons license so you're free to use this elsewhere. And the graph is available in a number of formats including an Excel Spreadsheet which contains all of Robert's methodology including the ten datasets and his graph from Monckton Myth #2. I'm very happy about this as I've been wanting to get hold of the European reanalysis data for while but have been too lazy busy to process the data myself :-)

0 0

Printable Version  |  Link to this page

Comments

1  2  3  Next

Comments 1 to 50 out of 137:

  1. Nice work Robert, that's a very cool and useful graph.
    0 0
  2. Powerful, succinct, compelling and convincing. Belongs on the "Are we heading into global cooling?" or the "It's freaking cold!" or the ___________ (ad infinitum) thread. Great job! The Yooper
    0 0
  3. Uah and RSS you mean? lol GISS is not a satellite record!
    0 0
    Moderator Response: [Daniel Bailey] Fixed text.
  4. Spreadsheet downloaded - that's an excellent resource Robert, and kudos to you for putting in the extra effort required to collate all the data, especially the reanalysis data. Many thanks!
    0 0
  5. And this proves what? Many graphs have been made but is this a tool refined to enhance government needs to impose a carbon tax on the world. Of course temperatures are rising. We are now climbing out of the mini ice age. Records since 1860 hardly proves anything in the vast scope of world history. Everything is tidal, the oceans, seasons, weather patterns, planetary cycles. The world breathes, its alive and there is nothing scientists or anybody else can do to prove otherwise because you cannot put the whole picture into a model. Nice graph though, will look good framed on the wall.
    0 0
    Moderator Response: [Daniel Bailey] Then frame this one then: For the rest of your comment, please break it up into those components you feel most important and post them on the appropriate thread. Search function, upper left corner (in case you missed it).
  6. #5 "Many graphs have been made but is this a tool refined to enhance government needs to impose a carbon tax on the world." Seeing that none of the contributors here receive any accoutrements from clandestine governmental organizations, then there is no need to deceive. So the answer is of course no.
    0 0
  7. An update to my "Quick and Dirty Analysis of GHCN Surface Temperature Data" guest-post. Due to my failure to RTF GHCN documentation carefully, I implemented an incorrect algorithm. It turns out that multiple stations can share a single WMO identification number. Having failed to read the documentation carefully, I charged ahead and coded up my routine assuming that each temperature station had a unique WMO number. So what happened was that in the cases where multiple stations share a WMO id number, my program used temperature data from just the last station associated with that WMO number with valid data for a given year/month. However, that goof actually *improved* the results over what you would get with a true "dumb average", as Kevin C discovered when he went to reimplement my routine in Python. What happened is that many temperature stations have random data gaps. In cases where multiple stations share a single WMO id, my routine quite accidentally "filled in" missing data from one station with valid data from other stations. That had the effect of crudely merging data from very-closely-spaced clusters of stations, reducing the overweighting problem associated with dumb-averaging, and reducing the impact of big data gaps in single-station data on baseline and anomaly computations. Kevin C demonstrated that a true "dumb average" gives significantly worse results that what I computed. So I went back and tried a little experiment. I changed my code so that the temperature data for all stations sharing a single WMO id were properly averaged together to produce a single temperature time-series for each WMO id. When I did that, my results improved significantly! The differences in the results for raw vs. "adjusted" GHCN were reduced noticeably, showing an even better match between raw and adjusted temperature data. So quite by accident, I stumbled on a method considerably simpler than proper gridding that still gives pretty decent results! This turned out to be a quite accidental demonstration of the robustness of the surface temperature record! I misinterpreted the GHCN data format and still got results darned close to NASA's "Northern Latitudes" index. I'd like to say, "I meant to do that", but instead I should say thanks to Kevin C for uncovering my dumb mistake.
    0 0
  8. Think you missed my point, in that the graph is freely available for download............into the wrong hands????
    0 0
  9. HuggyPopsBear at 11:50 AM on 26 January, 2011 And this proves what? Many graphs have been made but is this a tool refined to enhance government needs to impose a carbon tax on the world. (sniff.. sniff...) Do I smell a Poe???
    0 0
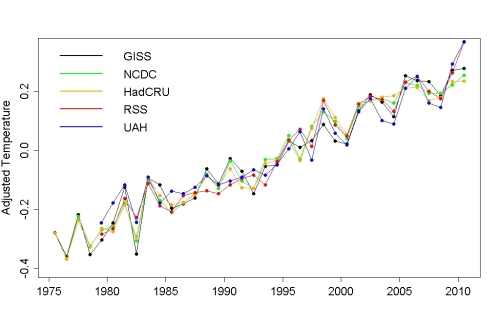
  10. "And this proves what?" Nicely done, Robert. I make your slope to be about 0.16 deg/decade and rising, right in line with Figure 8 from Assessing surface temperature reconstructions and Tamino's recent gem. As for what this proves: Until you can show a 'natural cycle' that runs in a straight line for 35 years, this says 'it's not natural.' So much for all that 'ramp and sine' gibberish.
    0 0
  11. #8 "the graph is freely available for download............into the wrong hands????" No such thing as wrong hands. That's a primary difference between many skeptics and scientists working to produce constructive answers, the data (all of it) are made available for public scrutiny, not just for the benefit of other scientists and politicians. I'm sure you appreciate being properly informed as well -- don't you?
    0 0
  12. Huggy, this proves nothing, because it is not intended to be proof of anything. It is a small piece of the large amount of evidence we have that the warming we are experiencing is unnatural.
    0 0
  13. @ caerbannog (7) Thank you for demonstrating the scientific method in action! The Yooper
    0 0
  14. The major proposition among deniers seems to have recently shifted from "it's not warming" (since 1998 or whenever) to "well of course it's warming" (we are at the end of, beginning of, part of a natural cycle because ...). I suppose, if you were an optimist, see this as a small step for a denier, large step for mankind, but since I'm not ... But I do wonder how you can look at a graph like this excellent one of John's and somehow convince yourself that it is perfectly obvious that the rapid temp rise you see over the last 100 years, especially the last 40 years, just happens, by an astonishing coincidence, to coincide with the the massive increase in industrial activity that began in the industrial revolution and the consequent massive measured increase in CO2 levels. I cannot begin to imagine how you could continue to hold a belief in a coincidence of that kind.
    0 0
  15. Thanks for making that, Robert. I've been looking for a single graphic like this to use in presentations for a while!
    0 0
  16. Well, Huggy, given that the primary source of past warming-The Sun-has been in a *cooling* cycle for the last 30 years, it suggests the current warming trend is moving in the *opposite*-accelerating-direction to that which the *Natural* forcings would suggest. Of course, Huggy, I'd also be interested to know what natural phenomenon could cause the lower atmosphere to *warm*, whilst simultaneously causing the upper atmosphere to cool. Oh, but why believe what I say? I might just be one of those evil "government types" trying to make you pay a carbon tax....give me a *break*!!!
    0 0
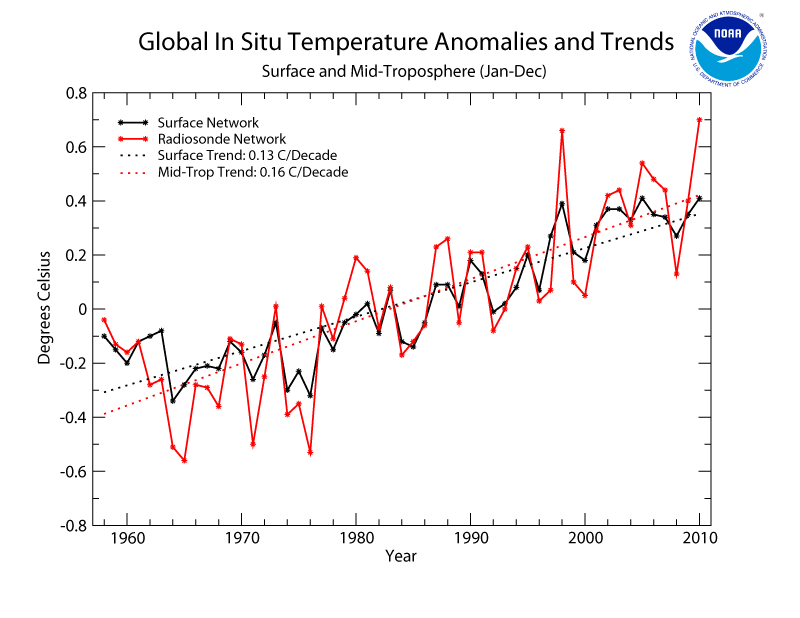
  17. Great Job Robert and John, thanks for this. Hope generating the ERA-interim global SAT data was not too much work. There is one more data set that one could add, and it may not be too much work....the RATPAC data. Gosh golly, look at this, RATPAC shows more warming than the surface data and shows 2010 to be the warmest on record....
    0 0
  18. From the graph in this post, one might surmise that the global temperatures started increasing around 1930. The CO2 data I have seen at the Mauna Loa site goes back to 1958. CO2 concentrations didn't really start accelerating until the 70's from that data. What is the explanation for the beginning of the temperature rist in the 30's?
    0 0
  19. Gary, This is addressed in argument #39, It warmed before 1940 when CO2 was low.
    0 0
  20. Thanks for the link Bibliovermis. so low volcanic activity in the 30's is one of the main reasons for the warming. i noticed the word used in the site you referenced was 'believed'. was there a graph of volcanic activity superimposed on the temperature graphs of the 20th century to validate that? i didn't see it in the post.
    0 0
    Moderator Response: Since this comment is about that other post, the appropriate place to put this comment is on that other thread.
  21. There's also a new reanalysis: 20th Century Reanalysis.
    0 0
  22. I think it's best to look at a graph of temperatures Tamino, or (shorter period of time) here And temperature in the Arctic has its own rights. In one place is growing - in the second falls., because: “North Atlantic Ocean temperatures respond to changes in the Arctic Oscillation, locally represnted by the North Atlantic Oscillation. When temperatures are warmer in northern Europe, they are often colder on the northwest Atlantic side.”
    0 0
  23. Marcus I am in no position nor are any of us to get into a verbal battle, my question was genuine enough though open I suppose for a little satire. I look at a kettle and I ask, does the water heat at a consistent rate from start to finish, or is it just the last say 10% that heats quicker? My mind asks if it is the last few percentages that heat quicker, why can this not be the same for the atmosphere as we climb out of a mini Ice age? Is it unnatural for such a climb? Yes if we only rely on figures of the last 150 years or so. However we know that the world once was warmer and had higher CO2 ppm. We know the pole caps were once fertile places, so why the need before data is proved should one get excited at the prospect of human induced global warming. It could be a natural phenomena.
    0 0
    Moderator Response: See the Argument "We’re coming out of the Little Ice Age," and comment further over there.
  24. Thanks Daniel I will ..........
    0 0
    Moderator Response: [Daniel Bailey] Per Hansen 2011, we are already at temps equal to the Holocene Maximum now. And still rising...
  25. HuggyPopsBear wrote : "My mind asks if it is the last few percentages that heat quicker, why can this not be the same for the atmosphere as we climb out of a mini Ice age?" But does your mind also ask how we are climbing out of that "mini Ice age" ? What are the natural processes involved which are causing that ?
    0 0
    Moderator Response: ...which is covered in the Argument "We’re coming out of the Little Ice Age."
  26. "does the water heat at a consistent rate from start to finish" - yes, if you apply consistent heat from start to finish! I'm guessing that Mr Bear thinks that the water starting to bubble is a sign of more rapid heating perhaps.
    0 0
  27. @caerbanog #7, are the extra readings the ones differentiated by the "duplicate" field or just the "modifier"? I have to admit that I couldn't understand the description of the duplicate field so my own version of this just ignores it and uses the last data value for each station, but it does take the modifier as part of the station identification.
    0 0
  28. "As with all our climate graphics, this is under a Climate Commons license ... " Creative commons?
    0 0
  29. HuggyPops Bear, Did you read the graph in the moderator response to you at #5. That gives a 2000 year record. If you search this site you can find the Vostock ice core record which goes back 450,000 years. When you say "Yes if we only rely on figures of the last 150 years or so" immediately after you are given 2000 years of data it appears that you are unwilling to read data you are given. Why didn't you read the data the moderator provided for you? If you only ocnsider the last 150 years of data it might make sense to imagine a natural cycle caused the warming. If you actually look at the much longer data record available it is clear that the warming is not natural.
    0 0
  30. #23 "I look at a kettle and I ask, does the water heat at a consistent rate from start to finish, or is it just the last say 10% that heats quicker?" As David pointed out the answer is yes. It heats at a consistent rate given that the heating source maintains a consistent output. Think about it Jim does an ice cube melt faster in a room that is 34oF or 90oF? It therefore follows that the more energy thrown at the ice cube the shorter duration it takes to melt, even if that increase in energy is raised slowly. Similar in principle to stepping on the accelerator in your car, except in this case humanity is stepping on the accelerator of the planet..
    0 0
  31. HuggyPopsBear - If the heating is due to an imbalance between energy coming from the sun and energy radiating from the Earth (as is the case with greenhouse gases), the last few percent of heating take a very long time, as the rate of temperature change is proportionate to the difference between energy coming in and going out. I cannot think of a physical relationship where the last few percent of heating accelerates, unless you're looking at the apparent changes in a phase transition between solid/liquid/gas - that's not the case here. There's some ice melting, but the Earth is not a uniform block of material where at some energy level it suddenly changes state. Of course, since we're continuing to put CO2 into the atmosphere, there's not a step change in forcing - at this point we appear to be turning up the heat faster than the planet is warming, and temperature change is, if anything, accelerating. So heating has not slowed down, and we won't see a decrease in energy accumulation unless the forcings are reduced.
    0 0
  32. John and Robert, The RATPAC-A data are available here. They recommend RATPAC-A for "studies of long-term large-scale climate change since it contains the most robust large-scale averages."
    0 0
  33. This composite index is interesting in that it clearly shows that there isn't enough difference between the data sets to make hay of, although I've seen that attempted. However, it muddles up the meaning. For instance, in the GISS way of thinking, in the sparsity of data, it is logical to infer that that a relatively small region entirely surrounded by a region with a measured warming anomaly also has a warming anomaly of at least as much. In the HadCRUT3 line of reasoning, it's best simply to pretend that the regions with no measurements don't exist. Both are valid ways of dealing with the sparsity of data in polar regions, but what does combining them together mean, that regions with sparse data partially exist?
    0 0
  34. garythompson @ 20 You requested a graph on volcanism over the 20th century. See here for your request. Notice the significant "Lull" Albatross, I'm curious as to the coverage of the RATPAC-A data geographically. I'm also wondering as to whether anyone can find the JMA data. Thanks though. I'll have a look into it a bit. Chris G, Combining them is useful because the Reanalysis datasets have superior coverage of the Polar regions because they use so many different datasets. Furthermore their results validate those of GISS. The boys at clear climate code incorporated environment Canada data too and their results also validated GISS. I think assuming that the North is warming at the same rate as the global data is a flaw in hadley's analysis to be honest. In fact their whole station combination method is very good at excluding data whereas RSM (used by GISS) is very inclusive.
    0 0
    Moderator Response: [Daniel Bailey] Converted link to picture.
  35. HuggyPops @ 5 Here is another graph for you to look at. I think you will like it with its longer timeframe. From Woods Hole Research Center. I think it bolsters your point, but most of the rest on here will disagree.
    0 0
  36. I'm missing the JMA data. It's here: http://ds.data.jma.go.jp/tcc/tcc/products/gwp/temp/ann_wld.html
    0 0
  37. #35: Pirate, we meet again! "it bolsters your point, but most of the rest on here will disagree." If you look at the far right hand side of the CO2 graph, it bolsters the point that recent atmospheric conditions are not natural. Add in the recent temperature record, such as the graphs provided by Yooper at #5, which are also not natural. A reasonable person would suspect some form of relationship between those two observations; one not found in natural cycles. Good thing there's a theory, backed by strong physics and further bolstered by numerous other observations, to explain that relationship. Or you can go on making up 'natural cycles' to explain this behavior.
    0 0
  38. Muon @ 37, I didn't "make up" the historical "natural cycles". And, yes, it does appear that something unnatural is going on with atmospheric CO2 levels. The temperature may end up becoming abnormal, but so far it is within historical norms. Projections and models are not facts until they happen.
    0 0
  39. Pirate, can you explain why the temperature at the far right side has not dropped the way it has in all past bumps in the natural cycle? I'd like to understand why it differs now. You see how it just keeps bumping along at a high level, whereas in the past it peaked and then fell sharply. Please tell me how that fits a natural cycle. Serious question.
    0 0
  40. Pirate: Examining the temperature graph at #5, the temperature is 0.5C above the extreme limits of the past 2000 years!! That coincides exactly with the increase in CO2. Do we have to have the highest temperatures in thepast million years before you will admit that the temperatures are above normal? What temperature increase would you say is "abnormal"?
    0 0
  41. #38: michael notes correctly in #40 that temperatures are well beyond 'historical norms'. What is the specific natural cycle that has taken both CO2 and temperature to such extremes? Please be specific in identifying the mechanism behind this cycle and provide some documentation, if available.
    0 0
  42. apiratelooksat50 wrote : "And, yes, it does appear that something unnatural is going on with atmospheric CO2 levels. The temperature may end up becoming abnormal, but so far it is within historical norms. Projections and models are not facts until they happen." More questions to be ignored by the pirate : What "unnatural" something do you think is going on with atmospheric CO2 levels ? Can you give a definition of what you understand to be "historical norms" ? How would you define when "projections" (calculations about future events) and "models" (simulations of events) become "facts" or when they could be said to "happen" ? Do you have any criteria ?
    0 0
  43. Another data set that some here might find useful. International Comprehensive Ocean-Atmosphere Data Set
    0 0
  44. Gordon - You might be suprised to hear this from me, but I think the best current explanation for the sustained higher temperature could possibly be the increased CO2 levels.
    0 0
  45. Michael @ 40 Before I answer your question, we need to define what is abnormal. We might be hanging around a max temp longer this time and that may be abnormal, but we still have not matched the peaks of the previous 3 interglacial periods. So, until "abnormal" is quantified, the question cannot be answered. Since the previous 3 peaks occurred before humankinds first ancestors knew how to knock 2 rocks together, wouldn't we have to call that normal?
    0 0
    Moderator Response: See "It's Not Bad."
  46. You can't blame this one on me. I am covering an AP (Advanced Placement) Physics class for another teacher. He is multi-degreed in Chemistry and Physics and happens to support the AGW hypothesis. Of the 30 students in this room, 28 of them are already accepted to college and half of them are going on scholarships. Not one single student supports the AGW theory. They think human activities have effect on the climate and contribute to temperature changes, but they do not think CO2 is the driver. This will probably be deleted - I know.
    0 0
  47. 46, apiratelooksat50, So they have been mistaught and mislead. Why does this not surprise me? Hint: High school students do not have the time or background to research things thoroughly themselves, so they believe what they are told. Who told them? Fox News, and their teachers.
    0 0
    Moderator Response: [muoncounter] Let's not forget their parents. Ideally, their science teachers could do some good in opening their eyes to the science; after all, we're supposed to present 'both sides' of the debate. But this is off-topic.
  48. 45, apiratelooksat50, So you think we shouldn't worry because "normal" temperatures for the planet are those which existed in a time without the human race (and probably represent temperatures with which much of the current human race might find difficulty existing)? Could I posit that, for the purposes of human civilization, we would best consider"normal" temperatures to be those in a range within which human civilization has thrived and grown in the past 2,000 years, and anything too far above that represents an extreme danger?
    0 0
    Moderator Response: ... as discussed in "It’s not bad."
  49. You can't directly compare temperatures of past inter-glacials such as the Eamian to the Holocene Pirate. The planets celestial alignment to the sun was probably different than today. Eamian You would need to work out all the forcings applicable to the Eamian before trying to make any direct comparison to the Holocene. And I'm afraid that your ancestors knew quite well how to knock two rocks together, even during the Eamian, and quite likely before it.
    0 0
  50. I would certainly agree that combining data sets in order fill in gaps in one or the other is useful and worthwhile, but I maintain that averaging models that treat the same set of missing data differently muddles the meaning you can take from them. From a mathematical standpoint, it's clear what each means on their own, averaged, the meaning is less clear. With respect to GISS versus HadCRUT, I tend to agree with you, but that is a judgment call above my level of expertise. If they have a professional difference of opinion, and that difference is immaterial to me, I'm content to let it be.
    0 0

1  2  3  Next

You need to be logged in to post a comment. Login via the left margin or if you're new, register here.


The Consensus Project Website

THE ESCALATOR

(free to republish)


© Copyright 2024 John Cook
Home | Translations | About Us | Privacy | Contact Us