Climate Science Glossary

Term Lookup

Enter a term in the search box to find its definition.

Settings

Use the controls in the far right panel to increase or decrease the number of terms automatically displayed (or to completely turn that feature off).

Term Lookup

Settings


All IPCC definitions taken from Climate Change 2007: The Physical Science Basis. Working Group I Contribution to the Fourth Assessment Report of the Intergovernmental Panel on Climate Change, Annex I, Glossary, pp. 941-954. Cambridge University Press.

Home Arguments Software Resources Comments The Consensus Project Translations About Support

Bluesky Facebook LinkedIn Mastodon MeWe

Twitter YouTube RSS Posts RSS Comments Email Subscribe


Climate's changed before
It's the sun
It's not bad
There is no consensus
It's cooling
Models are unreliable
Temp record is unreliable
Animals and plants can adapt
It hasn't warmed since 1998
Antarctica is gaining ice
View All Arguments...


Username
Password
New? Register here
Forgot your password?

Latest Posts

Archives

A Case Study of a Climate Scientist Skeptic

Posted on 4 February 2011 by dana1981

Previously, in A Case Study in Climate Science Integrity (which was picked up and re-published by The Guardian Environment Network), we qualitatively examined two errors which led the Universal Ecological Fund (Fundaciíon Ecológical Universal [FEU-US]) and Dr. Richard Lindzen to arrive at diametrically opposed, but equally wrong conclusions.  Here is Lindzen's (emphasis added):

"According to the UN’s Intergovernmental Panel on Climate Change, the greenhouse forcing from man made greenhouse gases is already about 86% of what one expects from a doubling of CO2 (with about half coming from methane, nitrous oxide, freons and ozone), and alarming predictions depend on models for which the sensitivity to a doubling for CO2 is greater than 2C which implies that we should already have seen much more warming than we have seen thus far"

In both publications, thermal inertia and negative forcings were neglected.  Both performed calculations which accounted for the positive anthropogenic forcings (carbon dioxide, methane, and other greenhouse gases), but neglected these two factors.  The difference is that while the FEU-US completely ignored them, Lindzen did mention each factor in a halfhearted effort to justify neglecting them.  But before we get into the details, it's worthwhile to examine the history of Lindzen's "we should have seen much more warming" argument.

A Brief History in Lindzen Time

Dr. Lindzen seems to have first made this argument in a 2002 letter to his local mayor in Newton, Massachusetts. 

"the impact on the heat budget of the Earth due to the increases in CO2 and other man influenced greenhouse substances has already reached about 75% of what one expects from a doubling of CO2, and the temperature rise seen so far is much less (by a factor of 2-3) than models predict"

In 2005, Lindzen made the same argument in testimony to the UK Parliament House of Lords Economic Affairs Committee.  He later repeated the argument on National Public Radio (NPR) in 2006, again on NPR in 2007 in a public debate which included Gavin Schmidt and Michael Crichton, in an Energy & Environment-published paper in 2007, in an article in 2008, another article in 2009, and of course the 2011 article examined in the Case Study and re-published uncritically at WattsUpWithThat and many other "skeptic" media sources.  Suffice it to say, Lindzen makes this argument frequently.

Lindzen's argument has also been rebutted several times, including by Coby Beck in 2006 and Stefan Rahmstorf in 2008.  Let's examine the errors that these rebuttals have uncovered in Lindzen's arguments.  Schwartz et al. (2010) agree that just based on greenhouse gas changes, ignoring all other factors, we "should have seen" 2.1°C warming above pre-industrial levels by now.  However, Schwartz et al. went on to quantify the other effects which Lindzen neglected, and so will we.

Thermal Inertia

Due to the fact that much of the Earth is covered in oceans, and it takes a long time to heat water, there is a lag before we see the full warming effects of an increase in atmospheric greenhouse gases (this is also known as "thermal inertia").  In fact, we know there remains unrealized warming from the greenhouse gases we've already emitted because there is a global energy imbalance.  The amount of unrealized warming is dependent upon the amount of CO2 in the atmosphere (or other radiative forcing causing the energy imbalance) and the thermal inertia of the oceans (which causes a lag before the warming is realized).  Lindzen does briefly acknowledge thermal inertia in his UK Parliament testimony:

"the observed warming is too small compared to what models suggest. Even the fact that the oceans' heat capacity leads to a delay in the response of the surface does not alter this conclusion."

Unfortunately, Lindzen does not substantiate this claim, or provide any references to support it.  However, Stefan Rahmstorf does attempt to quantify the thermal inertia effect in his rebuttal:

"Data from about 1 million ocean temperature profiles show that the ocean has been taking up heat at a rate of 0.6 W/m2 (averaged over the full surface of the Earth) for the period 1993–2003 [21]. This rate must be subtracted from the greenhouse gas forcing of 2.6 W/m2, as actual warming must reflect the net change in heat balance, including the heat flow into the ocean."

Rahmstorf references Willis et al. (2004), which found an oceanic warming rate of 0.86 ± 0.12 watts per square meter (W/m2) of ocean.  Given that approximately 70% of the Earth's surface is ocean, this becomes approximately 0.6 ± 0.07 W/m2 of overall ocean heat uptake.  Schwartz et al. (2010) put the value at 0.37 ± 0.12 W/m2.  For our purposes, we'll put the figure at 0.25 to 0.67 with a most likely value of 0.4 W/m2.  Let's keep these numbers in our back pocket and move on to the second neglected factor.

Aerosols and Other Cooling Effects

Lindzen briefly addresses aerosols in his most recent article:

"Modelers defend this situation...by arguing that aerosols have cancelled [sic] much of the warming (viz Schwartz et al, 2010)...However, a recent paper (Ramanathan, 2007) points out that aerosols can warm as well as cool"

In short, Lindzen's argument is that the radiative forcing from aerosols is highly uncertain with large error bars, and that they have both cooling (mainly by scattering sunlight and seeding clouds) and warming (mainly by black carbon darkening the Earth's surface and reducing its reflectivity) effects.  These points are both accurate. 

However, neglecting aerosols in calculating how much the planet should have warmed does not account for their uncertainty.  On the contrary, this is treating aerosols as if they have zero forcing with zero uncertainty.  It's true that aerosols have both cooling and warming effects, but which is larger?

In his argument, Lindzen refers us to Ramanathan et al. (2007).  This study examined the warming effects of the Asian Brown Cloud and concluded that "atmospheric brown clouds enhanced lower atmospheric solar heating by about 50 per cent."  The study also noted that, consistent with Lindzen's claims about the aerosol forcing uncertainty, there is "at least a fourfold uncertainty in the aerosol forcing effect."  However, this study focused on the warming effects of black carbon, and did not compare them to the cooling effects of atmospheric aerosols.

Ramanathan and Carmichael (2008), on the other hand, examined both the warming and cooling effects of aerosols.   This study found that black carbon has a warming effect of approximately 0.9 W/m2, while aerosol cooling effects account for approximately -2.3 W/m2.  Thus Ramanathan and Carmichael find that the net radiative forcing from aerosols + black carbon is approximately -1.4 W/m2.  This is broadly consistent with the IPCC net aerosol  + black carbon forcing most likely value of -1.1 W/m2

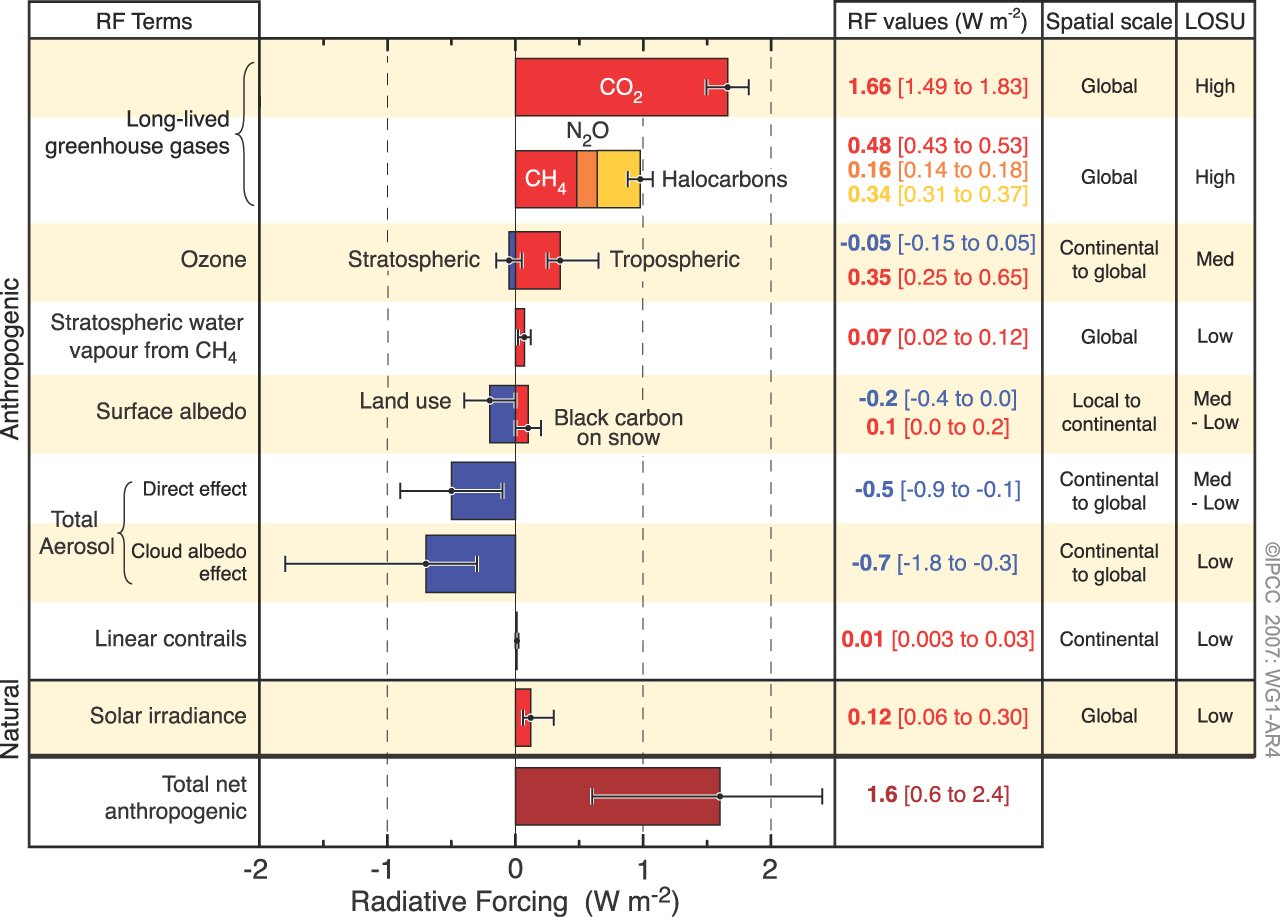
Figure 1:  Global average radiative forcing in 2005 (best estimates and 5 to 95% uncertainty ranges) with respect to 1750.  Source (IPCC AR4).

Note that Lindzen's assumed zero net aerosol + black carbon forcing is outside of this confidence range; therefore, neglecting its effect cannot be justified.  However, since the IPCC provides us with the 95% confidence range of the total net anthropogenic forcing in Figure 1, we can account for the uncertainties which concern Lindzen, and evaluate how much warming we "should have seen" by now.

Expected Forcing Effects on Temperature Thus Far

In fact, this is a simple calculation.  The IPCC 95% confidence range puts the total net anthropogenic forcing at 0.6 to 2.4 W/m2 (Figure 1).  On top of that, as discussed above, ocean heat uptake accounts for between 0.25 and 0.67 W/m2.  Therefore, subtracting the ocean heat uptake, the total net anthropogenic forcing over this period is somewhere between -0.07 and 2.15 W/m2, with a most likely value of 1.1 W/m2.

A doubling of atmospheric CO2 corresponds to a radiative forcing of 3.7 W/m2, according to the IPCC.  Therefore, the net anthropogenic radiative forcing thus far is between approximately 0% and 58% of the forcing associated with a doubling of atmospheric CO2, with a most likely value of 30%. 

In order to be thorough, we can also include the natural radiative forcings.  Most have had approximately zero net effect since 1750, with the exception of the Sun, which has had a forcing of 0.06 to 0.30 W/m2 with a most likely value of 0.12 W/m2 over this period (Figure 1).  Therefore, net forcing since 1750 is approximately 0 to 2.45 W/m2, with a most likely value of 1.25 W/m2.  Thus the total net forcing thus far is between 0% and 66% of the forcing associated with a doubling of atmospheric CO2, with a most likely value of 34%.

What Does This Tell Us About Climate Sensitivity?

So far, global surface air temperatures have increased approximately 0.8°C  in response to these radiative forcings.  Since we're 0% to 66% of the way to the radiative forcing associated with a doubling of atmospheric CO2 (most likely value of 34%), the amount we should expect the planet to warm if CO2 doubles (also known as "climate sensitivity") has a most likely value of 2.4°C, with a minimum of 1.2°C (because of the large aerosol cooling effect uncertainty and the fact that we may only be 0% of the way to the doubled CO2 forcing, we can't place an upper limit on the climate sensivity parameter with this calculation).   Using a much wider range of evidence, the IPCC puts the likely climate sensitivity range to a doubling of CO2 at 2 to 4.5°C with a most likely value of 3°C.  Our calculation is consistent with the IPCC range.

How Much Warming Should We Have Seen?

We can also flip the calculation backwards, assuming the IPCC most likely climate sensitivity of 3°C for a doubling of atmospheric CO2 and using the numbers above.  In this case, we should have seen from 0% to 66% of 3°C, or about 0 to 2.0°C.   Clearly the amount of warming we have seen so far is well within this range.  Additionally, the most likely amount of warming is 34% of 3°C, which is 1.0°C.  In other words, we have seen very close to the amount of warming that we "should have" seen, according to the IPCC.

Warming is Consistent with What We Expect

In short, contrary to Lindzen's claims, the amount of surface warming thus far (0.8°C) is consistent with what we "should have seen" based on the IPCC numbers.  Moreover, this calculation puts the most likely climate sensitivity parameter value within the IPCC's stated range, whereas the much lower value claimed in Lindzen and Choi (2009) (less than 1°C for CO2 doubling) is inconsistent even with our calculated climate sensitivity lower bound (1.2°C).  For additional discussion of the errors with Lindzen and Choi (2009), see here

When we actually account for thermal inertia and negative forcings, we find that the amount of warming we have seen is consistent with what the IPCC would expect, but inconsistent with Lindzen and Choi 2009.  Thus the correct conclusion is that if Lindzen is correct about low climate sensitivity, we should already have seen much less warming than we have seen thus far.

This post has been adapted into the rebuttal to the argument "Earth hasn't warmed as much as expected".

0 0

Printable Version  |  Link to this page

Comments

1  2  Next

Comments 1 to 50 out of 80:

  1. One of the best posts on the blog. Great to see so much put together in one piece. Do the sensitivity calculations take into account possible realeses of natural sources of carbon gasses as feedbacks or is it purely on atmospheric physics?
    0 0
  2. dorlomin: most estimates of climate sensitivity do not include carbon cycle feedbacks. Models don't include them properly, nor do observational estimates based on observations we have now. However, some palaeoclimate estimates implicitly include them (because they kind of look at total temperature change divided by total forcing over a long enough period for carbon feedbacks to kick in). There has been some new research into this but I'm not up to date. I'm pretty sure most old estimates and the CMIP3 models (IPCC AR4 ones) don't. And calculations based on the time constant, or heat balance data, or changes over the past century or so don't properly include them either since they're slower than that and we can't predict any quick changes yet.
    0 0
  3. Almost each of the data given above is questioned by skeptics. For example, I recall a sentence from the study: Solar Influences on Climate, Gray et al., 2010.: „A value of 0.24 Wm-2 solar radiative forcing difference from Maunder Minimum to the present is currently considered to be more appropriate than the 0.12 Wm-2 estimated by IPCC (c.f. the range of 0.16-0.28 Wm-2 ...)” According to this study - paper, many aspects of indirect effects of solar activity on climate is poorly assessed by the IPCC models (so far): “Periodicities, trends, and grand minima are features of solar activity which, if detectable in climate records, can be used to attribute climate changes to solar forcing (Beer et al. 2000; Beer and van Geel, 2008). However, one must be aware that this may not always work well because there are other forcings as well and the climate is a non-linear system which can react in a variety of ways.” “... the majority of climate models employed to date ... ... represent primarily the ‘bottom-up’ TSI mechanism and have a very poor, or no, representation of the ‘top-down’ mechanism that requires spectral variations in solar radiative input and ozone feedback effects. Only a few have an adequate representation of the stratosphere and even those do not generate a complete representation of stratospheric effects such as an internally consistent quasi biennial oscillation."
    0 0
  4. Original Post #dana1981 There are several things wrong with your piece. Firstly your point: "Due to the fact that much of the Earth is covered in oceans, and it takes a long time to heat water, there is a lag before we see the full warming effects of an increase in atmospheric greenhouse gases (this is also known as "thermal inertia"). In fact, we know there remains "warming in the pipeline" from the greenhouse gases we've already emitted because there is a global energy imbalance" It takes a long time for heat energy to warm a large mass of water to a uniform temperature, however the first law mandates conservation of that heat energy. If that energy is absorbed in the oceans then it will be represented by higher temperatures in some portion and lower temperatures in other portions with complex circulations generally driving heat from the warmer to cooler portions over time. The heat energy is already here - not 'in the pipeline'. There is no other major storage device other than the oceans so what is here today must show up as temperature increase (or ice melt or evaporation) somewhere RIGHT NOW. Secondly, your point: "Data from about 1 million ocean temperature profiles show that the ocean has been taking up heat at a rate of 0.6 W/m2 (averaged over the full surface of the Earth) for the period 1993–2003 [21]. This rate must be subtracted from the greenhouse gas forcing of 2.6 W/m2, as actual warming must reflect the net change in heat balance, including the heat flow into the ocean." Rahmstorf references Willis et al. (2004), which found an oceanic warming rate of 0.86 ± 0.12 watts per square meter of ocean. Given that approximately 70% of the Earth's surface is ocean, this becomes approximately 0.6 ± 0.07 watts per square meter (W/m2) of overall ocean heat uptake. Schwartz et al. (2010) put the value at 0.37 ± 0.12 W/m2. For our purposes, we'll put the figure at 0.25 to 0.67 with a most likely value of 0.4 W/m2." endquote The ocean heat uptake of 0.6W/sq.m (1993-2003) is in serious doubt due to the step offset efect of the XBT-Argo transition extensively debated elsewhere on this blog. Even accepting this figure, your claim that: "This rate must be subtracted from the greenhouse gas forcing of 2.6 W/m2, as actual warming must reflect the net change in heat balance, including the heat flow into the ocean" This is simply wrong. The oceans account for more than 90% of the heat storage capacity of the Earth system - so if they are absorbing 0.6W/sq.m then the whole system cannot absorb more than about 0.66W/sq.m. You do not subtract 0.6 from 2.6 and say that is the warming 'imbalance'. Where is that 2.0 'imbalance' showing up?? It cannot be stored anywhere because we have already accounted for the 0.6 absorbed in the oceans. Similarly your point: "On top of that, as discussed above, ocean heat uptake accounts for between 0.25 and 0.67 W/m2. Therefore, subtracting the ocean heat uptake, the total net anthropogenic forcing over this period is somewhere between -0.07 and 2.15 W/m2, with a most likely value of 1.1 W/m2." - is meaningless without a net figure including cooling and climate responses. The total net forcing (warming imbalance) MUST be represented by the heat energy stored in the earth system at ANY point in time. This is accounted by Dr Trenberth at +1.6 (net anthropogenic) -2.8 (S-B radiative cooling) + 2.1 (WV + ice albedo feedback) = +0.9W/sq.m imbalance. The oceans can account for only 0.4 - 0.6 W/sq.m with high uncertainty - so the balance of the 0.9 - (0.4 to 0.6) is Dr Trenberth's missing heat of 'travesty' fame.
    0 0
  5. Linzen repeatedly claims that his climate sensitivy is based on observations, whereas all other higher sensitivities are based on models. How can a climate scientist say something like that and get away with such a grossly "uninformed" claim?
    0 0
  6. Dana - Excellent post, very clear and it covers the issues/obfuscations quite well. I have, however, always hated the "in the pipeline" terminology. What this refers to is energy that hasn't accumulated yet, but is expected to given the current imbalance. Conditions are such that we expect further heating to occur before the imbalance is removed. However, I keep seeing skeptics yelling about the "in the pipeline" heating, as if the energy discussed were somehow already here, hiding under a bush or something, and our supposed inability to point to it represents to them a failure of science. I would propose describing it as "expected warming", rather than "in the pipeline".
    0 0
  7. Arkadiusz #3 says "Almost each of the data given above is questioned by skeptics." Oh yeah, no news there. Everything is questioned by "skeptics". They claim it's not warming, but the observed warming is caused by the sun but it's caused by PDO or NAO. And they also claim it's caused by CO2, only the climate sensitivity is lower than usually accepted (like Lindzen). Of course, some "skeptics" also claim that averything the IPCC said is fine and correct, it's just that giving up fossil fuels would be disastrous (like Lomborg). They question everything. Even the concept of temperature itself is brought into question if that would help their "argument". The funny (or sad) thing is how many people go along with such a contraditory mess. Right Arkadiusz?
    0 0
  8. Arkadiusz - "Almost each of the data given above is questioned by skeptics." Quite true, Arkadiusz. In fact, there are uncertainties in all the relevant quantities. But as a climate scientist, Lindzen is not justified in using that uncertainty they way he does, claiming for example that aerosols have zero effect - when that falls outside the 95% confidence interval for them. Acknowledging uncertainty in various factors means accounting for it, not using uncertainty to somehow justify ignoring those factors completely.
    0 0
  9. #3: "I recall a sentence from the study ... many aspects of indirect effects of solar activity on climate is poorly assessed" I also recall a sentence in the Gray et al study you cite: Despite these uncertainties in solar radiative forcing, they are nevertheless much smaller than the estimated radiative forcing due to anthropogenic changes and the predicted SC-related surface temperature change is small relative to anthropogenic changes. This is the sentence immediately after the first one you quoted. Shouldn't the 'skeptical' statement 'there are many uncertainties' also include the qualifier 'but those uncertainties are small'?
    0 0
  10. Re #6 KR's concerns about the phrase "in the pipeline". I note that the header title of the section of the article where this term appears is "Thermal Inertia." My question for Dana: Are the terms, "in the pipeline" and "thermal inertia" synomonous? If they are, perhaps the term "in the pipleine" could be followed by (i.e., thermal inertia).
    0 0
  11. All of that 0,8C is not made by CO2 thats just an assumption taken from the climate models ,which actually do not replicate the 1940 hump. A great of warming (specially post 1970) is from the Atlantic Multidecadal Oscillation (AMO) and the Pacific Decadal Oscillation (PDO). AMO has also been recently discussed in the scientific literature by Delsole et al contributing circa 0.08K/decade to the trend. The recent flattening of the rise is consistent with this explanation. Then you have to prove that there is no decaedal natural variability (almost evident and the oscillations can be seen in paleo records too), or that this variability is due GHG's (nonsense, since CO2 was almost constant pre industrial). Natural climate variability has always existed and it didnt suddenly just disappear. Whether it is internal or caused by clouds (North Atlantic temperatures correlate very well against Solanki et al at least for the last couple of hundred years), both occasions will seal the CAGW case.
    0 0
  12. Ken Lambert #4, So, what you're suggesting in your first paragraph is that the energy absorbed at the surface is instantly transported clear to the bottom. Sorry, but that is absurd. There is a constant turnover of oceanic water via the thermo-haline cycle, but it takes hundreds of years for a complete cycle. It'll be some time before the entire ocean reaches a thermal equilibrium with the energy level the surface is now receiving.
    0 0
  13. Ken, On further thought, my first response is a little inadequate, but that only means you have me confused. You state that there is no warming in the pipeline, and then acknowledge that it will take a long time for the oceans to reach a thermodynamic equilibrium. Those statements don't seem to be compatible with each other.
    0 0
  14. dorlomin #1 - thanks, that's very high praise. As Mark said in #2, climate sensitivity evaluations based on paleoclimate data would include carbon cycle feedbacks. Arkadiusz #3 - you may have noticed that I used a range of 0.06 to 0.30 W/m2 for the solar forcing. Your preferred value of 0.24 W/m2 is within that range, so it does not change the conclusion. There have been other studies concluding that the solar forcing is less than the IPCC value as well. This is the whole point of doing the calculation while keeping the uncertainties. Ken Lambert #4 - sorry, you are incorrect. See KR #6. Also I suggest you read the Lindzen E&E paper I linked in the article. He explicitly states that there is warming in the pipeline from the ocean thermal inertia. He just neglects it because he feels it's too small to make much difference in the calculation, but unlike yourself, doesn't deny that it exists. Alexandre #5 - Monckton has made the same claim about Lindzen being the only scientist to evaluate climate sensitivity based on empirical data. We criticized him for that in Monckton Myth #4. KR #6 - thanks. Terminology is always tricky. If you call it "expected warming" the "skeptics" will latch onto the word "expected" and claim it's not coming. Badgersouth #10 - I think the terms are basically the same thing. protestant #11 - no, it's not an assumption. That's why I included the solar forcing. The "O" in AMO and PDO is "oscillation" for a reason. They switch between positive and negative states, and just move heat around from oceans to air and vice-versa. Even if they contributed 0.08°C to the surface air warming in question, it wouldn't significantly change the calculation. The rest of your comment belongs in the climate sensitivity is low comments.
    0 0
  15. I second KR #6 on the "in the pipeline" terminology. As Ken Lambert's comment #4 shows, it is often misinterpreted. Budgersouth they're not synonims. The thermal inertia of the oceans is the cause of the "expected warming", using KR's terminology. Rememebr that this expected warming refers to a constant forcing, i.e. keeping CO2 concentration and everything else but temperature constant. In reality, it will be larger.
    0 0
  16. OK, I got caught behind the wave at KR#6. However, CO2 levels will not suddenly return to ~280 ppm even if we quit burning all fossil fuels today; so, we are committed to further warming. (I've little doubt that we will quit burning fossil fuels; there's just a question if that will be at the 2-3 degree warmer equilibrium level or the 6 degree level.) In terms a layman can relate to, there is warming 'in the pipeline'. It depends on the audience; anyone familiar with stats will understand a different meaning from the term 'expected value' than someone not familiar, to which it will sound dodgy.
    0 0
  17. I've thought about the terminology for some time - I've seen the "where's this heating hiding?!?" argument quite often, and find it very irritating in it's misconceptions. Possible terminology: Expected warming Unrealized warming Warming needed to redress the imbalance Acme anvil of heating (Coyote/Roadrunner reference) I don't know what the proper term might be (nobody in our group ever lets me name anything, so my skills in this might be suspect). But the "in the pipeline" term is easily misinterpreted.
    0 0
  18. #11: "Natural climate variability has always existed and it didnt suddenly just disappear." See comment on It's a natural cycle, a lonely thread that needs some traffic.
    0 0
  19. KR #17 - I like "unrealized warming". This term suggests that the warming will indeed be realized, which is true. I'll edit the article to incorporate that terminology.
    0 0
  20. FWIW, my choice of wording would be "lag in atmospheric warming as the ocean warms much more slowly". You will have to address KL's arguments with numbers, you can't just sidestep it with terminology like "expected by equilibrium equation" which begs the question "when?". If, for example, deep ocean turnover is large enough to keep cooling the atmosphere by cold bottom water, then there could be a long lag. Quantifying is difficult but the argument is sound (it answers KL).
    0 0
  21. #15: "The thermal inertia of the oceans is the cause of the "expected warming"," This was addressed on the thread The 40 year delay between cause and effect. How about 'observed warming' for the part we've already seen and 'committed warming', as suggested by Wetherald et al 2001? Better still might be 'unavoidable warming,' as suggested by Matthews and Weaver 2010
    0 0
  22. The graph of radiative forcings shows a substantial cooling from cloud albedo effect. How does this compare to recent research?
    0 0
  23. Pete #22 - that's specifically the indirect aerosol effect via seeding clouds. There's still a lot of uncertainty regarding this effect - I don't think recent research has changed the value or reduced the uncertainty very much yet.
    0 0
  24. Dana + protestant: the Delsole paper is nice; "nice" as in cherry-picking galore for protestant. Delsole et al point out that the AMO may contribute 0.08 K/decade in a 30-year period (and hence also 'remove' 0.08 K/decade in a 30-year period). Those are the oscillations around the trend in SST that Delsole et al also mention: 0.1 K/decade. Note the SST here: they talk about SST only.
    0 0
  25. P.S., could not help myself after seeing that first Figure
    0 0
  26. Thanks Marco #24. I didn't bother to look at the paper because AMO/PDO/etc. are a red herring. Like I said, they just move heat around from oceans to air and vice-versa. They don't cause long-term warming. I'm not surprised that protestant misrepresented the study's findings.
    0 0
  27. Dana: Given the number of referalls to other SkS rebuttals in this comment thread, I suggest that you add a "Related Arguments" tab.
    0 0
  28. Dana: Perhaps the point made by Riccardo #15: "The thermal inertia of the oceans is the cause of the "expected warming", using KR's terminology. Rememebr that this expected warming refers to a constant forcing, i.e. keeping CO2 concentration and everything else but temperature constant. In reality, it will be larger." should be woven into the the text of the "Thermal Intertia" section, or added as an explanatory footnote.
    0 0
  29. Marco #25 Great table, I'll keep it for reference!
    0 0
  30. Badgersouth #28 - I added this:
    The amount of unrealized warming is dependent upon the amount of CO2 in the atmosphere (or other radiative forcing causing the energy imbalance) and the thermal inertia of the oceans (which causes a lag before the warming is realized).
    0 0
  31. KR: I would propose describing it as "expected warming", rather than "in the pipeline". Perhaps "delayed warming" would be a better term. The word "expected" gives the subtle impression in the layman's mind that perhaps it may not happen since not all things held in expectation happen.
    0 0
  32. Alexandre #25: it's not mine, though! Please do not attribute it to me, and I'm afraid I do not know the author either.
    0 0
    Moderator Response: [Daniel Bailey] AFAIK, it's paternity is here.
  33. #26: So what? What causes em? How do you explain nonlinear behaviour of the climate (for example see reference: http://www.biology.duke.edu/upe302/pdf%20files/jfr_nonlinear.pdf). The climate oscillates. It has always done that. And whenever you draw a line from max to max the influence will be near zero, but any other interval they contribute. Just because they "dont have a long term trend" doesnt mean they couldnt cause shorter term (<~65 years) fluctuations. Or then you also should also need to explain what causes ENSO and that why that CAN make some years colder and some warmer. Unless you have an explanation for the DO's which is also consistent with the current GHG-theory then I guess you just dont have it. I have been looking for this evidence but havent found it. We dont even have the needed OHC numbers to really see how the OHC behaves during these oscillations: None of the datasets cover a large enough period of time, and XBT compared to ARGO is mostly useless. What you also dont have an explanation for the 1940 blip, and what causes for example North Atlantic to switch to cool and warm modes. Do you know how AMO index can be calculated (hint: by removing the GW signal either by detrending or substracting the global SST anomalies, both give virtually the same result)? Here is a comparison with 'eyeballed' AMO+PDO and detrended (-0.72K/century) HadCRUT3 anomalies: Multiple regression fit gives similar results. You also should take a peek on this Norwegian climate scientis who is an ocean modeler: http://www.bccr.no/acdc/filer/242.i3yGAl.pdf In short: there are two good guesses what causes DO's. It is either internal oscillation, where the earth is trying always to reach its equilirium (actually multiple equiliriums which makes it even more complex). The second good guess is cloud changes (internal or externally forced). Btw, why is it always here people are trying to splice the discussion into multiple threads? Because everything relates to everything, or are you just trying to dodge the fact that some of us skeptics' also have a lot of coherence in our thoughts? The straw-man of #25 sums it all, first splice up the discussion and then create strawmen like that. It's a killing of a proper discussion of the climate. This is what bothers me a lot in this site. I have been a regular reader for 2 years now. But what becomes more and more clear, is that the regular posters arent really familiar with the uncertainities and unknowns of the current climate science. "What science says" is just a meaningless oxymoron, just the way YOU see it, but only a little to do with the truth. (and yes, the most foil-hatted 'skeptic' arguments are properly refuted but who needs that? It is the proper questions which needs answers, and this site does NOT answer to them properly, comprehensively nor properly.)
    0 0
    Response: [muoncounter] You're going wildly off-topic with this scattergun approach. As requested above, please use the appropriate threads for subject-specific discussion - and refer to the Comments Policy.
  34. protestant #33 - it's pretty straightforward. If PDO/AMO/etc. were responsible for the long-term surface air warming trend, then there would be a long-term ocean cooling trend. The opposite is true - both air and oceans are warming, which means there must be an external forcing at work. You're effectively trying to argue that correlation equals causation. And your correlation argument is extremely sketchy. To paraphrase - "PDO and AMO correlate with global temperature as long as you remove the long-term trend". I agree - PDO and AMO cause small short-term surface temperature changes. But they don't cause the long-term trend, and I hope you're not trying to argue otherwise by comparing them to detrended data.
    0 0
  35. Protestant @33, Please read this thread which discusses the following graphic by Tamino. 
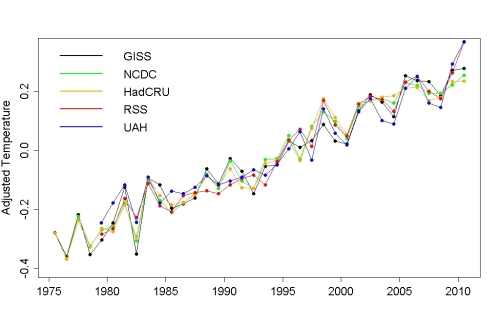
The above figure shows the underlying warming for different temperature datasets (including satellite) after "remov[ing] the estimated impact of el Nino, volcanic eruptions, solar variation, and the residual annual cycle." And the AMO has huge issues because as it turns out, it is defined in such a way that "Variations in the forced signal do leak into the AMO definition. Correlations with the AMO index do alias effects of global warming." (Tamino), and from the same post "Of course there are better ways to do this, but it still illustrates the point: that when you look at AMO correctly, the possibility that it’s much of the cause of global warming vanishes." These oscillations can only temporarily amplify or dampen the long-tern underlying warming trend from increased radiative forcing as GHG levels increase. They would not be referred to as oscillations if they were not transient. That said, they are not ignored by climate scientists and have been the subject of many papers by climate scientists. Some days, like today, I wish that I could yell that fact from the roof-top... Please read AR4 Chapter 9.4.
    0 0
  36. Protestant @33, I cannot help but notice that in your graphic you detrend the HadCRUT3 temperature index by 0.72 degrees K per century. If you remove that trend in order to get a correlation with your combined AMO/PDO index, then that index and the associated oscillations cannot explain the trend. It's that simple. And of course, 0.72 degrees K per century is well within the range of predicted temperatures (given uncertainties)calculated above. In other words, your argument here is a complete non-starter. Even if we allow that Tamino and others grave objections to treating the AMO and PDO as being genuine oscillators independent of various forcings are wrong, and it is not clear that we should. relative position in the AMO/PDO cycles explains at most 0.08 degrees of the trend in the short term, and because they are oscilators, none of the trend over longer periods.
    0 0
  37. #34. I said: they dont contribute on MAX-to-MAX intervals. Which in this case is around 1940-2000's. From 1900-to2010 there is a min-max interval which means they contribute some, and at least half from 1970-today. And you dont have the necessary OHC data to make any longer comparisons than to 2003 which is a ridiculously short of a period. Even the XBT's (which are worth another discussion) dont cover a full. We havent even begun to understand how the OHC behaves during these (short and long term) oscillations. Even if what you propose (external forcing at work) about AMO is true, it would mean at least its not human forcing, since there is no correlation there can also be no causation. Human forcing makes a "hockey stick" while AMO makes not. Thus the explanation would be cloud changes, which would be the nail in the coffin for CAGW. Actually, according to a very recent study by Spielhagen et al, the N Atlantic temps they present follow the solar curve presented by Solanki et al so external forcing is definitely one plausible explanation. #35. I've read it and a load of other carbage he has written. I've even tried commenting but he just keep snipping all of the arguments and only leaving the "frustrated parts" of the messages, or even completely deleting the posts. Other skeptics and non-skeptics have had a similar fate when disagreeing with him. But: If the nonlinear GW signal is removed from the AMO with an alternative analysis (by substracting global SST without NA, from NA), the result is the same. There is no GW signal leaked in it. Tamino also doesnt give any references at all, that why the current scientific view of AMO would be wrong. I hope you both #34 and #35 take your time to look at the references (Otterå about AMO and Rial about nonlinearity, at least).
    0 0
  38. #37. I never said those could explain the detrended part. But they certainly explain some part of the 1970's -today at least. But still, 0.72K/century and we have been forecasted 4-8x more. When will the accelerated warming start? Any bets?
    0 0
  39. protestant - "But still, 0.72K/century and we have been forecasted 4-8x more. When will the accelerated warming start?" I sincerely have to ask - have you read the article at the top of this thread? We're right along predicted temperature rises given our emissions track, thermal inertial of the oceans, and the physics of radiative balance. Your question is not even a strawman - it's nonsensical.
    0 0
  40. In addition to the rather bizarre question as to why we haven't seen more warming when the article showed that we have seen as much warming as expected, I also refer you to Monckton Myth #3: Linear Warming, which also discusses how much future warming we expect to see and when. Since this article is about the warming from 1750 to Present, arguing that some small fraction of the warming since the 1970s could be due to natural oscillations is not relevant here. Nobody claimed otherwise. I'm also going to ignore the unsubstantiated and absurdly wrong statement that there's no correlation between CO2 and temperature. We're starting to get into a Gish Gallop situation here. Please restrict comments here to issues that are discussed in this article.
    0 0
  41. #39: Physics of radiative balance? Which physics do you mean? You mean those physics, which require a _LINEAR_ regression fit with a 2% R^2 to determine feedbacks (Dessler), right? I'd rather call those assumptions. Nature is highly nonlinear and complex. Have you _read_ the paper I linked you on my first post? Of course it is possible to build any kinda houses of cards to explain the recent observations, but the models which have these what you call 'physics' still cant replicate a) the 40's b) the MWP and LIA (dont give me a hockey stick with Mannian smoothing please). AMO (and other, even centennial cycles , who knows?) is a tricky devil for the climate modelers, for sure. Those estimates ALSO require, that the 'accelerated' (similar to 1910-1940) warming from 1970-2010 is man made. Some of it is, but most of it isnt. The effective trend is still the same as in the first part of the 19th century if the natural variables, which can be almost definitely be attributed as natural, are removed.
    0 0
    Moderator Response: [muoncounter] You are continuing to go further and further off-topic. Find the appropriate thread(s) or your scattershot-style comments will start disappearing. Replies, please ref these comments in the appropriate thread.
  42. "Since this article is about the warming from 1750 to Present, arguing that some small fraction of the warming since the 1970s could be due to natural oscillations is not relevant here. Nobody claimed otherwise." Not just a small tiny weeny fraction but a huge part, more than half. [quote]I'm also going to ignore the unsubstantiated and absurdly wrong statement that there's no correlation between CO2 and temperature. "[/quote] I never said CO2 and temperature do not correlate. Yes they do. I said CO2 doesnt correlate with the AMO index. It was maybe 5th or 6th time in this short discussion where my arguments are completely misread. So I suppose there is no reason trying to reason with you. Goodbye.
    0 0
  43. MarkR @ 2 …. most estimates of climate sensitivity do not include carbon cycle feedbacks. Why? Do feedbacks already contribute to global warming? Will that contribution increase significantly as a result of on-going global warming?
    0 0
  44. KR#6 In other words you agree with what I have said in #4.
    0 0
  45. ChrisG #13 What you (and others) might be confusing is energy conservation (first law) with temperature equilibrium. If heat energy (the warming imbalance of 0.9W/sq.m) is added to a vast mass of water from the top and sides (we are not suggesting that the 0.9W/sq.m enters from the ocean bottom yet are we?), then the thermal inertia of water means that it will take a long time for the temperature of the whole mass to reach equilibrium (if ever). There will be warmer water at the top and sides. The DeltaT x specific heat of sea water x mass subject to that DeltaT will equate to the heat energy absorbed (less that absorbed in ice melt or evaporation). Dana1981 #15: "Ken Lambert #4 - sorry, you are incorrect. See KR #6. Also I suggest you read the Lindzen E&E paper I linked in the article. He explicitly states that there is warming in the pipeline from the ocean thermal inertia. He just neglects it because he feels it's too small to make much difference in the calculation, but unlike yourself, doesn't deny that it exists" You are confusing warming temperature in the system somewhere, with external energy imbalance already absorbed. Once the ocean has absorbed heat imbalance energy up to time NOW, then complex circulations move it around - change temperatures and exchange it with the atmosphere via ENSO, AO etc. The energy is still conserved - temperature is an artifact of where that energy is showing up spacially in the system. The energy aborbed from future forcing imbalance will cause 'future' temperature rise as KR#6 correctly says. KR#6 agrees with what I have said in #4 - it is NOT incorrect. We must get this terminology right. 'Energy' is what is added or subtracted via 'external imbalance' or redistributed by internal oscillation. Broadly, 'Temperature' of water, land or air is a measure of the energy already absorbed spacially in the system.
    0 0
  46. protestant " there are two good guesses what causes DO's. It is either internal oscillation, where 'the earth is trying always to reach its equilibrium' ..... " Perhaps this is part of the problem. The earth doesn't, and it can't, try to do anything. The earth is just a planet. That is, it's just a biggish rock with certain features which allow biological as well as simply physical processes to influence conditions at its surface. And that is why it is entirely appropriate to discuss those various features individually. Radiative transfer equations, ocean chemistry, photosynthesis, the physics of glaciers, fossils are all part of the various processes. In this case, the interaction of several processes feed into certain calculations is the process in question. And that is what the discussion is about. It is not like throwing everything into a food processor to mix a cake. It's like carefully assembling a 20,000 piece jigsaw. When you're helping someone assemble the tree in the middle of the picture, it is *not* helpful to offer a piece from the edge. That piece should be offered to the person (thread) looking at that part of the picture.
    0 0
  47. Ken Lambert - Nooooo, I don't agree. You appear to be claiming that "in the pipeline" energies are not evident, and hence GW is false. I have spent a fair bit of time point out that "in the pipeline" means unrealized heating that will occur given current circumstances, but hasn't yet. Your statements to the contrary seem to indicate that you don't understand the terms. I do not agree with you in any fashion regarding your post here, and disavow your claims thereof. If I agree with someone, I'll say so. I have not said that I agree with you.
    0 0
  48. KR at 16:11 PM on 5 February, 2011, regarding "in the pipeline" energies, what evidence is there that any of the warming experienced in the most recent past, say 100 years, is itself not unrealised heating from a time even further back. Given that the heat content of the ocean is yet to be adequately quantified, and that of past centuries is even less sure, how can we know that the unrealised heating anticipated looking forward, is not already constantly being expressed from some time back?
    0 0
  49. johnd #48 - warming requires a mechanism. And thermal inertia acts on timeframes of decades, not centuries. Waiving your hands around and saying "maybe global warming is just the result of a centuries-long lag due to some unknown cause" is not scientific.
    0 0
  50. johnd - A fair question. Do you have evidence, a physical model, or other indications of a >100 year thermal inertia? After all, we do understand where global warming is going, and the cycle time is <100 years as far as anyone can tell. After all - "Assertions without evidence can be dismissed without evidence" (Christopher Hitchens) Please don't post such strawman arguments.
    0 0

1  2  Next

You need to be logged in to post a comment. Login via the left margin or if you're new, register here.


The Consensus Project Website

THE ESCALATOR

(free to republish)


© Copyright 2024 John Cook
Home | Translations | About Us | Privacy | Contact Us