


 Arguments


Can we still avoid 1.5 degrees C of global warming?
Posted on 13 November 2023 by Guest Author
This is a re-post from Yale Climate Connections by Bob Henson
Strictly speaking, it’s not yet impossible to keep from heating our world more than 1.5 degrees Celsius beyond the average global air temperature of the mid-to-late 1800s, when the Industrial Revolution was gaining momentum. In practical terms, though, the odds of keeping global warming to 1.5°C are dwindling fast — though just how fast has been a matter of sharp debate. Here are a few points to help you navigate this critical and contentious topic.
Why is the 1.5°C threshold for global warming important?
The 2015 Paris agreement called for keeping the increase “well below 2°C above preindustrial levels and pursuing efforts to limit the temperature increase to 1.5°C above preindustrial levels.” A 2018 report from the Intergovernmental Panel on Climate Change described escalating risks of long-term warming above 1.5°C, such as heightened threats of extreme weather, sea level rise, crop losses, and widespread coral reef die-offs.
How will we know if we’ve hit the 1.5°C global warming threshold?
Weather varies so much from week to week, month to month, and year to year that it takes a longer period to assess what can be considered the long-term climate (and that task is even more challenging when the climate itself is changing). Local and regional climatology, such as the average high or low on a particular date in your community, is generally based on 30-year averages, updated each decade. Thirty years is considered long enough to smooth out rises and falls in temperature, such as those produced by a sequence of El Niño or La Niña events, the natural Pacific Ocean phenomena that affect weather worldwide.
As it turns out, the Paris agreement did not specify how long global temperature would need to be at or above 1.5°C for the target to be considered breached. With this in mind, scientists and policymakers generally interpret the 1.5°C target as referring to the average over multiple decades, as opposed to daily or even monthly spikes. In other words, a hot spell may briefly push the world above the 1.5°C threshold, but the long-term average is the number to watch.
Air temperatures at ground level are monitored around the clock by thousands of land-based weather stations. Satellite and buoy data help fill in the gaps over oceans. Several entities, including NOAA, NASA, the Japan Meteorological Agency, and the European Union, carry out monthly and yearly analyses of planet-wide surface air temperature. Minor differences in the agencies’ rankings can result from the different ways they treat data-sparse regions such as the Arctic.
Daily: According to data from the EU Copernicus Climate Change Service, the daily global average temperature rose above 1.5°C on several days in December 2015 and on more than 70 days in 2016 during the strong 2015-16 El Niño event. This year the daily average surged above 1.5°C on more than 80 days through mid-October, according to a BBC analysis of Copernicus data.
Monthly: NASA recently reported that the monthly global temperature in September 2023 was 1.7°C above the 1880-1899 period, which it uses as a benchmark for preindustrial climate. This is the first time a monthly temperature in the NASA database has exceeded the 1.5°C benchmark.
Yearly: It’s now virtually certain that 2023 will be the warmest year in more than a century of global recordkeeping. In a November 2023 report, the nonprofit Climate Central estimated that the global average from November 2022 through October 2023 was 1.32°C above the period 1850-1900, making it the highest anomaly for any 12 months on record.
Data from Berkeley Earth show that January-October 2023 was 1.55°C above the January-October average for 1850-1900. With a strong El Niño event now in full swing, 2023 may end up as the first calendar year to average more than 1.5°C warmer than the preindustrial benchmark.
What’s been driving the record global heat of 2023?

The new daily and monthly records of 2023 have been produced in large part by oceanic heat stored during the unusually prolonged 2020-23 La Niña. As the ocean and atmosphere segued from La Niña to El Niño conditions this year, bringing oceanic warmth to the surface of the tropical Pacific, some of that heat has surged into the atmosphere. Of course, even an El Niño-driven spike in global air temperature wouldn’t be producing records if it weren’t happening on top of relentless long-term human-caused warming.
Two other factors in the mix this year were moisture pumped into the stratosphere by an undersea volcanic eruption and a massive drop over recent years in sun-blocking pollution over the world’s oceanic shipping lanes, which both pushed temperatures warmer. Together, these probably account for only a small part of the 2023 temperature spike, although research on both phenomena is ongoing.
Are we cutting emissions quickly enough to stay below 1.5°C?
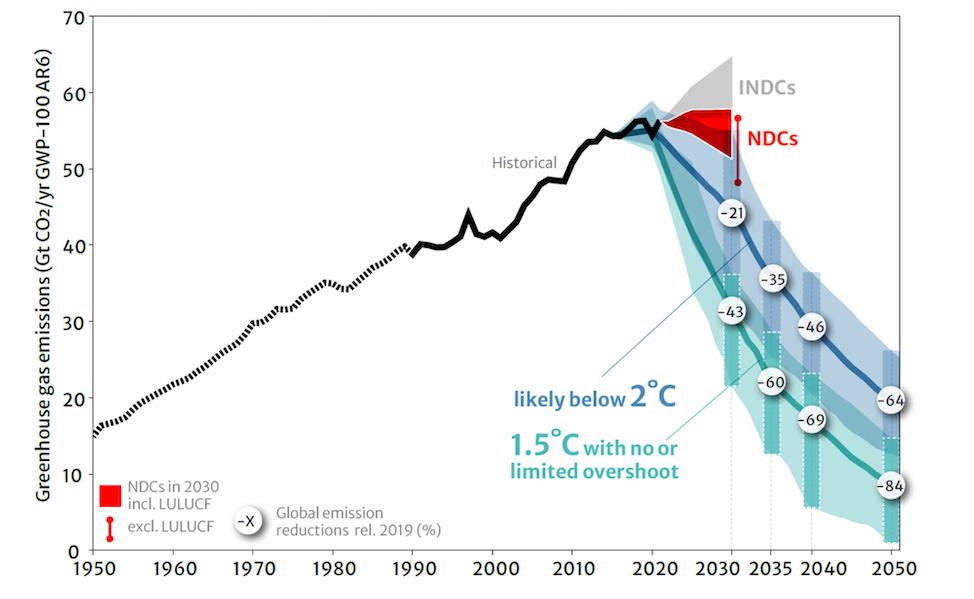
The Intergovernmental Panel on Climate Change’s landmark report of 2018 put immense focus on the 1.5°C goal while underscoring the challenge it would be to reach. The report found that the net greenhouse gas emissions from human activity would need to be 43% lower by 2030 compared to 2019 to maintain a two-thirds chance of either meeting the long-term 1.5°C goal or only briefly overshooting it.
Global emissions haven’t skyrocketed since that report, but neither have they plunged. Apart from a pandemic-related dip of a few percentage points in 2020 and a similarly sized rebound in 2021, carbon pollution has risen at a gradually slowing pace, less than 0.5% a year on average since 2015.
The problem: Each year without a sustained emissions drop puts the 2030 goal further out of reach.
As of 2021, human-produced greenhouse gas emissions (including carbon dioxide, methane, and nitrous oxide from agriculture, land use changes, and fossil fuel burning) were 54.59 gigatonnes. That’s almost 13% above the 2009 level (48.45 gigatonnes), and 2023 will likely come in just above 2021.
Getting from a 13% increase to a 43% drop by 2030 would take intense effort, to put it mildly. Global greenhouse gas emissions would need to plunge by an average of around 8% every year from 2024 through 2030 — in other words, at about twice the pace they did during the pandemic-roiled year of 2020.
Reinforcing these bleak prospects was an October 2023 paper in Nature Climate Change. It estimated that the total amount of carbon dioxide that can be emitted from 2023 onward while maintaining even a 50/50 chance of meeting the long-term 1.5°C goal, is roughly the same as six years’ worth of current emissions — meaning we could end up blowing through the 1.5°C budget before the 2020s are done, even if it were to take a bit longer for those emissions to actually push the long-term average above 1.5°C.
Does the 2023 temperature spike mean that global warming has accelerated?
Judging from natural ups and downs in past decades, it’s quite possible that if the global annual average reaches or exceeds 1.5°C in the next year or two, the value will dip back below 1.5°C later in the 2020s, at least for a few more years.
Eminent climate scientist James Hansen isn’t so sure. He and a group of colleagues published an ominous paper in November 2023 in the journal Oxford Open Climate Change on the much-debated topic of climate sensitivity to greenhouse gases, asserting that the sensitivity may be higher than the range long accepted by most climate scientists. (“Climate sensitivity” is scientist-speak for “the extent to which a certain amount of greenhouse gases warm the planet.”)
The authors point to the recent reduction of sun-blocking pollution from ocean shipping — which they call “the great inadvertent aerosol experiment” — while estimating that the reduction in these and other aerosols could boost the rate of global temperature increase by 50% compared to the period 1970-2010.
“We find that Earth’s climate is very sensitive — more sensitive than the best estimate of the Intergovernmental Panel on Climate Change (IPCC) — which implies that there is a great amount of climate change ‘in the pipeline’,” the paper concludes.
In a news conference linked to the paper’s release, Hansen asserted that “the 1.5°C limit is deader than a doornail.”
Several other leading researchers, including Michael Mann and Zeke Hausfather, are contesting Hansen’s new paper. They’ve concluded that the heat spike of 2023 is still within the range of the natural climate variability that could be expected within our longer-term warming trend.
In a blog post, Mann praised Hansen as “a personal hero to me and many other climate scientists of my generation” while vigorously critiquing the new paper by Hansen and colleagues: “Healthy skepticism is a valuable thing in science. But the standard is high when you’re challenging the prevailing scientific understanding, and I don’t think they’ve met that standard, by a long shot.”
Mann also maintains that the admittedly slim odds of avoiding the 1.5°C threshold still come down to human behavior. “It’s fine for Jim and his colleagues to explore scenarios where we do not act soon enough, and carbon emissions are not lowered adequately to avert specific warming targets such as 1.5C or 2C, but it should be clear that the differences in their conclusions are a result of those policy and behavioral assumptions, not climate physics.”
For more on this unfolding debate, see the Inside Climate News article by Bob Berwyn, “New Study Warns of an Imminent Spike of Planetary Warming and Deepens Divides Among Climate Scientists.”
How fast is renewable energy growing?
If the prospects of staying below 1.5°C are growing dimmer, there are bona fide bright spots in the longer-term endeavor of greatly reducing the need for fossil fuel, which would trim the odds of reaching even more dangerous thresholds of 2°C or higher.
According to the 2023 World Energy Outlook released by the International Energy Agency in October, global demand for coal, oil, and natural gas is projected to peak before 2030. It’s the first time the annual outlook has predicted all three peaks to occur within less than a decade.
These projected drops wouldn’t be because of any dearth of supply — an expectation that was baked into “peak oil” scenarios of 20 years ago — but rather because renewable energy has grown so much more affordable and available thanks to widespread adoption, government support, and technological innovation. The challenge will be for renewables to continue becoming ever more affordable and useful than fossil fuels, despite what could become a growing supply glut of the latter. Indeed, it’s been apparent for more than a decade that there is far more fossil fuel available than the world can safely afford to burn without risking catastrophic climate change.
This year, high interest rates and other economic and administrative hurdles have derailed or postponed some big projects, including several wind farms off the U.S. East Coast. Overall, though, clean energy worldwide is growing at a breakneck pace, especially solar photovoltaic cells. Electricity now makes up about 20% of all final energy consumption — the form in which the energy reaches end users. By 2050, with a continued boom in solar and wind power, it’s projected to be more than 50%. And real-world progress often outpaces what’s predicted in these annual outlooks.
“The transition to clean energy is happening worldwide and it’s unstoppable. It’s not a question of ‘if’, it’s just a matter of ‘how soon’,” said Fatih Barol, executive director of the International Energy Agency, in a statement.
The World Energy Outlook also includes an update to an analysis first published in 2021, “Net Zero Roadmap: A Global Pathway to Keep the 1.5 °C Goal in Reach.”
“The path to 1.5 °C has narrowed, but clean energy growth is keeping it open,” the report says. “We have the tools needed to go much faster … momentum must be accelerated to be in line with the 1.5 °C goal and to ensure that the process of change works for everyone.”
To preserve the 1.5°C goal as well as a net-zero-by-2050 target, the report calls for a rapid scale-up of ambition this decade, including a tripling of renewable energy capacity, a halving of energy intensity (the amount of energy needed for a particular task), and reducing methane from fossil fuels by 75%.


"The report found that the net greenhouse gas emissions from human activity would need to be 43% lower by 2030 compared to 2019 to maintain a two-thirds chance of either meeting the long-term 1.5°C goal or only briefly overshooting it."
This looks technically and economically possible to me as follows.
"A new study by Stanford engineer Mark Jacobson and his team published in the journal Energy & Environmental Science calculates that the world would need to spend around $62 trillion to build up the wind, solar, and hydro power generating capacity to fully meet demand and completely replace fossil fuels. That looks like a huge number, even spread out across the 145 countries cited in the study. But after crunching the numbers, estimates show that countries would make the money back in cost-savings in a relatively short period of time: Between one to five years."
adventure.com/global-cost-of-renewable-energy/#:~:text=A%20new%20study%20by%20Stanford,and%20completely%20replace%20fossil%20fuels.
My view: To meet this goal of cutting emissions 43% by 2030, lets assume that we spend half the required 62 trillion, thus 30 trillion on renewables over the period 2023 - 2030 . That is 4.2 trillion dollars each year. Total global gdp (economic output) each year is currently about $100 trillion, so 4.2 trillion is about 4% of global gdp per year.
This looks a feasible amount of money to me if we really wanted. Its not going to impoverish the world. Its about what the USA spends on the military each year as a % of its own gdp. It would require cutting about 4% from other budgets including probably government spending and consumer goods spending. 4% is not a massive number.
It would mean a huge engineering effort to transfer capacity into renewables but America and other countries did a similar sort of thing producing military hardware in WW2. And we are already partly there with renewables growing fast.
Of course electricity generation is just one component but its the big issue, and the highest cost issue we need to address.
It's really a question of whether the world can find the motivation to do all this. There are just several impediments in the way 1) The denialist campaign 2) Our brains are hardwired to priortise massive immediate threats like covid or wars, not insidious longer term problems like climate change even although they are a larger threat, 3) Lots of resistance to lifestyle change for various reasons, 4) politics.
So I alternate between hope and despair.
Text under the Figure has spelled wrongly «NCDs, or national pledges» ... should have been: «NDCs, or national pledges».
Why is the historical black graph before 1990 not solid?
Maybe because the data is stipulated?
kar @ 2:
Your answer to the question about pre-1990 data is not hard to find. The authors of the blog post kindly added a link to the image source in the caption.
If you follow that link, you can download the report. If you go to the original version of the figure in the report, it says:
Bob @ 3 -
I wondered if kar meant stippled?