


 Arguments


Hockey Stick Own Goal
Posted on 23 February 2011 by dana1981
 In this post we continue our Prudent Path Week theme, and the examination of the two documents the "skeptics" referenced in their recent letter to Congress — 'Carbon Dioxide and Earth's Future: Pursuing the Prudent Path' and the NIPCC report. Specifically, we examine a major contradiction between the two reports regarding a key factor in climate science - climate sensitivity.
Medieval vs. Current Global Temperature
In their Prudent Path document, Craig and Sherwood Idso argue that the Medieval Warm Period (MWP) was at least as hot as today.
"it was just as warm as, or even warmer than, it has been recently during both the Roman and Medieval Warm Periods"
Informal Idsos
The document spends several pages qualitatively discussing various temperature proxy data sets from various isolated geographic locations — one of the main pursuits of the Idsos' website co2science.org. The only response this endeavor warrants is the suggestion that if the Idsos would like to attempt to use this data to demonstrate that the MWP was hotter than today, they should perform a quantitative assessment — combine these proxies into either a northern hemisphere or global data set, estimate the average temperature, and submit their results to a peer-reviewed scientific journal. Over a dozen such millennial northern hemisphere reconstructions have been peer-reviewed, and all agree that current temperatures are hotter than during the MWP peak.
Ljungqvist (2010)
The document also relies fairly heavily on one such millennial northern hemisphere reconstruction — Ljungqvist (2010) — which the Idsos refer to as a "stellar effort". However, this reconstruction is not substantially different from the many other millennial northern hemisphere temperature reconstructions, as Ljungqvist himself states in his paper:
“Our temperature reconstruction agrees well with the reconstructions by Moberg et al. (2005) and Mann et al. (2008) with regard to the amplitude of the variability as well as the timing of warm and cold periods, except for the period c. AD 300–800, despite significant differences in both data coverage and methodology.”
Contrary to the Idsos' claims in the Prudent Path document, Ljungqvist says the following when combining his proxy reconstruction with recent instrumental temperature data:
“Since AD 1990, though, average temperatures in the extra-tropical Northern Hemisphere exceed those of any other warm decades the last two millennia, even the peak of the Medieval Warm Period”
Indeed by plotting Ljungqvist's data along with Moberg et al. (2005), Mann et al. (2008), and the surface temperature record, we can confirm that the three reconstructions are very similar, and all show the peak of the MWP approximately 0.5°C cooler than today's temperatures (Figure 1).
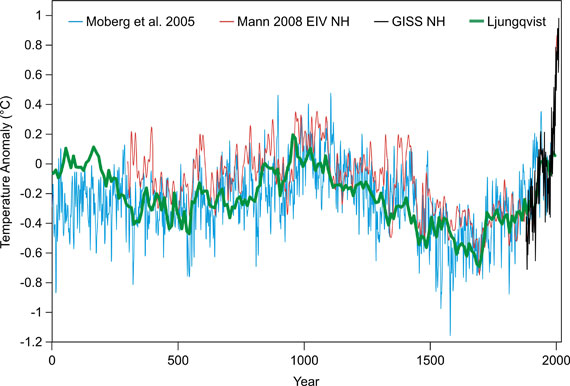
Figure 1: Moberg et al. 2005 NH (blue), Mann et al. 2008 EIV NH (red), Ljungqvist 2010 NH (green), and GISS land+ocean NH (black). Courtesy of Robert Way and John Cook.
Thus we can see that the Prudent Path document's own references do not support its claim that the MWP peak was as hot or hotter than today's temperatures. This is a good thing, because the larger past natural temperature changes were, the larger the climate sensitivity.
Skeptic Climate Sensitivity Contradiction
A quick perusal through the Skeptical Science rebuttal database makes it clear that "skeptic" arguments often contradict each other. Perhaps the worst contradiction of them all are the conflicting claims that the MWP was hotter than today, and that climate sensitivity is low.
Skepticism Requires Low Climate Sensitivity
Climate sensitivity (the amount the planet's average surface temperature will warm given a certain energy imbalance, including feedbacks) is the key to global warming skepticism. The amount of warming at the Earth's surface depends on two factors — the size of the energy imbalance, and the climate sensitivity to that energy. However, the first factor (the energy imbalance caused by the increase in greenhouse gases) is a well-measured and well-known quantity.
Therefore, the only way to argue that humans aren’t driving global temperatures now, and temperature change over the next century won’t be potentially catastrophic in a business-as-usual scenario, is if climate sensitivity is low. "Skeptic" climate scientists like Lindzen, Spencer, and Christy realize this, and it's why their arguments consistently center around the argument "climate sensitivity is low".
The heat trapped by the increased atmospheric CO2 has to go somewhere, and the only way it's not causing and will not cause significant global warming and climate change in the future is if it's suppressed by cooling effects from negative feedbacks. If this were the case, climate sensitivity would be low. And this is indeed a key argument made in the NIPCC report:
"Scientific research suggests the model-derived temperature sensitivity of the earth accepted by the IPCC is too large. Corrected feedbacks in the climate system could reduce climate sensitivity to values that are an order of magnitude smaller."
The NIPCC report is claiming that the IPCC sensitivity range is too high by a factor of 10, but the Idso Prudent Path document, by claiming that the MWP was as hot or hotter than today, is arguing that the IPCC sensitivity range is too low.
Hot MWP Means High Sensitivity
As John Cook has previously discussed, arguing for large swings in natural temperature variation such as a particularly hot MWP is akin to arguing for high climate sensitivity. Several scientific studies have examined the radiative forcings and temperature changes over the past millennium, such as Hegerl et al 2006, as shown in Figure 2:
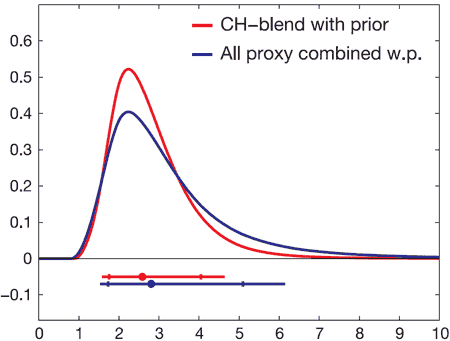
When you combine the temperature record over the past millennium with climate forcings, you get a most likely climate sensitivity value close to 3°C, consistent with the IPCC climate sensitivity range of 2°C to 4.5°C. So if the temperature swings were actually larger than in the reconstructions used by Hegerl and other studies on millennial climate sensitivity, it means the climate sensitivity is actually higher than the IPCC has concluded.
The two documents referenced in the "skeptic" letter to Congress blatantly contradict each other on this issue. The NIPCC report argues that the climate sensitivity is an order of magnitude lower than the IPCC range, while the Idso Prudent Path document indirectly argues that the sensitivity is higher than the IPCC range. On the most important issue for climate "skeptics" — climate sensitivity — the two documents cited in the "skeptic" letter to Congress contradict each other by a factor of ten.
The True Prudent Path
Ironically, although the two "skeptic" documents differ on the climate sensitivity parameter by an order of magnitude, both are wrong. There are many independent lines of evidence behind the IPCC climate sensitivity range, meaning that it's exceptionally unlikely that it's wrong by an order of magnitude, as the NIPCC report claims. And as discussed above, the evidence does not support the Idso claim that the MWP peak was as hot or hotter than today.
Thus the real "prudent path" involves proceeding under the assumption that the well-supported IPCC likely range of climate sensitivity (2 to 4.5°C with a most likely value of 3°C warming for a doubling of atmospheric CO2) is correct. In this scenario, we are heading towards extremely dangerous and potentially catastrophic warming and climate change this century in a business-as-usual scenario.
Thus the true prudent path involves taking immediate action to significantly reduce human CO2 emissions. If the "skeptics" want to convince us otherwise, they need to start by getting their story straight.
This post was written by Dana Nuccitelli (dana1981) and has been developed into the Intermediate rebuttal to "Ljungqvist broke the hockey stick"


 0
0  0
0 This is one reason to prefer sensitivity calculations based on the last glacial maximum, where the much larger changes in forcings and temperatures restrict the potential error.
 Figure 1: Moberg et al. 2005 NH (blue), Mann et al. 2008 EIV NH (red), Ljungqvist 2010 NH (green), and GISS land+ocean NH (black). Courtesy of Robert Way and John Cook.
This is a fascinating graphn thanks Dana. Firstly the reconstructions do follow measured temperatures since ~1900s until 1990 ish which is reassuring to a degree, after which things get hot quickly, 0.2C a decade from 1980, or ~0.6C on 30 years.
Looking at the graph two things get my interest, there appears to be a ~1000year natural temperature variation of about 0.3C (0.3C either side of the mean) arround a mean of -0.1C (from 0yr to 1980ish) with an added variation of ~+/-0.2C arround the running mean, meaning that (0.3C + 0.2C) or 0.5C above -0.1C would be a thousand year extreme warm year, so that is +0.4C on this chart and there are 2 spikes in blue of that magnitude in the middle of Medeival NH warming event.
However the mid 1000-2000 cold dip period is cooler than the previous one between 0-1000 years by about 0.1-0.2C suggesting a possible cooling between the two, which is also in keeping with the 2000year cooling trend found in the arctic temperature record and in keeping with orbital variations in the NH which leading a general cooling of the NH at the present time, although this is a very slow cooling.
All things being equal therefore by natural variation the NH should have been warming from 1500-1600 on wards and 1900-2000 should be the peak of the warming. Without the cooling trend it would be expected from the natural variation that the NH would reach another 1000year peak hot round about now, however this peak should be +0.2C mean with a year to year possibility of +0.2C or +0.4C just like in the 900-1100's and although for an individual year may even surpass this, the probability is less 1:1000 or more.
Lets not forget the long term cooling due to orbital changes in the NH (clearly the arctic would amplify this effect as orbital effects are greatest nearer the poles), which should be bringing the mean down to lower than -0.1C (i suspect it is -0.1C as the mean for the whole series is skewed to 0C by the inclusion of the recent hot years), which means to get any year hotter than 0.4C than 2000year mean would be a truly exceptional event via natural variation.
Lastly it looks like the mean has suddenly jumped, (would expect to phase jumps in a choatic system) and the new mean seems be a lot higher as there have just been a 10year period were then mean is 0.8C higher (than -0.1C). It is also of note that 2010 from solar and Nino (mod El Nino 5 months, Strong La Nina 7 months) activity should have been a cooler year than average, yet it was the hottest yet and November 2010 was in a well established La Nina and histroical low of sun activity and yet was also the hottest yet.
So if 2010 and its weather was a cold year, what is a warm year going to be like?
Could the mean have shifted again in 2010 with the earth being tipped into a hotter regime like it probably was 1998?
Would this be in keeping with a step changing choatic system and that would mean that the jumps should get more frequent if the warming influence is maintained?
As for Climate sensitivity, in the pliocene it 3-5C hotter despite all the natural variation of millions of years, and thus the only substantially different variable was the pCO2 at 350-400ppm although 350ppm more robust from recent evidence. 3-5C would take ~1000years to effectuate due to lags in the system however 60% is realised in the first 100year or so, that means we can expect at least 1.8C to a maximum rise of 3C by 2100, if CO2 levels fall to 350ppm ish.
The Earth is a choatic system and therefore will have multiply possible CS as parameters change, the amount of ice will make a difference, the orientation of the continents (pliocene was similiar to now), and therefore CS will vary and have high and low possibilities. From the above long term CS for doubling can be high (3-4x pliocene temperature range) and as at present the earth has a pole whose albedo turn arround is very high going from ice to sea which makes sense as a CS amplifyer especially if permafrost GHG gas release is also considered.
Also all the changes being observed in the system are occuring faster than expected by a CS or only 3C.
Anyway it is very likely CO2 will hit 450-500ish the way things are going and that is well too high for serious consideration of there being any widespread fruitful scenarios for the future.
An interesting graph clearly shows the globe is warming and very quickly, however at least natural variation should trend temperatures down a little, unless of course the natural variation seen in the graph is actually mainly a sea-saw NH / SH event due to long term flow patterns in the AMOC as that makes the current global warming even more impressive and is it likely that flucation could be changed or interupted if an external heating influence is added in.
Figure 1: Moberg et al. 2005 NH (blue), Mann et al. 2008 EIV NH (red), Ljungqvist 2010 NH (green), and GISS land+ocean NH (black). Courtesy of Robert Way and John Cook.
This is a fascinating graphn thanks Dana. Firstly the reconstructions do follow measured temperatures since ~1900s until 1990 ish which is reassuring to a degree, after which things get hot quickly, 0.2C a decade from 1980, or ~0.6C on 30 years.
Looking at the graph two things get my interest, there appears to be a ~1000year natural temperature variation of about 0.3C (0.3C either side of the mean) arround a mean of -0.1C (from 0yr to 1980ish) with an added variation of ~+/-0.2C arround the running mean, meaning that (0.3C + 0.2C) or 0.5C above -0.1C would be a thousand year extreme warm year, so that is +0.4C on this chart and there are 2 spikes in blue of that magnitude in the middle of Medeival NH warming event.
However the mid 1000-2000 cold dip period is cooler than the previous one between 0-1000 years by about 0.1-0.2C suggesting a possible cooling between the two, which is also in keeping with the 2000year cooling trend found in the arctic temperature record and in keeping with orbital variations in the NH which leading a general cooling of the NH at the present time, although this is a very slow cooling.
All things being equal therefore by natural variation the NH should have been warming from 1500-1600 on wards and 1900-2000 should be the peak of the warming. Without the cooling trend it would be expected from the natural variation that the NH would reach another 1000year peak hot round about now, however this peak should be +0.2C mean with a year to year possibility of +0.2C or +0.4C just like in the 900-1100's and although for an individual year may even surpass this, the probability is less 1:1000 or more.
Lets not forget the long term cooling due to orbital changes in the NH (clearly the arctic would amplify this effect as orbital effects are greatest nearer the poles), which should be bringing the mean down to lower than -0.1C (i suspect it is -0.1C as the mean for the whole series is skewed to 0C by the inclusion of the recent hot years), which means to get any year hotter than 0.4C than 2000year mean would be a truly exceptional event via natural variation.
Lastly it looks like the mean has suddenly jumped, (would expect to phase jumps in a choatic system) and the new mean seems be a lot higher as there have just been a 10year period were then mean is 0.8C higher (than -0.1C). It is also of note that 2010 from solar and Nino (mod El Nino 5 months, Strong La Nina 7 months) activity should have been a cooler year than average, yet it was the hottest yet and November 2010 was in a well established La Nina and histroical low of sun activity and yet was also the hottest yet.
So if 2010 and its weather was a cold year, what is a warm year going to be like?
Could the mean have shifted again in 2010 with the earth being tipped into a hotter regime like it probably was 1998?
Would this be in keeping with a step changing choatic system and that would mean that the jumps should get more frequent if the warming influence is maintained?
As for Climate sensitivity, in the pliocene it 3-5C hotter despite all the natural variation of millions of years, and thus the only substantially different variable was the pCO2 at 350-400ppm although 350ppm more robust from recent evidence. 3-5C would take ~1000years to effectuate due to lags in the system however 60% is realised in the first 100year or so, that means we can expect at least 1.8C to a maximum rise of 3C by 2100, if CO2 levels fall to 350ppm ish.
The Earth is a choatic system and therefore will have multiply possible CS as parameters change, the amount of ice will make a difference, the orientation of the continents (pliocene was similiar to now), and therefore CS will vary and have high and low possibilities. From the above long term CS for doubling can be high (3-4x pliocene temperature range) and as at present the earth has a pole whose albedo turn arround is very high going from ice to sea which makes sense as a CS amplifyer especially if permafrost GHG gas release is also considered.
Also all the changes being observed in the system are occuring faster than expected by a CS or only 3C.
Anyway it is very likely CO2 will hit 450-500ish the way things are going and that is well too high for serious consideration of there being any widespread fruitful scenarios for the future.
An interesting graph clearly shows the globe is warming and very quickly, however at least natural variation should trend temperatures down a little, unless of course the natural variation seen in the graph is actually mainly a sea-saw NH / SH event due to long term flow patterns in the AMOC as that makes the current global warming even more impressive and is it likely that flucation could be changed or interupted if an external heating influence is added in.
 .
Tamino also shows separate graphs for volcanic, solar and MEI fluctuations removed from the temperature signal. And the forcing that is left driving the uptrend is ... you guessed it!
.
Tamino also shows separate graphs for volcanic, solar and MEI fluctuations removed from the temperature signal. And the forcing that is left driving the uptrend is ... you guessed it!
 Northern hemisphere 30 year trends are 2-3 times these rates.
"average standard deviation of the running 30 year interval over the instrumental period to 1979 is 0.103"
Do you mean the satellite record since 1979? Or the surface record up to 1979; if so why stop in 1979? In either case, its a noisy signal; hence the rationale (as I read it) for Tamino's filtering process rather than a purely statistical trend removal.
Northern hemisphere 30 year trends are 2-3 times these rates.
"average standard deviation of the running 30 year interval over the instrumental period to 1979 is 0.103"
Do you mean the satellite record since 1979? Or the surface record up to 1979; if so why stop in 1979? In either case, its a noisy signal; hence the rationale (as I read it) for Tamino's filtering process rather than a purely statistical trend removal.
 The problem I have with the importance of volcanic forcing is that it's very short lived. I see the MM coincides with a period of high volcanic activity but it doesn't really explain how we got to the MM. What I mean is the MWP to MM period is 600-700 years of declining temperatures. This period has periods of both high and low volcanic activity. I'm not sure of the resolution in the temperature reconstructions but volcanic may explain some large negative departure in some of the data points (maybe for example those very low spikes at the MM) but they can't really account for the multi-centennial trends. In regard to your mathes wouldn't you have to take some sort of mean volcanic forcing over the full MWP-MM period?
The only real forcing likely to explain those longer trends are solar except as I keep saying it appears that TSI changes are far too small to explain them.
"First, there is nothing wrong with allowing the change in forcings but keeping Hegerl's reconstruction."
I think we both agree that both fields (paleotemperature reconstruction and TSI reconstructions) are fields of science that are in flux, if not still in their infancy then going through a painful adolesence. My contention is the newer paleotemp estimates should be matched with the newer TSI estimates but I concede there is no absolute logic to that. But retain all the estimates and you end up with a spread of climate sensitivity that is so wide to be almost meaningless.
As you say the IPCC may not exclude climate sensitvity being between 5-9 but just based on the image in #109 then other parts of the science are going to struggle. It looks like models won't handle those well or the LGM. That was my earlier point I think this is not just a problem for skeptics.
The problem I have with the importance of volcanic forcing is that it's very short lived. I see the MM coincides with a period of high volcanic activity but it doesn't really explain how we got to the MM. What I mean is the MWP to MM period is 600-700 years of declining temperatures. This period has periods of both high and low volcanic activity. I'm not sure of the resolution in the temperature reconstructions but volcanic may explain some large negative departure in some of the data points (maybe for example those very low spikes at the MM) but they can't really account for the multi-centennial trends. In regard to your mathes wouldn't you have to take some sort of mean volcanic forcing over the full MWP-MM period?
The only real forcing likely to explain those longer trends are solar except as I keep saying it appears that TSI changes are far too small to explain them.
"First, there is nothing wrong with allowing the change in forcings but keeping Hegerl's reconstruction."
I think we both agree that both fields (paleotemperature reconstruction and TSI reconstructions) are fields of science that are in flux, if not still in their infancy then going through a painful adolesence. My contention is the newer paleotemp estimates should be matched with the newer TSI estimates but I concede there is no absolute logic to that. But retain all the estimates and you end up with a spread of climate sensitivity that is so wide to be almost meaningless.
As you say the IPCC may not exclude climate sensitvity being between 5-9 but just based on the image in #109 then other parts of the science are going to struggle. It looks like models won't handle those well or the LGM. That was my earlier point I think this is not just a problem for skeptics.
 As you can see, there were two very large volcanoes in that periods, and a continuous sulfate load in the atmosphere. The 1815 volcano (Tambora) is estimated to have generated 14 w/m^2 forcing. Assuming scaling is linear, the background sulfate level would have generated a forcing around -0.5 to -1 w/m^2, or enough for around a 0.5 degree equilibrium decrease in global temperatures after feedbacks. Half a century without volcanoes would remove that negative forcing, and could result (accordingly) in an increase in global meant temperature of up to 0.5 degrees, ie, the equivalent of the MWP.
 Figure A: Ljungqvist's Reconstruction with Instrumental Data that was used for Calibration
 Figure B: Ljungqvist's Reconstruction with Instrumental Data Deleted
It is evident from Figures A and B that the MWP was at least as warm as the current warming period. Moberg (2005) and Mann (2008) show similar results when proxies are compared with proxies. Therefore, a correct interpretation is that all three reconstructions show that recent temperatures are similar to the MWP.
From the foregoing, it would appear that the Prudent Path does support its claim that, if you compare proxies with proxies in your three reconstructions, the MWP was as hot as today.
Figure B: Ljungqvist's Reconstruction with Instrumental Data Deleted
It is evident from Figures A and B that the MWP was at least as warm as the current warming period. Moberg (2005) and Mann (2008) show similar results when proxies are compared with proxies. Therefore, a correct interpretation is that all three reconstructions show that recent temperatures are similar to the MWP.
From the foregoing, it would appear that the Prudent Path does support its claim that, if you compare proxies with proxies in your three reconstructions, the MWP was as hot as today.

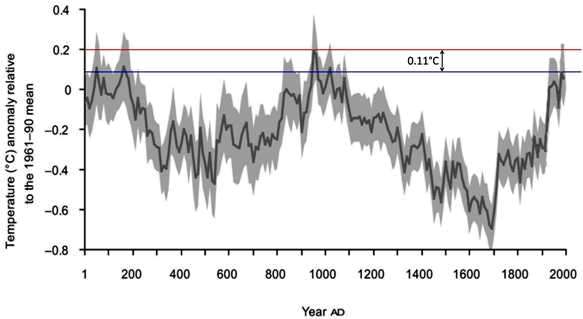 I have plotted the MWP peak temperature as the red line and the modern peak as the blue line on Ljungqvist's (2010) temperature reconstruction in Figure C and it is evident that the MWP peak is 0.11 °C warmer than the modern peak, i.e. the MWP was warmer than the 1990-1999 mean temperature.
Tom, I also agree that the GISS data show that 2000-2009 mean temperature is 0.18°C higher than 1990-1999. Now, if I assume that the proxy temperatures respond linearly with actual temperatures, the 2000-2009 peak would be 0.18 - 0.11 = 0.07°C higher than the MWP. This is hardly unprecedented warming and is about one-ninth of the 0.6 °C figure stated by Dana.
Finally, the assumption that proxies would increase linearly from the 1990's to the 2000's questionable because, "…recent proxy data does not emulate the recent instrumental data" (Ljungqvist, 2010). Proxy temperatures are much lower than the corresponding present-day instrumental temperatures (see Figure A in #132) i.e., the so-called divergence problem. What we really need are present-day proxies so that we can compare the current warm period with the earlier proxies.
I have plotted the MWP peak temperature as the red line and the modern peak as the blue line on Ljungqvist's (2010) temperature reconstruction in Figure C and it is evident that the MWP peak is 0.11 °C warmer than the modern peak, i.e. the MWP was warmer than the 1990-1999 mean temperature.
Tom, I also agree that the GISS data show that 2000-2009 mean temperature is 0.18°C higher than 1990-1999. Now, if I assume that the proxy temperatures respond linearly with actual temperatures, the 2000-2009 peak would be 0.18 - 0.11 = 0.07°C higher than the MWP. This is hardly unprecedented warming and is about one-ninth of the 0.6 °C figure stated by Dana.
Finally, the assumption that proxies would increase linearly from the 1990's to the 2000's questionable because, "…recent proxy data does not emulate the recent instrumental data" (Ljungqvist, 2010). Proxy temperatures are much lower than the corresponding present-day instrumental temperatures (see Figure A in #132) i.e., the so-called divergence problem. What we really need are present-day proxies so that we can compare the current warm period with the earlier proxies.


Comments