Climate Science Glossary

Term Lookup

Enter a term in the search box to find its definition.

Settings

Use the controls in the far right panel to increase or decrease the number of terms automatically displayed (or to completely turn that feature off).

Term Lookup

Settings


All IPCC definitions taken from Climate Change 2007: The Physical Science Basis. Working Group I Contribution to the Fourth Assessment Report of the Intergovernmental Panel on Climate Change, Annex I, Glossary, pp. 941-954. Cambridge University Press.

Home Arguments Software Resources Comments The Consensus Project Translations About Support

Bluesky Facebook LinkedIn Mastodon MeWe

Twitter YouTube RSS Posts RSS Comments Email Subscribe


Climate's changed before
It's the sun
It's not bad
There is no consensus
It's cooling
Models are unreliable
Temp record is unreliable
Animals and plants can adapt
It hasn't warmed since 1998
Antarctica is gaining ice
View All Arguments...


Username
Password
New? Register here
Forgot your password?

Latest Posts

Archives

A Swift Kick in the Ice

Posted on 19 February 2011 by Rob Honeycutt

Commenting in the trenches of the climate change blogosphere I find a large number of people who lack very basic understanding about Arctic Ice.  While I'm not an expert in the field I have managed to learn a few things with regards to why Arctic ice is an important issue.  There are a few misconceptions that require a "swift kick in the ice."

When learning about these issues myself I came upon a question that I could not immediately answer.  We know that water vapor is a strong greenhouse gas.  We know that warmer air holds more moisture than cold air, in fact, to the point where the Antarctic is one of the driest deserts on the planet.  So, how does this jibe with the idea of polar amplification, the idea that the poles will warm faster than the rest of the planet on average?  The climate models tell us that the poles will warm faster, and the model results are proving true now. Why would the poles warm faster if there is so little water vapor in the air?
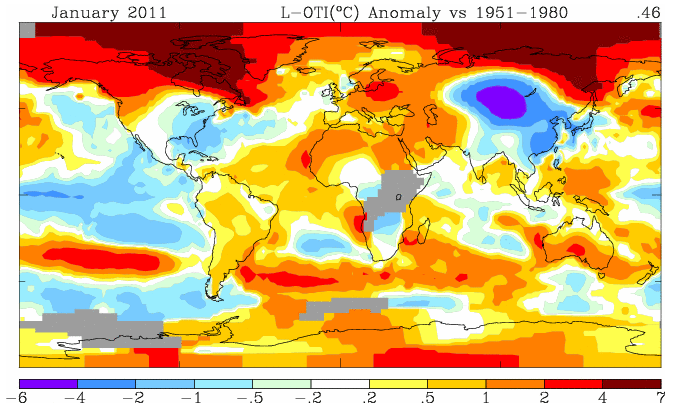
Fig 1  -  Surface Temperature Map for Jan 2011 (Source: GISS)

The first answer comes by way of looking at a surface temperature map (Fig 1).  What we find is that the north and south poles are not warming equally.  In fact, the term "polar amplification" is better described by saying "Arctic amplification."  If we look out to the end of the century there is anticipated to be amplification in the south as well but most of the warming will take place in the north.

But that still leaves us with, why?  The Arctic gets cold too, therefore is drier than the equator.  Why would the equator not warm faster?  
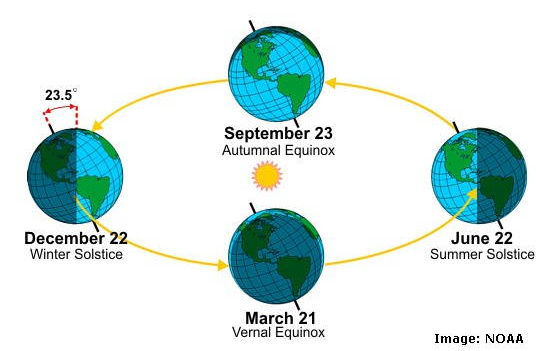
Fig 2  -  Orbital tilt through the year

Pretty much everyone knows that these basic very important facts about the north pole:

  1. The ice at the pole is covering the Arctic ocean.  It's sea ice.
  2. Both poles are mostly dark half the year and mostly light half the year.

These two very basic aspects of the Arctic make it special in terms of climate change form the reason why Arctic Amplification is happens and is so important.

Each year the ice of the Arctic thaws back to a minimum extent during the late summer, usually some time in September.  Then it freezes back each winter.  This is obviously because summer months are warmer and winter months are colder.  

The Battle of Albedo

Now I'll beat you up with the concept of "albedo."  Albedo is the effect where light colored surfaces reflect light and dark colored surfaces absorb light. Think of it as white pavement or black pavement.  Black pavement is always going to scorch your bare feet more than white pavement in the noontime sun.  Dark surfaces absorb more heat from the sun.  Light surfaces reflect more light away and absorb less heat.  
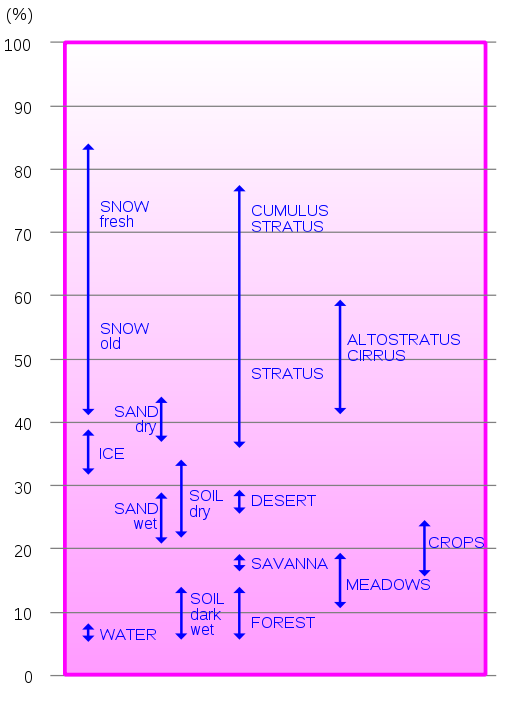
Fig 3  -  Albedo effects (source: wikipedia)

As you can see from Figure 3, the albedo of fresh snow is dramatically different from water - it's much more reflective.

In the winter the Arctic sea is almost completely frozen over but this doesn't matter a lot because there is little sun shine for half the winter and even no sun shine at all for several months of the year.  There is no albedo effect at all during this part of the year.

In the summer months, though, the story is the opposite.  If the Arctic Sea is covered with ice in the summer - as it has been dating back perhaps thousands, to millions of years - the incoming sunlight is mostly reflected back to space without adding any heat to the Earth.  But, as ice melts back, as is happening today, the summer sun is absorbed by the darker open sea exposed by the disappearing ice.  

The open water absorbs more and more heat during the extended daylight of the summer months until winter comes again, when the Arctic Sea freezes.  But because of warming the ice is also losing its capacity to freeze back to previous levels.  This is what is meant by a feedback.  Less ice makes warmer water, which makes thinner ice, which melts easier, which makes warmer water… and so on.
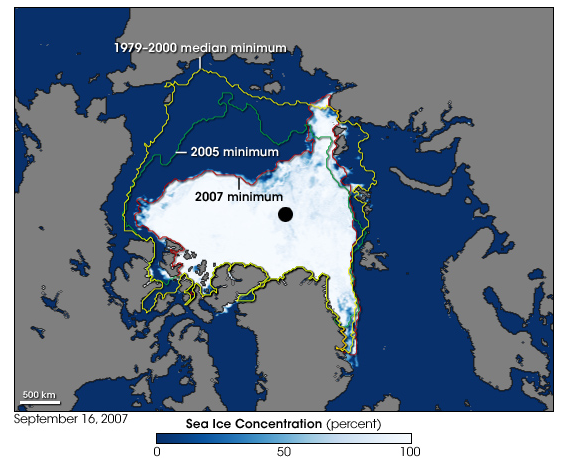
 Fig 4  -  2007 Summer sea ice minimum (source: NSIDC)

This also points out why the sea ice in the Antarctic is less important and generates less warming.  The Antarctic is a land mass 1.5 times the size of the United States.  Each winter sea ice develops around the Antarctic continent but thaws back mostly to the coast each summer.  There it can go no further.  The continent is almost completely covered in snow year round so the south pole maintains its high reflectivity during the summer months.

Something to be wary of is people who point to very select years or short time periods to say the ice is not melting.  You have to look at all the data to see the full picture.  The full picture of the Arctic clearly shows a rapid decline of ice both in extent (area) and volume (total ice).  Some people will also tell you that ice is growing in Antarctica.  That's true and false.  Winter sea ice extent is increasing slightly, but the land based ice, on the whole, is melting.  And as we understand above, winter sea ice extent is not going to have any effect because there is little or no sun in the winter.

When you take a moment to step back from the dusty battle taking place on climate issues sometimes you gain a little perspective.  I've actually learned quite a lot doing battle in the blogosphere trenches.  On occasion I get a boot on the derriere that forces me to try to better understand the arguments on both sides of the issue and learn more about what scientists are trying to tell us. 

It's not a pretty battle, and you have to bust ice to really get down to the truth.

-  -  -  -  -  -  

For the most up to date and accurate information about snow and ice issues you can visit the NSIDC, the National Snow and Ice Data Center.

0 0

Printable Version  |  Link to this page

Comments

Prev  1  2  3  4  5  Next

Comments 51 to 100 out of 214:

  1. RW1: "as more ice melts, you get closer and closer to North Pole, which means lower and lower insolation." Warm water seems to melt ice quite well. From a study quoted in Science Daily 28 Jan 2011: ... the rapid warming of the Arctic and recent decrease in Arctic sea ice extent are tied to the enhanced heat transfer from the North Atlantic Ocean, ... "Such a warming of the Atlantic water in the Fram Strait is significantly different from all climate variations in the last 2,000 years," "Furthermore, increasing temperatures can lead to increases in evaporation, which can lead to increasing snow accumulations, which in turn increase the earth's surface albedo and have a cooling effect, which in turn can cause more ice to grow back." Wishful thinking, RW1? Countered by Markus et al 2009, who find that warming temperatures are pushing the melt onset date earlier and the freeze onset later. For the entire Arctic, the melt season length has increased by about 20 days over the last 30 years. Largest trends of over 10 days/decade are seen for Hudson Bay, the East Greenland Sea, the Laptev/East Siberian seas, and the Chukchi/Beaufort seas. Those trends are statistically significant at the 99% level. So the time duration for your cooling-due-to-increased-albedo is shrinking. And isn't that increased snowfall occurring in the winter, when Arctic albedo is irrelevant because there's little or no daylight?
    0 0
  2. muoncounter (RE: 51), "So the time duration for your cooling-due-to-increased-albedo is shrinking." Then why was the summer minimum in 2008 over 16% larger than the record low the previous year in 2007, for example? What caused it to grow back (or melt less) just the next year and subsequent years after? How is this behavior consistent with positive feedback? Furthermore, why don't the smaller summer minimums in the Artic correlate with years where average global temperatures are generally higher and vice versa? If global warming is what is causing Artic sea ice melt and will cause more in the future, shouldn't this be the case? Or maybe a much larger confluence of factors are determining how much ice melts or doesn't melt? Also, what about the uncorrelated minimum trends in the Antarctic? What's your explanation for those? "And isn't that increased snowfall occurring in the winter, when Arctic albedo is irrelevant because there's little or no daylight?" Yes, but more snow can persist longer as the days and weeks move into the Spring - keeping temperatures colder, and thus reducing the overall amount of melting that occurs at summer minimum.
    0 0
  3. Time for a dog pile ;) Norman, choice of the base line makes no difference to the relative anomaly. By choosing the last ten years for the baseline, you may make the current anomalies look small, but you have done so by making the negative anomalies for earlier in the century much larger. They, of course, don't show up on your map. But we could do the reverse, say, choosing 1900 to 1910 with equal legitimacy.
    0 0
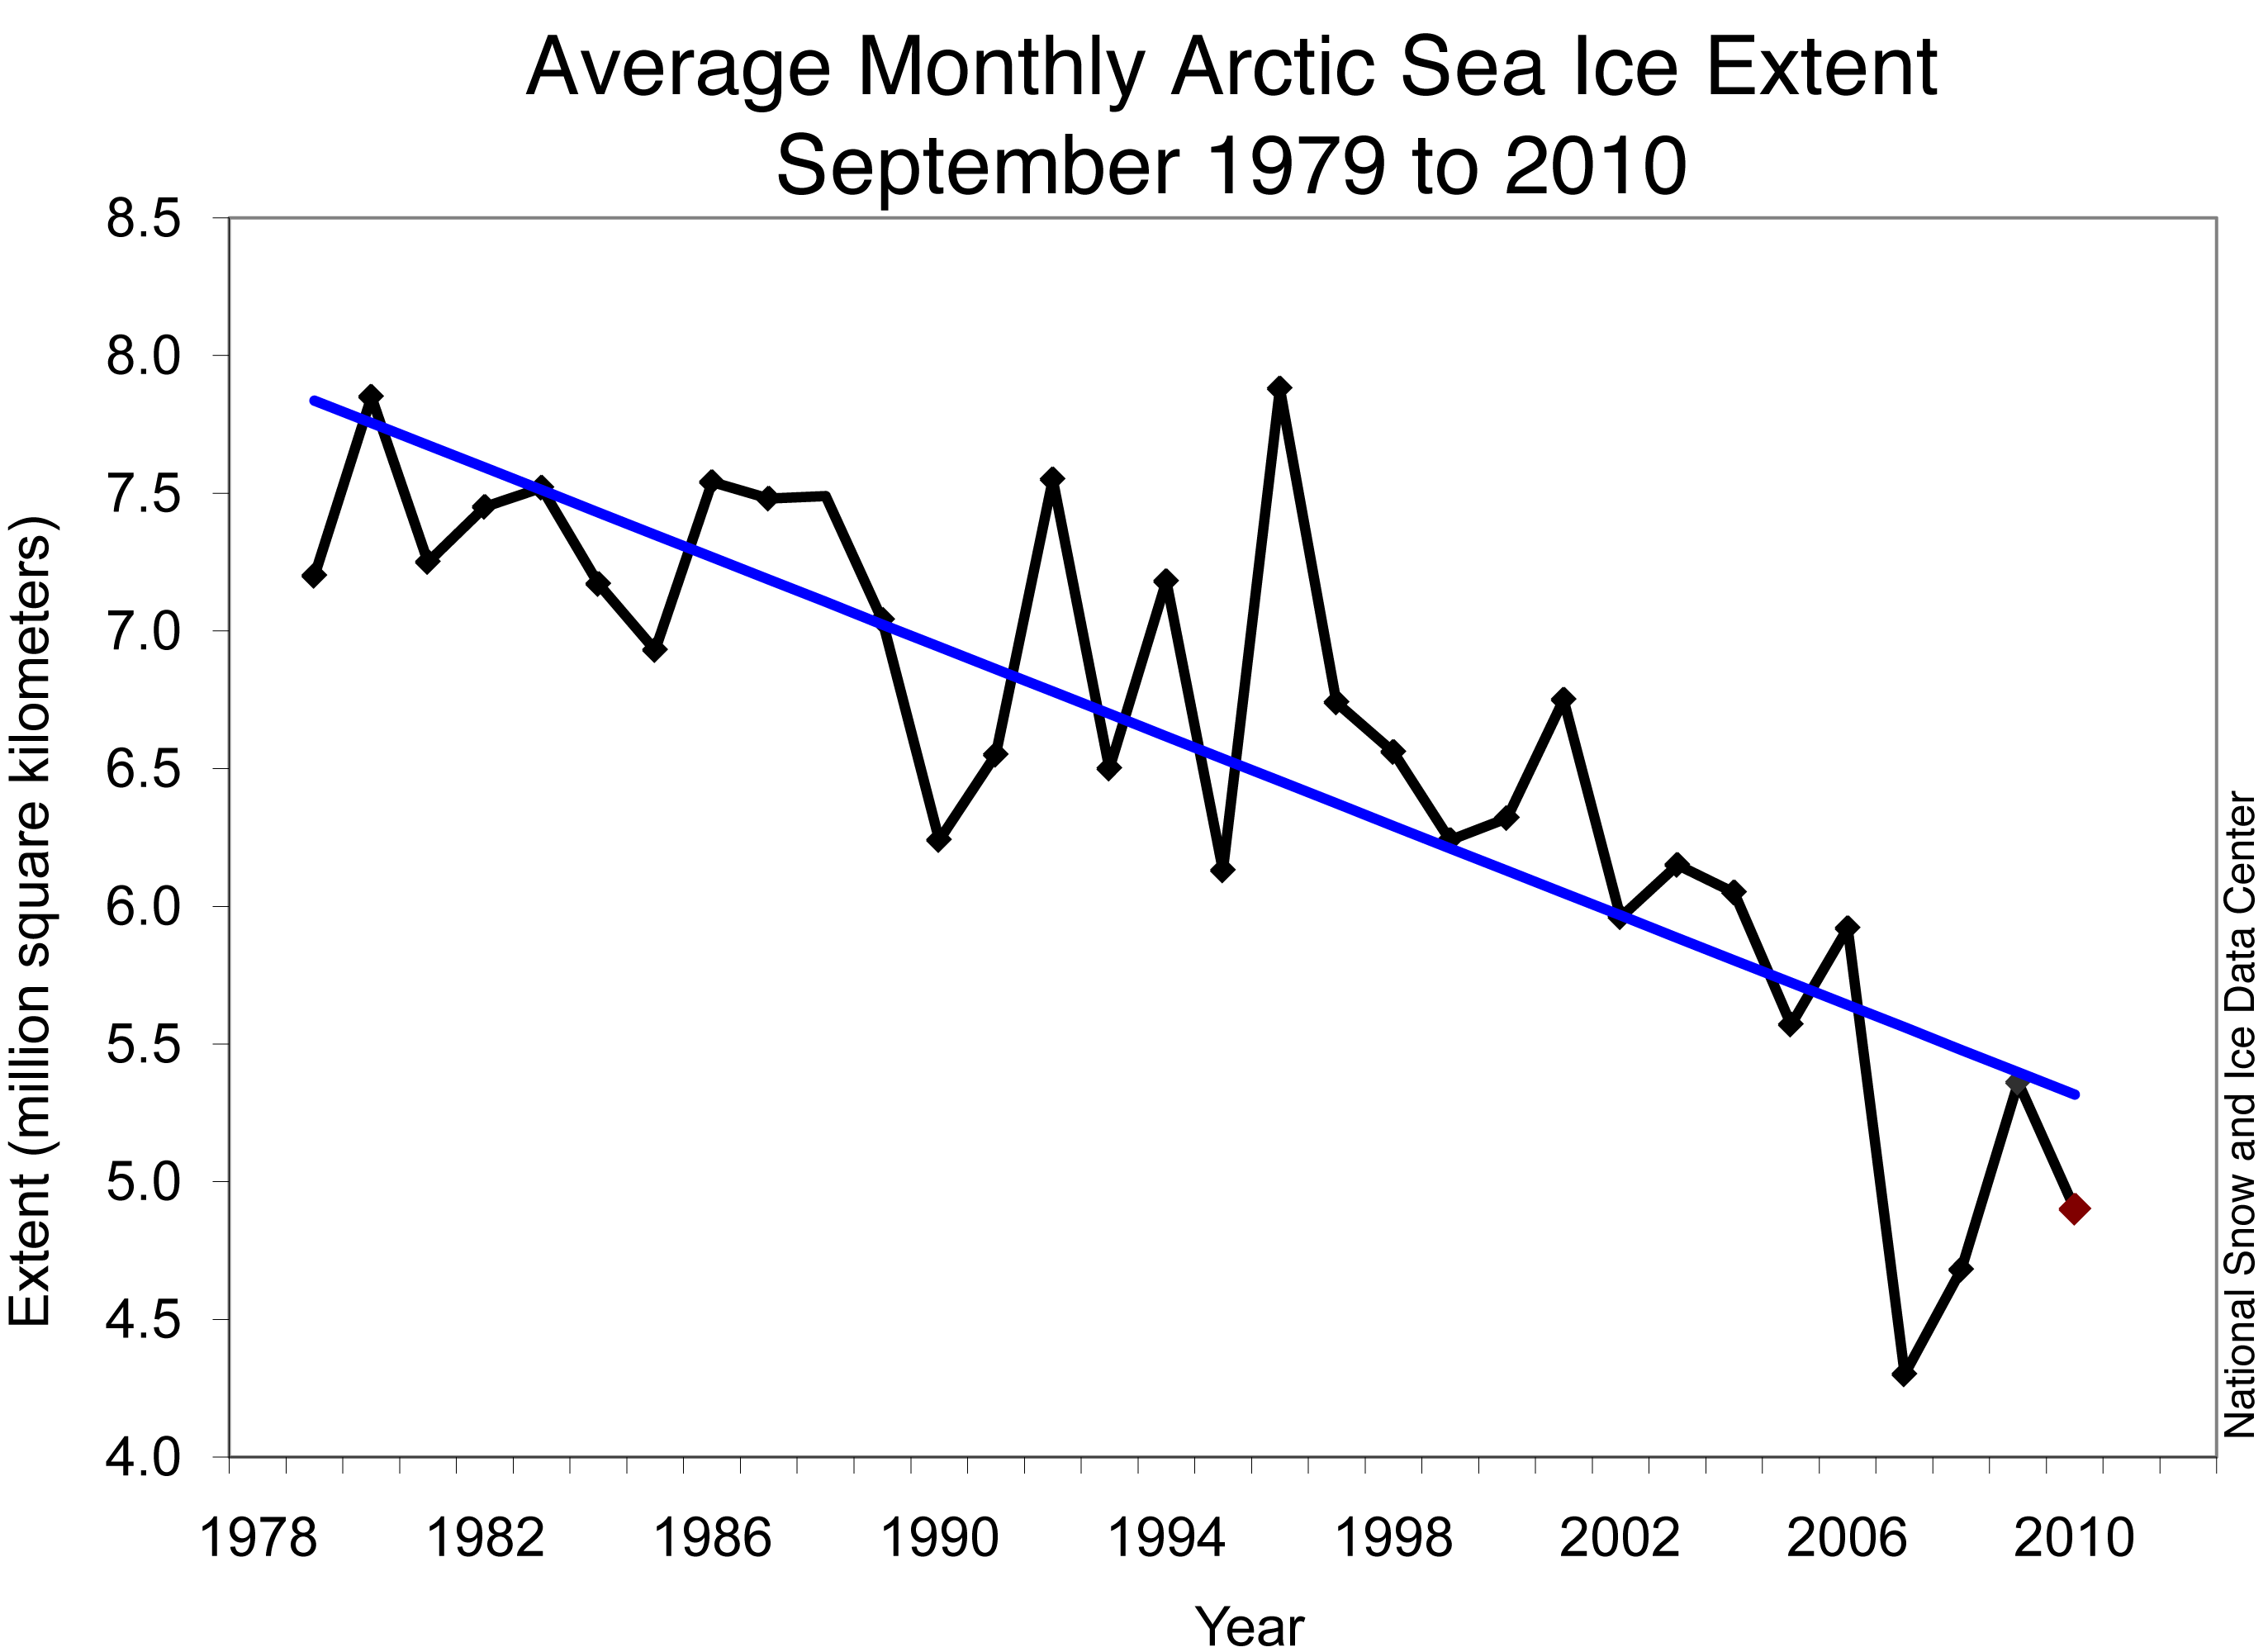
  4. RW1... "Then why was the summer minimum in 2008 over 16% larger than the record low the previous year in 2007" No one claims that the trend is going to be a steady decline. You get year to year noise in the data, as expected. If you look at the annual sea ice extent you'll notice that it only rebounded to the long term declining trend line.
    0 0
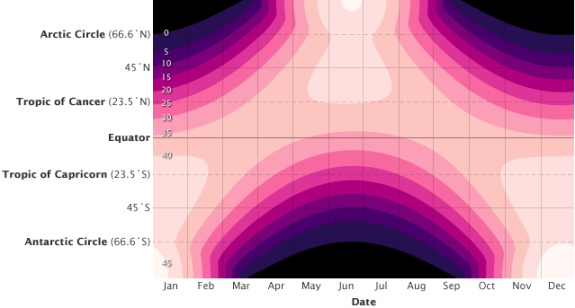
  5. RW1 @46: "Not really. There becomes less and less ice to melt, and you'll never melt it all because half of the year the Artic is dark and the ice grows back. Also, as more ice melts, you get closer and closer to North Pole, which means lower and lower insolation." 1) There will be less and less ice to melt, but as you point out, in winter that ice (and snow) comes back. Therefore the albedo can keep on decreasing as a result of earlier snow/ice melts and later snow falls and ice formation. 2) However you are simply wrong about the insolation at the North Pole. At the height of summer, insolation at the north pole is at least 37.5% greater than that at the equator, and remains so for at least a month: What is more, because of the structure of solar insolation, even the annual average is more or less constant above the arctic circle: So, what you are doing here is invoking speculations and errors of fact to refute empirical observations because in this instance you happen to prefer the model results. Your hoped for reduction of the effect will probably occur, but only once ice formation and snowfall are confined to those months and areas with no insolation, but by then the increased global warming due to the arctic sea ice albedo feedback will be an irreversible fact.
    0 0
  6. Tom, "However you are simply wrong about the insolation at the North Pole. At the height of summer, insolation at the north pole is at least 37.5% greater than that at the equator, and remains so for at least a month:" I meant lower average.
    0 0
  7. Tom (RE: 55) "There will be less and less ice to melt, but as you point out, in winter that ice (and snow) comes back. Therefore the albedo can keep on decreasing as a result of earlier snow/ice melts and later snow falls and ice formation." Then explain why the winter maximum doesn't seem to be any indication of what the summer minimum will be? For example, why was the winter maximum less in 2006 than in 2007 yet the summer minimum was greater in 2006 than it was in 2007?
    0 0
  8. RW1 @52: Seeing you are discussing ice melt, you should be discussing Ice Volume rather than Ice Extent: Large reductions in ice volume correlate very well with elevated arctic spring time temperatures, so temperature is the determinant of arctic ice melt. Wind strength and speed, along with the extent of multiyear (thick) ice are additional factors determining ice extent. Of course, no body has claimed that the greenhouse effect or the ice albedo feedback are the sole determinants of global temperatures, let alone regional temperatures, which can vary based on a large number of factors, the most important of which regionally is the direction of prevailing winds. So you can put that strawman firmly back in the basket.
    0 0
  9. Rob (RE: 54) "No one claims that the trend is going to be a steady decline. You get year to year noise in the data, as expected. If you look at the annual sea ice extent you'll notice that it only rebounded to the long term declining trend line." 30 years isn't a very long period of time. The Artic climate is notoriously variable. Consider this report from the US Weather Bureau: "THE ARCTIC OCEAN IS WARMING UP, ICEBERGS ARE GROWING SCARCER AND IN SOME PLACES THE SEALS ARE FINDING THE WATER TOO HOT. REPORTS ALL POINT TO A RADICAL CHANGE IN CLIMATE CONDITIONS AND HITHERTO UNHEARD-OF TEMPERATURES IN THE ARCTIC ZONE. EXPEDITIONS REPORT THAT SCARCELY ANY ICE HAS BEEN MET WITH AS FAR NORTH AS 81 DEGREES 29 MINUTES. GREAT MASSES OF ICE HAVE BEEN REPLACED BY MORAINES OF EARTH AND STONES, WHILE AT MANY POINTS WELL KNOWN GLACIERS HAVE ENTIRELY DISAPPEARED." The problem is this is from 1922!
    0 0
  10. RW1 @56, and you were wrong about the average as I clearly indicated. As the second graph shows, there is little variation in Top Of Atmosphere annual average insolation north of about 60 degrees latitude. Insolation at the surface is more complicated because of cloud cover, but as the third graph shows, there is again little variation over sea north of about 60 degrees, with an exception north of Europe. @57, you appear to confused about which side of the argument you are on. You are arguing that high winter snowfall and ice formation will limit the summer melt, and hence the Ice albedo effect. But now your want to use a lack of correlation between winter ice extent and summer ice extent as proof that ice albedo effect is irrelevant. In fact, the proof of its relevance is given in my immediately preceding post where I point out the correlation between minimum summer ice extent and springtime temperatures. For a large initial (springtime melt) to reliably reproduce large summer reductions in ice volume independent of the summer temperature suggests a strong feed back mechanism in which early ice melts drive later ice melts.
    0 0
  11. Nice try RW1 @59. Really, this silly argument that "it has happened before" is a ridiculous red herring used to confuse and mislead lay people. Of course scientists know very well that conditions warmed between 1910 and 1940-- no-one in the know is denying that. However, the rate of warming then not as great as in recent times. Also, that was a transient event, what we are in store is going to last much longer. Anyway, this has all been refuted before, b/c this Monckton Myth #12 that you floated has been soundly refuted here.
    0 0
  12. RW1 @59, what a revelation. Do you mean to say that in the summer of 1922 arctic sea ice had no more extent (ice free in some locations as far north as 81.5 degrees than it has in the winter of 2011: Well that certainly puts a whole new perspective on things!
    0 0
  13. Tom (RE: 60), "RW1 @56, and you were wrong about the average as I clearly indicated. As the second graph shows, there is little variation in Top Of Atmosphere annual average insolation north of about 60 degrees latitude. Insolation at the surface is more complicated because of cloud cover, but as the third graph shows, there is again little variation over sea north of about 60 degrees, with an exception north of Europe." Are you forgetting that the Earth is sphere and as you get closer and closer to the poles the angle increases, resulting in less and less insolation?
    0 0
  14. RW1: "a much larger confluence of factors are determining how much ice melts or doesn't melt?" Into all of the accumulated threads on Arctic ice melt here on SkS (there are quite a few), you play the 'confluence of factors' card? Can you be any more specific? Offer some peer-reviewed science to back you up? "30 years isn't a very long period of time. The Artic climate is notoriously variable." We've posted the longer term reconstructions of Arctic ice on prior threads. The trend of summer minima is down and accelerating. Ice-free summers ... not too far off. You can find the graphics with 'Search'. "SEALS ARE FINDING THE WATER TOO HOT" Please. Quoting a single weather report from 1922 says nothing at all about climate and trends.
    0 0
  15. Tom (RE: 62) "RW1 @59, what a revelation. Do you mean to say that in the summer of 1922 arctic sea ice had no more extent (ice free in some locations as far north as 81.5 degrees than it has in the winter of 2011:" I don't get it. At 81.5 degrees many locations were still iced over in the record low 2007 minimum, and all the areas at 81.5 degrees are iced over in the 2011 maximum you provide.
    0 0
  16. RW1 @63, no, but nor am I forgetting that the Earth is tilted on its axis, bringing much greater insolation to the poles in their respective summer season, both by increasing the angle of the incoming sunlight, and by increasing the length of the day. Nor am I forgetting that even at the equator, the sun spends half the time out of the sky (it's called night), and a quarter of the time at low angles (its called morning and evening). The net effect of this, as clearly indicated by the charts, is that insolation across the tropics is near constant regardless of latitude averaged over the year, and that insolation withing the arctic circle is near constant regardless of latitude averaged over the year; but that between the Tropic of Cancer and the Arctic circle, insolation changes significantly for relatively small changes in latitude.
    0 0
  17. Tom (RE: 60), "@57, you appear to confused about which side of the argument you are on. You are arguing that high winter snowfall and ice formation will limit the summer melt, and hence the Ice albedo effect. But now your want to use a lack of correlation between winter ice extent and summer ice extent as proof that ice albedo effect is irrelevant." No, I'm simply using the lack of a clear correlation between winter ice and summer ice as an indication that a larger confluence of factors are contributing, especially since 2006 and 2007 were not particularly warm years, for example.
    0 0
  18. Tom, "but nor am I forgetting that the Earth is tilted on its axis, bringing much greater insolation to the poles in their respective summer season, both by increasing the angle of the incoming sunlight, and by increasing the length of the day." Even in the summer there is less and less insolation the closer you get to the pole. This was my initial point.
    0 0
  19. muoncounter (RE: 64), "The trend of summer minima is down and accelerating." How can it be accelerating when the past 3 years have seen a larger summer minimum than the record low of 2007?
    0 0
  20. RW1 @68, Now you know very well, or should at least, that is is the long-term trends which count. And the minimum in 2010 was the third lowest on record, not the fourth. And that the best fit to the data in the above graph is a quadratic not a linear model.
    0 0
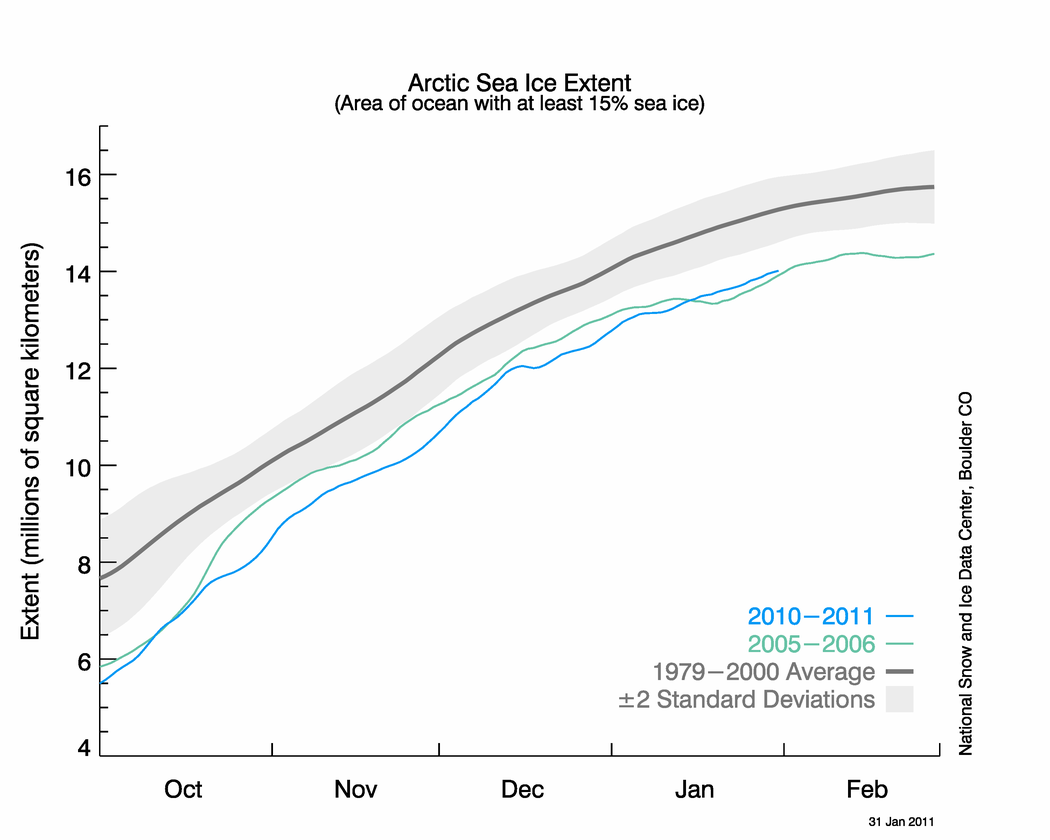
  21. Albatross, you beat me to it this time! RW1: I usually define 'accelerating' as describing the motion of an object where the first derivative and second derivative of position have the same sign; but we can just say 'speeding up'. -- both from Has Arctic sea ice returned to normal? Pay attention to trends, not a year or two. But if you insist, here's how this year stacks up: -- NSIDC sea ice news "Record low January extent" You'll note that this year is more than 2 std devs below the average and playing tag with 2005-06 (the prior record low extent). The annual max occurs in March. There are websites where they bet on such things.
    0 0
  22. RW1 @65: 1) Some, not many, locations were still iced over at the 2007 minimum at 81.5 degrees latitude, mostly between the Canadian islands where they are protected from the influx of warm water from the Atlantic and Pacific; protected also from wind breaking up the ice; and also have a limit on the Ice Albedo effect because of the more constant albedo of the nearby islands. 2) North of Spitsbergen there is one location ice free at 81.5 degrees north on the February 19th Ice Extent. (Not the maximum, and not claimed to be the maximum, but still a winter ice extent). 3) Your report says, "EXPEDITIONS REPORT THAT SCARCELY ANY ICE HAS BEEN MET WITH AS FAR NORTH AS 81 DEGREES 29 MINUTES." The phrase "as xxx yyy as" is always used to indicate the furthest extent of which something is true. So multiple expeditions (possibly 2, possibly 20, we don't know) found ice free water were they expected to find ice, and the furthest north of which this was true (ie, one sighting by one expedition) found ice free water at 81.5 degrees north. Which was also true yesterday, during winter. I suspect the furthest northerly extent free of sea ice in the summer of 1922 was also just north of Spitsburgen as well. After all, in 1599, ie, during the LIA the southern coast of Spitsburgen (about 77 degrees north) was also ice free.
    0 0
  23. Albatross, I'm not disputing that the documented period we have shows a downward trend, but 30 years is hardly enough data to show whether this is anything significant or just random noise of natural variability. Why hasn't the Antarctic shown the same trend? If anything, it's slightly increased over the same period.
    0 0
  24. First off the graphic in Figure 3 showing the albedo of water in the 8-9% seems a bit high. I'd put is at 3-7.5%. Albedo The Arctic Circle is a line above which there is continuous sun in summer and no sun in winter. Arctic Circle The high temperature anomaly in the Arctic this winter was not due to the greenhouse effect directly on the Arctic Ocean. It was due to heat being transported to the Arctic by global weather patterns. If you run the animation you see the transport of heat from as far south as the Sahara to the Arctic through a cluster of vortices that swirl around the arctic like giant hurricanes pulling warm air from southern climes and pushing cold air back down. Cold air can pour out of the Arctic into the more temperate areas such as caused the large snow events in the US and England. When this happens you get something like this: Anomalies It should be obvious that the warming of the Arctic is not due to the greenhouse effect taking place in the Arctic. There isn't any to speak all year round and especially in winter. You might say, "What about summer? Isn't there greenhouse effect due to the open water?" Not much because the albedo of the open water is so low that there is little long wave radiation or any other kind going up out of the water after the sun's rays hit it. All that energy is deposited deep in the water, CO2 or no CO2. So regardless of CO2, an ice free Arctic Ocean is going to contribute a lot to global warming during summer months. What was not addressed in the article is whether the polar regions are any less effective in radiating energy into space in the winter seasons regardless of the ice state.
    0 0
  25. Tom (RE: 72), We don't know - there aren't enough specifics. The point is it suggests a large degree of variability even nearly 90 years ago.
    0 0
  26. RW1: "30 years is hardly enough data" But in a prior comment, you take some significance in what you describe as 'the past three years'??? Sorry, your seal story does not suggest 'a large degree of variability' -- because 1 year is hardly enough data to do that.
    0 0
  27. RW1 @68, on the northern summer solstice, at the North Pole, the sun is approximately 23.5 degrees above the horizon, the equivalent to being at 4:30 PM in the tropics, and it remains at that elevation for 24 hours. On the same day at the arctic circle, the sun ranges in elevation from 0 to 47 degrees over the horizon over the course of the day. The result is that there is slightly more insolation at the pole than on the arctic circle. This can be seen in the first chart @55, although you will need to look closely to pick it out. So, whether you consider just summer insolation (as you now claim was your point) or annual average insolation (as you previously claimed was your point), you are simply wrong about this. Geometry is not very complex, but even its complexities appear to be to much for you in this discussion.
    0 0
  28. RW1: 30 years is hardly enough data to show whether this is anything significant or just random noise of natural variability. Then why do you keep trying to make something out of year to year anomalies? RW1: Why hasn't the Antarctic shown the same trend? The Antarctic ice cap is on a land mass with an average elevation 7500 ft surrounded by ocean. Conversely, the Arctic is surrounded by land masses and is sea ice at sea level. Why would you expect them to be following the same trend?
    0 0
  29. RW1 @75, I am happy to agree that we don't know all the specifics, which then begs the question as to why you presented the information. However, from what we do know from the information you presented, there is no reason to believe the summer 1922 ice extent was any greater than the February 19th ice extent in 2011. The information you are in fact looking for is this: (Sea Ice extent in Nordic Seas) Before you get too excited about all those low values, you should notice that 2002 is the last point on the graph, and and the second lowest point is 2001. So clearly 2007 and 2010 have fallen of the chart by comparison. You will also note that 1922 is only about average for post 1950 ice extents, and well above the recent figures. For comparison, here is equivalent data for other regions of the Arctic (for April). As you can see, the Nordic sea shows the greatest variability, so your case will not be improved by appealing to other regions.
    0 0
    Moderator Response: [DB] Fixed broken image URL.
  30. Sorry, the first chart did not come out. It can be found here.
    0 0
  31. RW1... Doing a little research on that "US Weather Bureau" report you posted at 59. It seems it's been making the rounds a lot on the internet and has gone through quite a bit of massaging. Here is the original article the report obviously comes from. Courtesy of Anthony Watts.
    0 0
  32. The seals finding the water too warm was a clue.
    0 0
  33. TOP @74, it is well known that the Arctic receives a lot of energy by transport from lower latitudes, and in fact most of it by that transport in Winter. It does not follow that the greenhouse effect is negligible in the Arctic, nor that changes in the greenhouse effect have no impact on Arctic temperatures. On the contrary, the variation in outgoing longwave radiation with latitude is much smaller than the variation in incoming solar radiation, the difference being made up by the heat transport you mention. (See note below.) Consequently the extent of the greenhouse effect is very important in determining arctic temperatures. An increase in the greenhouse effect will slow the escape of energy to space, thus raising temperatures. (Note, the graph determines intervals on the x axis based on area, thus generating a non linear scale in terms of latitude. If a linear scale for latitude had been used, the near constant insolation at higher latitudes would be apparent. Scaled linearly, for example, the interval between the last two northern values would span from the current 60 degree north mark to the first "i" in "deficit".)
    0 0
  34. Tom (RE: 77), "So, whether you consider just summer insolation (as you now claim was your point) or annual average insolation (as you previously claimed was your point), you are simply wrong about this. Geometry is not very complex, but even its complexities appear to be to much for you in this discussion." OK, for a period of about 2 and half weeks (roughly 2/3rd of one month) the poles are getting more insolation than the rest of the Artic circle? Is this what you're claiming? That is how I'm interpreting that first graph in your post 55.
    0 0
  35. Tom (RE: 77), Is that first chart in your post #55 insolation at the surface or the top of the atmosphere?
    0 0
  36. muoncounter (RE: 76), "But in a prior comment, you take some significance in what you describe as 'the past three years'??? Sorry, your seal story does not suggest 'a large degree of variability' -- because 1 year is hardly enough data to do that. Are you serious? I'm not the one claiming any significant trends, let let alone any trends outside the range of natural variability. The point of the 'story' is it's consistent with a large degree of Artic variability from year to year. That's all.
    0 0
  37. Rob Honeycutt (RE: 81) "Doing a little research on that "US Weather Bureau" report you posted at 59. It seems it's been making the rounds a lot on the internet and has gone through quite a bit of massaging. Here is the original article the report obviously comes from. Courtesy of Anthony Watts." I don't think those articles are the source of what I posted.
    0 0
  38. Tom, "However, from what we do know from the information you presented, there is no reason to believe the summer 1922 ice extent was any greater than the February 19th ice extent in 2011." If that's what you want to believe, fine. I disagree, but I can't really argue since there isn't enough information to constitute proof. I think the 'story' speaks for itself though.
    0 0
  39. Tom (RE: 77), Is that first chart in your post #55 insolation at the surface or the top of the atmosphere? In other words, does it factor in the decreasing angle as you get closer and closer to the pole, which spreads the incoming sunlight over a larger area, reducing it's magnitude at the surface?
    0 0
  40. RW1: "Are you serious?" Unfortunately, this situation is very serious indeed. So, yes, rest assured, I am serious about this issue. "I'm not the one claiming any significant trends," Then your prior post was purely facetious? "outside the range of natural variability." The 'range of natural variability' is depicted in the first hundred years of the first graph here. Is there anything other than this seal story, preferably in the form of a published scientific study, that substantiates this 'range' of yours? Oh, wait, there was more ice in the distant past. And less ice in the distant past. So I guess that proves your point?
    0 0
  41. Tom (RE: 77), You do understand that the average insolation hitting the top of the atmosphere is not the same as the average insolation hitting the surface (even assuming clear sky conditions), right?
    0 0
  42. "I think the 'story' speaks for itself though." This is what I love about these so-called "skeptics"-they stubbornly retain a "skeptic" stance, in the face of *mountains* of data & observations, yet said "skepticism" evaporates in the face of a *single* newspaper that relies solely on *anecdotal* evidence. Come on RW1, where's your skepticism now? That sounds more like *denial* where I'm from.
    0 0
  43. RW1..."I don't think those articles are the source of what I posted." According to Anthony Watts it is.
    0 0
  44. muoncounter, "Unfortunately, this situation is very serious indeed. So, yes, rest assured, I am serious about this issue." Sorry, I don't understand you then. I'm not claiming the past 3 years I referenced represents any indication of any coming trend or any trend at all for that matter. You claimed that the downward trend was 'accelerating'. I simply pointed out a contradiction to that claim. As far as the first graph in that post, I'm not familiar with the Walsh historic time series, nor what method was used to get the data, though I think I can safely assuming isn't anywhere near as accurate as satellite measurements.
    0 0
  45. Marcus, "This is what I love about these so-called "skeptics"-they stubbornly retain a "skeptic" stance, in the face of *mountains* of data & observations, yet said "skepticism" evaporates in the face of a *single* newspaper that relies solely on *anecdotal* evidence." The point of the story is it's simply consistent with large Artic variability nearly 90 years ago. However, it's hardly the basis for my skepticism.
    0 0
    Moderator Response: [DB] Fixed html tag.
  46. RW1 85 & 89, from this question it becomes evident that you are not even reading the points you are trying to rebut. To answer your question, they show TOA insolation. That means they do include the effect of angle of incidence on insolation, along with the effect of seasons. They do not include the effect of clouds. This is also true of the second graph @55. In contrast, the third graph @55 and the graph @83 show insolation at the surface, and hence include the average effect of clouds. They show between 10% and 20% variation between 60 degrees north and the poles, ie, the same degree of variation over 30 degrees that in mid-latitudes you would expect over ten. @88, you can believe what you want. However, I did not simply rebut your limited source of information. I looked up further information based upon multiple annual reports of sea ice extent, not just for one year, but for every year between 1750 and 2002. That information showed that 1922 had a low sea ice extent for its time, but only an average sea ice extent for the later half of the 20th century, and a higher sea ice extent than every year to date in the 21st Century. That you choose to ignore that information is very telling. @87, you have got to be kidding. The report Robb found contains every point yours made, and was printed in the fall of 1922, ie, after the minimum sea ice extent of 1922. You simply do not like the confirmation that it was only one ship, and at only one location that ice free water was found to 81.5 degrees north.
    0 0
  47. Rick G (RE: 78), "The Antarctic ice cap is on a land mass with an average elevation 7500 ft surrounded by ocean. Conversely, the Arctic is surrounded by land masses and is sea ice at sea level. Why would you expect them to be following the same trend?" I know. I'm mainly referring to the ice extent over the sea, which has not decreased and has even increased slightly, especially in recent years. If 'global warming' is causing the Artic sea ice to melt, why isn't it doing the same in the Antarctic?
    0 0
  48. RW1: "the past 3 years I referenced ... I simply pointed out a contradiction to that claim." Three years does not a contradiction make; there is always noise in these data. If 3 years of data is all you have to point to, I'd suggest finding another position on the issue. "I'm not familiar with the Walsh historic time series" Whether you accept the Walsh data or not is irrelevant, except that you're attempting to create the perfect block: 'There are only 30 years of satellite data. 30 years is not enough data. Repeat.' Look at the PIOMASS graph. Can you objectively describe those curves as anything but concave down? That would mean the rate of change of ice mass is accelerating in the negative direction.
    0 0
  49. RW1 @84. Yes, the pole is only shown to have more insolation than the arctic circle for about three weeks on that chart. But it is also shown to have at least the same insolation for 2 months as the the arctic circle receives for only a month and a half; and the same for over three months as the arctic circle recieves over the same interval. For three months of the year, the pole receives either as much or more insolation on any given day as any point on the arctic circle. Those three months are the period of maximum insolation, and also the time of minimum albedo. Over the rest of the year the a point on the periphery of the arctic circle recieves more insolation, but total daily insolation during that period is half or less what it is in summer.
    0 0
  50. Tom (RE: 96), "That means they do include the effect of angle of incidence on insolation," I don't think so. How would it account for this? Perhaps I'm wrong, but can you point me to a source that verifies this? I understand that they do not include the effect of clouds.
    0 0

Prev  1  2  3  4  5  Next

You need to be logged in to post a comment. Login via the left margin or if you're new, register here.


The Consensus Project Website

THE ESCALATOR

(free to republish)


© Copyright 2024 John Cook
Home | Translations | About Us | Privacy | Contact Us