Climate Science Glossary

Term Lookup

Enter a term in the search box to find its definition.

Settings

Use the controls in the far right panel to increase or decrease the number of terms automatically displayed (or to completely turn that feature off).

Term Lookup

Settings


All IPCC definitions taken from Climate Change 2007: The Physical Science Basis. Working Group I Contribution to the Fourth Assessment Report of the Intergovernmental Panel on Climate Change, Annex I, Glossary, pp. 941-954. Cambridge University Press.

Home Arguments Software Resources Comments The Consensus Project Translations About Support

Bluesky Facebook LinkedIn Mastodon MeWe

Twitter YouTube RSS Posts RSS Comments Email Subscribe


Climate's changed before
It's the sun
It's not bad
There is no consensus
It's cooling
Models are unreliable
Temp record is unreliable
Animals and plants can adapt
It hasn't warmed since 1998
Antarctica is gaining ice
View All Arguments...


Username
Password
New? Register here
Forgot your password?

Latest Posts

Archives

Climate time lag

Posted on 8 July 2009 by John Cook

The previous post on CO2/Temperature correlation sparked some interesting comments on climate time lag. Unfortunately, the discussion went pear shaped with some ideological anti-intellectualism and things got a little bitchy after that. Nevertheless, climate time lag is an important subject that deserves more attention. Several metaphors were invoked in an effort to explain the phenomenon including stove hot plates and warming baths. However, I find the best way to understand climate time lag is a direct look at the science.

Our climate receives its energy from the sun. The amount of energy the planet absorbs from the sun is calculated from this equation:

Incoming Energy Flux= πR2S(1-A)

R is the radius of the earth, S (the solar constant) is the energy flux from the sun and A is the Earth's albedo - around 30% of sunlight is reflected back to space. The earth also radiates energy into space. The amount of energy emitted is a function of its temperature:

Outgoing Energy Flux = 4πR2εσT4

σ is Boltzmann's constant, T is the absolute temperature in degrees Kelvin and ε is the average emissivity of the earth. Emissivity is a measure of how efficiently the earth radiates energy, between 0 and 1. A blackbody has an emissivity of 1. Greenhouse gases lower the earth's emissivity. When the climate is in equilibrium, energy in equals the energy out.

S(1-A) = 4εσT4

What happens if the sun warms (solar constant S increases) then maintains a sustained peak? This is what occured in the early 20th century when solar levels rose then plateaued at a hotter state in the 1950's. The radiative forcing from the warming sun is not particularly large - between 0.17 W/m2 (Wang 2005) to 0.23 W/m2 (Krivova 2007) since the Maunder Minimum. Nevertheless, let's assume for the sake of argument that there is some amplifying effect (perhaps the cosmic ray effect on clouds) so that the warming sun has a substantial effect on global temperature.

When the sun warms, initially more solar energy is coming in than is radiating back out. The earth accumulates heat and it's temperature rises. As the earth warms, the amount of energy radiating back out to space increases. Eventually, the energy out matches the incoming solar energy and the planet is in equilibrium again. The time lag is how long it takes climate to return to equilibrium.

How long does the climate take to return to equilibrium? The lag is a function of climate sensitivity. The more sensitive climate is, the longer the lag. Hansen 2005 estimates the climate lag time is between 25 to 50 years.

How would climate have responded to the solar levels maxing out in the 50's? For the next few decades after the 50's, the radiative imbalance would've gradually decreased until the climate reached radiative equilibrium around the late 80's (give or take a decade). So how has our planet's radiative imbalance evolved over the latter 20th century?
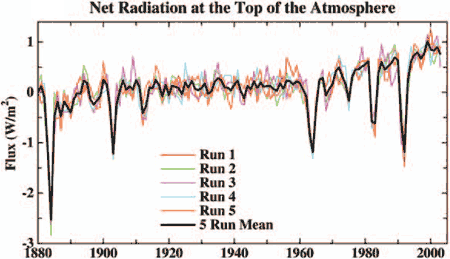

Figure 1: net radiation flux at the top of the atmosphere (Hansen 2005).

Hansen 2005 finds that the net radiative imbalance has steadily increased over the 20th century. There is no indication that the climate is heading towards equilibrium - quite the contrary. This is confirmed by satellite measurements of energy flux at the top of the atmosphere:
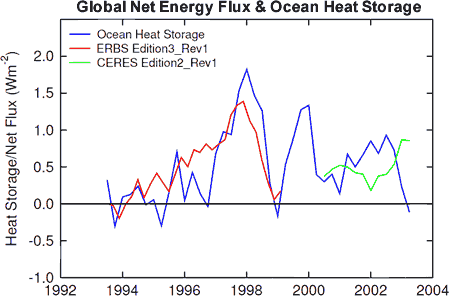

Figure 2: Global ocean heat storage (blue) against global net flux anomalies (Wong 2005).

The climate is not heading towards equilibrium. Rather, the radiative imbalance is increasing with the climate steadily receiving more energy than it is radiating back out into space. And this is where the true significance of climate time lag lies. Even if the radiative imbalance were to level off at its current rate of around 0.85W/m2, it would take several decades for the climate to return to radiative equilibrium. Based on this climate lag, Hansen 2005 calculates there is still 0.6°C warming still "in the pipeline".

0 0

Printable Version  |  Link to this page

Comments

Prev  1  2  3  4  5  6  7  8  Next

Comments 51 to 100 out of 388:

  1. Chris, Thank you for the additional detail on the Svensmark paper. "A rather fatal flaw with the cosmic ray flux (CRF) cloud/climate hypothesis is that the straightforward natural experiments in which the CRF varies by up to 20% through the 11 year solar cycle, or undergoes dramatic short lived reductions again up to around 20% in so-called Forbush events, shows no significant cloud response whatsoever….." I don't know why you keep making this statement, but it is inaccurate. From Sloan & Wolfendale 2008 "we estimate that less than 23%, at the 95% confidence level, of *the 11 year cycle change in the globally averaged cloud cover observed in solar cycle 22* is due to the change in the rate of ionization from the solar modulation of cosmic rays." http://www.iop.org/EJ/abstract/1748-9326/3/2/024001/ From the above, we can clearly see that there is an 11 year change in globally averaged cloud cover that (more or less) follows the solar cycle. To keep asserting the contrary is to ignore the evidence. Likewise, here is some evidence that cloud cover is affected by Forbush events Harrison R.G. & D.B. Stephenson, Proc. Roy. Soc. A, doi:10.1098/rspa.2005.1628, 2006 I think that you seem to be misunderstanding the state of the science here. "Shaviv and Svensmark don't publish this sort of stuff in the peer-reviewed scientic literature since you generally have to present scientifically and logically robust arguments with proper data, in science journals. Obviously one can say whatever one likes on one's website." While it is true that this particular response wasn't published, this leaves the impression that they can't publish their ideas. Both gentlemen's papers have been pretty widely cited, and while the overall theory is still debatable, the evidence for it is **substantially** better than you are attempting to present it as. That doesn't mean that it will turn out to be an accurate theory, but the idea that they cannot make logical arguments is not true. Thank you for the Erlykin paper, that is interesting stuff. BTW, how familiar are you with Krisjannson's paper, I can't figure out how he derived his conclusions. If you look at his actual graphs, they appear to give quite high correlation btw CRF and the cloud measurements, but he somehow comes to the conclusion that they are not closely correlated at all. Cheers, :)
    0 0
  2. re 47 Most of the ocean mass increase occurred in 2004/2005. What I said was let's assume that is real and not some artifact of JASON altimetry.
    0 0
  3. Do cloud affect climate? Without a doubt. The ISCCP-FD reconstruction shows decling cloud cover to 1998 and increasing cloud cover since. This can be seen on Professor Ole Humlum's website. A great source for up to date climate data. http://www.climate4you.com/ClimateAndClouds.htm In the climatically important equatorial zone. Both high and low cloud cover decreased to 1998 and have increased since then explaining some of the global heat trends - particularly the perplexing mystery of the lost heat since 1998. I also note an updated sea level graph on the ocean page graph showing a decline in annual sea level since 1998. And before anyone quibbles - check the ocean heat storage in Figure 2 above. Now I am confused - it is based on the (gold standard)University of Colorado data but looks entirely different because it averages the 10 day readings over a year. I am now wondering whether this has something to do with the hydrological cycle. A global increase in water vapour and rainfall - driven by higher sea surface temperature after the mid 1970's. A problem for Ron (lateron - for those unfamiliar with Australian colloquialism - Blind Freddy has offered to lead a seminar). Ah complexity - thy name is climate science. Is there a connection of cloud with the 11 year solar cycle? All I know is that clouds have changed and that there is a long term correlation of cosmogenic isotopes and global temperature. If clouds change back around 2024, I will be surer of a cloud cover and a cosmic connection to the Pacific Decadal Oscillation and multi-decadal ENSO modulation. I am pretty sure there are 50, 1500 and 100,000 year (approximately) climate cycles.
    0 0
  4. Actually, I was confused - the graph shows annual change in sea level and not mean sea level. It shows the rate of change declining declining since 1998 - there should be a law against people who torture data. Cheers Robbo
    0 0
  5. re #51 ONE: Solar cycle – cloud response There isn't a robust relationship between the solar cycle and cloud response. There was an apparent relationship within solar cycle 22 (which is what Wolfendale and Sloan were addressing), but this relationship completely breaks down in the following cycle, and the recalibration of the ISCCP data (partly in response to artefacts in the satellite viewing geometry over which there still seems to be some concern; e.g. [*]) makes this apparent correlation smaller still [**]. You can see the mismatch between the cloud data and the solar cycle over the full record by sampling the ISCCP data from its repository: http://isccp.giss.nasa.gov/index.html (see Part 7 for low, medium and high level clouds) The bit of the abstract you quoted from the Wolfendale Sloan paper doesn't mean that 23% of low level cloud – solar cycle relationship (which is only apparent for solar cycle 22 and has been recalibrated anyway!) is due to the CRF, nor that the clouds necessarily respond in a cyclical manner in response to the solar cycle. It just means that the statistical relationship between the solar trend through cycle 22 and the cloud trend through cycle 22 has less than 23% that could "belong" to any CRF component. The meaning is clearer if one quotes from the body of the paper:
    "From this it is deduced that less than 23% of the distribution, at the 95% confidence level, belongs to the part correlated with the CR modulation and more than 77% belongs to the other sources correlated to solar activity but not directly to the change in ionization rate. These limits are incompatible with a large part of the change in the LCC during solar cycle 22 being produced by a change in ionization and so they do not corroborate the hypothesis of such a change proposed in [1, 2]. The correlation seen in figures 1 and 2, if real, must be due to an effect, other than ionization, which is correlated with solar activity."
    TWO: Web site advocacy vs scientific literature I said:
    "Shaviv and Svensmark don't publish this sort of stuff in the peer-reviewed scientic literature since you generally have to present scientifically and logically robust arguments with proper data, in science journals. Obviously one can say whatever one likes on one's website."
    you said:
    "While it is true that this particular response wasn't published, this leaves the impression that they can't publish their ideas."
    You've misunderstood my point I think. This is that there is a huge disconnect between the fairly standard stuff these scientists publish in the scientific literature and the overblown advocacy that appears on their websites - these sites are certainly not designed as scientific information resources! They're highly misleading of the science in the area of solar contributions in general which has a rich and extensive scientific literature. That sort of misrepresentational advocacy isn't found in the scientific literature since the latter has processes that promote standards of scientific rigour ('though some rubbish gets through ocasionally!). So if one looks at the scientific papers of these scientists they're generally straightforward science without the dreary one-eyed advocacy that completely misrepresents the subject on their web sites. They certainly do publish their data/interpretations/ideas in the scientific literature. The J. Phys. Chem. paper of Svensmark's, for example, is a nice solid bit of physical chemistry. Their web sites are something else! That's the point I was making. Anyone resorting to the dreadful web pages under discussion will be hopelessly misinformed. THREE: Harrison and Stephenson (2007) Yes, it's possible there is a Forbush-diffuse fraction response in their data. It's not that convincing. There seems to be a strong drop in the DF 10 days before the Furbush event in both data sets and in the Jersey data, this is the strongest drop in the record which might lend one to consider whether the analysis is robust in terms of a CRF diffuse fraction coincidence… It's telling that in the Hadley Centre technical report #62 (HCTN 62) "The influence of solar changes on the earth's climate" of which Harrison is one of the three authors, the possibility of a CRF – cloud link (specifically: "Solar modulation of global clouds, through production of CNN from cosmic ray ionisation") is descibed as being "Contentious", in their categorization of probabilities of various elements of the possible solar – climate relationships. That seems a pretty succinct summing up. http://www.metoffice.gov.uk/publications/HCTN/index.html FOUR: General point. I'm pretty relaxed about whether there is a CRF-cloud link (quite possibly yes) and a CRF-temperature link (evidence suggests this is unlikely to be significant). Unfortunately the pretty straightforward data in the scientific literature is being grossly misrepresented by a tiny number of advocates to massively overplay the significance of the evidence as it stands in the scientific literature. It's pretty obvious that there can have been no significant contribution of any CRF change to the very large warming of the last 30-odd years since there has been essentially no secular trend in this metric during the period since 1958 (if anything a slight cooling contribution). It's difficult to escape that non-correlation….. ------------------------------------------------------ [*] A. T. Evan et al (2007) Arguments against a physical long-term trend in global ISCCP cloud amounts Geophys. Res. Lett. 34, L04701 abstract: The International Satellite Cloud Climatology Project (ISCCP) multi-decadal record of cloudiness exhibits a well-known global decrease in cloud amounts. This downward trend has recently been used to suggest widespread increases in surface solar heating, decreases in planetary albedo, and deficiencies in global climate models. Here we show that trends observed in the ISCCP data are satellite viewing geometry artifacts and are not related to physical changes in the atmosphere. Our results suggest that in its current form, the ISCCP data may not be appropriate for certain long-term global studies, especially those focused on trends.” [**] E. Pallé et al (2009) Interannual variations in Earth's reflectance 1999–2007 J. Geophys. Res. 114, D00D03 Abstract: The overall reflectance of sunlight from Earth is a fundamental parameter for climate studies. Recently, measurements of earthshine were used to find large decadal variability in Earth's reflectance of sunlight. However, the results did not seem consistent with contemporaneous independent albedo measurements from the low Earth orbit satellite, Clouds and the Earth's Radiant Energy System (CERES), which showed a weak, opposing trend. Now more data for both are available, all sets have been either reanalyzed (earthshine) or recalibrated (CERES), and they present consistent results. Albedo data are also available from the recently released International Satellite Cloud Climatology Project flux data (FD) product. Earthshine and FD analyses show contemporaneous and climatologically significant increases in the Earth's reflectance from the outset of our earthshine measurements beginning in late 1998 roughly until mid-2000. After that and to date, all three show a roughly constant terrestrial albedo, except for the FD data in the most recent years. Using satellite cloud data and Earth reflectance models, we also show that the decadal-scale changes in Earth's reflectance measured by earthshine are reliable and are caused by changes in the properties of clouds rather than any spurious signal, such as changes in the Sun-Earth-Moon geometry.
    0 0
  6. Loads of thanks! I've been trying to understand the warming in the pipeline for some time without success. Thanks to this article I think I get the picture. It also helps me to understand the "simple model" article at RC (http://www.realclimate.org/index.php/archives/2007/04/learning-from-a-simple-model/). Thanks a lot!!!
    0 0
  7. Chris, #1. According to the following preprint by Erlykin, SLoane & Wolfendale, there is a correlation btw the solar cycle and CC. They propose a different mechanism than cosmic rays to account for it. "We advocate a scenario for the ***origin of correlations between CR and LCC***, based on the parallel influence of solar activity. The solar irradiance rises with the sunspot number in the middle of the solar cycle. The radiation is strongest in the tropics and subtropics. Though the relative rise of the irradiance is small, and only about 0.1%, it causes a rise of the mean surface temperature and an increase of the vertical convection flows of the heated air. The subsequent change in supersaturation of the air at different heights can cause the changes in LCC and MCC. Warm air from below 3 km rising to greater heights will cause the LCC to fall and MCC to rise. By this way the rise of convection flows leads to a **considerable magnification (to ∼2%) of the effect of enhanced solar irradiance**. Formulating briefly, one can say that in the maxima of the solar cycles the updraft becomes stronger and this effect is strongest in the tropics and subtropics, as well as in the southern latitude bands where there is the largest fraction of area covered by the oceans. It is well known that the variations of solar activity are followed by the variations of CR intensity at Earth; the reduction of CR intensity coincident with the reduction of LCC is therefore by no means evidence of the causal connection between these two phenomena - they correlate with each other due to their common origin - the change of solar irradiance at the Earth." ON THE CORRELATION BETWEEN COSMIC RAY INTENSITY AND CLOUD COVER 1 A.D.Erlykin(1,2), G.Gyalai(3), K.Kudela(3), T.Sloan(4), A.W.Wolfendale(2) pre-print #2. I don't really dispute the issue that CRF variations have had relatively minimal impact on the warming from say 1970-2000. It is pretty clear that the two major portions of them were most likely anthropogenic changes and the PDO(in no particular order). #3. IMO, any discussion of CRF-cloudiness link that ignores the strong long-term correlations is ignoring the evidence(for instance see above). IMO, the best evidence on CRF shows that there is a nonlinear interaction of some sort btw climate and CRF such that high CRF periods are correlated with cool climates. Smaller, shorted term changes in CRF (like recent ones) seem to have much less impact than the long term studies would suggest. #4. Just because you disagree with Svensmark and Shaviv doesn't mean that they don't make logical arguments(even on their blogs). The fact is, we don't have enough information to answer the CRF question definitively. We can't really tell yet what impact (if any) CRF changes have on clouds. Cheers, :)
    0 0
  8. shawnet, yes, O.K., but the preprint you've described is another example of evidence in the scientific literature (to be!) of a lack of significant causal relationship between the cosmic ray flux (CRF) variation and cloud/temperature variation. I'm happy that you're directing our attention to the science rather than the dreadful website you linked to earlier on this thread. We can look at the preprint in more detail... downloadable from here: http://arxiv.org/abs/0906.4442 [A.D.Erlykin, G.Gyalai, K.Kudela, T.Sloan, A.W.Wolfendale On the correlation between cosmic ray intensity and cloud cover] The following points can be made: 1.There isn't a robust correlation between the solar cycle and the ISCCP cloud data. That can be confirmed by inspection of the ISCCP data I linked to above (see post #55). There is a correlation between the solar cycle and low level clouds through cycle 22, after which this correlation breaks down. Erlykin describe a moderate correlation coefficient (0.54) between solar cycle and low clouds through cycle 22 but this is only 0.24 through cycle 23 which is an very low correlation. Erlykin present data up to 2005. If this is extended to 2008 (see ISCCP web site link in post #55), the correlation is even worse. 2. Erlykin address "the correlation between cosmic ray intensity and cloud cover". The conclusion is that this correlation is moderate in cycle 22, but effectively discorrelated in solar cycle 23. In all cases any correlation is shown not to be causal. In other words (according to Erlykin), any apparent correlation is not the result of a CRF effect on clouds but is (if the correlation is true) due to the solar irradiance changes through the solar cycle. e.g. Erlykin et al conclude:
    "the reduction of CR intensity coincident with the reduction of LCC is therefore by no means evidence of the causal connection between these two phenomena – they correlate with each other due to their common origin - the change of solar irradiance at the Earth."
    and
    "We argue that the positive correlation of CR and LCC found in Svensmark and Friis-Christensen, (1997) and Palle Bago and Butler, (2000) is not evidence for a causal connection between them, but the consequence of a parallel influence of the common source - the solar activity on CR from one side and CC the other."
    3. Erlykin make a number of analyses of the possible causal contribution of CRF on low level cloud cover during solar cycle 22 (where there is a bit of a correlation with the solar cycle). Within a model where CRF are responsible for a fraction of the low level cloud change and CRF is the only cause of this fraction (the Shaviv model; Svensmark might or might not agree) they can determine a value of the fraction of low level clouds caused by changes in CRF. This is close to zero:
    "This shows that the most likely fraction of LCC (low cloud cover) connected with CR (cosmic rays), which can be derived from expression (3), does not exceed 2% around X = 1."
    and so on…the data and analyses taken at fasce value strongly support the conclusion that clouds, whether low level or whatever, do not respond signifcantly to changes in the CRF, and any apparent corelations observed (in solar cycle 22) are not causal. The likely source of any apparent correlations is the efects of solar irradiance changes on atmospheric and surface temperature. That seems entirely consistent with a vast amount of other science in the scientific literature. 4. General point: You suggest that "Just because you disagree with Svensmark and Shaviv doesn't mean that they don't make logical arguments (even on their blogs)." But again that misses the point. I don't particularly disagree with what Shaviv and Svensmark say in their peer-reviewed scientific publications.. I disagree with the misrepresentational advocacy and false arguments on their websites (and Svensmark dismal book for that matter). I gave a couple of examples in relation to the Shaviv web site you urled (see my post #50)…the Svensmark web report I urled in post #50 is dripping with false "arguments". That's what I disagree with shawnet – rubbish on dodgy websites created to misrepresent the science. 5. Another general point. There's lots of evidence of solar contributions to changes in climate in the past. It so happens that there has been little secular change in the solar outputs since 1958 (when these parameters started to me assessed in great detail), and the very marked warming of the past 30-odd years almost certainly has a negligible contribution from solar changes (despite the unsupported assertions on the dreary website you linked to in an earlier post). The solar contributions to climate changes in the past can generally be understood in relation to solar irradiance changes. Since the CRF changes generally correlate strongly with the solar irradiance changes (outwith Forbush events and the like), it’s easy for scurrilous "arguments" for solar irradiance chamges to be interpreted in terms of CRF changes (Svensmark does this on his website I urled).
    0 0
  9. G'day, The PDO certainly has a correlation with global surface temperature. A cool mode to 1975 and a warm mode to 1998. The biological and physical chemical indications are that the PDO switched to a cool mode post 1999. The parallel with surface temperature is unmistakable. Although, I think it is a mistake to assume that the PDO is a cause of climate change rather than a co-variant. The PDO is associated with decadal modulation of ENSO. More intense and frequent El Niño in a warm mode and more intense and frequent La Niña in a cool mode. This suggests one mechanism for planetary warming and cooling. There are a couple of questions. Is the PDO real? It is certainly clearly evident in the sea surface temperature record in the latter half of last century. Before that – the available data all has wide margins of error. I think the most compelling argument for a natural origin is that is does seem to have conclusively switched to a cool mode. The cause of the PDO is deeply uncertain. The physical systems involved suggest that increases and decreases in shortwave radiation hitting the ocean surface heating could be the underlying cause if this varies on multi-decadal timescales. The ISCCP cloud cover record suggests that this is a possibility – although the period of record (and perhaps uncertainties in the data) are insufficient to be anywhere near conclusive. The periodicity of the PDO is certainly not explained by the 11 year solar cycle. The 22 year polar reversal cycle a more likely candidate. See this 1995 paper for an explanation. The 22 year cycle gives 11 years of peak magnetic activity and 11 years of subdued magnetic activity. Could this interact with the physical systems of the planet to produce changes with a 25 year harmonic? Interesting speculation. http://dawn.ucla.edu/personnel/russell/papers/731/731index.htm The heliospheric magnetic variation may be more important or the solar modulation parameter of Usoskin. These certainly did not peak in 1960 along with sunspot number. This all remains speculative and arguments about the non correlation of a particular metric misses the point. If the theory doesn’t fit the data – the theory needs revision. The current global warming debate finds certainty where there is precious little to be had. We talk about 50 years or less of reasonably accurate data on a few metric as if that could provide proof in such a complex system. We talk about reconstructions going back millions of years as if there is a precision in the results sufficient to mirror the precision of instrumental results. We have forgotten all of our ‘science of science’ and instead it is in the hands of advocates.
    0 0
  10. Chris, I don't really feel there is much to add here, Erlykin et al. agree that there is a correlation with the solar cycle and even provide a mechanism for what might be causing this. This is not something people typically do when they feel that the correlation is non-existent (which is what you were originally arguing). The ISCCP's recent data is somewhat controversial in this context, as I'm sure you know. As I already mentioned above, the issue about CRF-clouds is still in doubt. I know the Erlykin et al. paper disputes such a connection, but there are others that support it. http://rspa.royalsocietypublishing.org/content/464/2098/2575.abstract You seem to think that the papers that you agree with are the final word on the matter. "4. General point: You suggest that "Just because you disagree with Svensmark and Shaviv doesn't mean that they don't make logical arguments (even on their blogs)." But again that misses the point. I don't particularly disagree with what Shaviv and Svensmark say in their peer-reviewed scientific publications.. I disagree with the misrepresentational advocacy and false arguments on their websites (and Svensmark dismal book for that matter). I gave a couple of examples in relation to the Shaviv web site you urled (see my post #50)…the Svensmark web report I urled in post #50 is dripping with false "arguments". That's what I disagree with shawnet – rubbish on dodgy websites created to misrepresent the science." The fact is that you claimed that the arguments were illogical when they aren't, you just don't agree with them. The fact that you don't agree with them doesn't make them rubbish or whatever. "5. Another general point. There's lots of evidence of solar contributions to changes in climate in the past. It so happens that there has been little secular change in the solar outputs since 1958 (when these parameters started to me assessed in great detail), and the very marked warming of the past 30-odd years almost certainly has a negligible contribution from solar changes (despite the unsupported assertions on the dreary website you linked to in an earlier post). The solar contributions to climate changes in the past can generally be understood in relation to solar irradiance changes. Since the CRF changes generally correlate strongly with the solar irradiance changes (outwith Forbush events and the like), it’s easy for scurrilous "arguments" for solar irradiance chamges to be interpreted in terms of CRF changes (Svensmark does this on his website I urled)." The fact is, that CRF does not change in lockstep with solar irradiance(in fact solar irradiance doesn't change that much at all). Thus, when climate events follow changes in the CRF as they seem to have done historically that is good evidence of a CRF influence on climate. Given that such a relationship exists over the long term, it is logical to use that to inform our interpretation of short term events. No one said clouds had to be simple to understand. BTW, I'm not sure if you saw this above, but I am curious about the interpretation of the Krisjannson paper you referenced earlier. As I believe I said previously, Krisjannson found what appear to me to be some pretty good correlations btw CRF and CC, but concluded that there was no such correlation. Cheers, :)
    0 0
  11. I guess all of this stuff on CRF and the like is what some people might think is the sophisticated end of the denialism spectrum. But there is nothing sophisticated about it. No one has ever imagined that the climate didn't change in the past, nor that there are other inputs into global warming apart from greenhouse gases, nor that the climate hasn't exhibited fluctuations over the past 150 years, or even the last 30 years, as a result of some of those inputs. But to be rabbiting on, at such length, about these minor matters, while the great big CO2 elephant in the room keeps trumpeting for attention, is a sign of the same old denialism that is based on an unshakeable ideology that either (or both), humans can't affect a god-given home; or unfettered capitalism based on an ever increasing dependence on burning fossil fuels is the only way to conduct human affairs.
    0 0
  12. This is just breaking – it appears that the underlying rate of warming between 1950 and 1997 was 0.1 degrees per decade. I would of (and have) used 1945 and 1998 – and get 0.08 degrees centigrade per decade. http://www.uwm.edu/~kswanson/publications/2008GL037022_all.pdf http://www.realclimate.org/index.php/archives/2009/07/warminginterrupted-much-ado-about-natural-variability/ Read carefully because Swanson supplies all necessary pre-digested rationalisations for global warmists. Although it is not new or startling science it is capitulation to the bleeding obvious. http://rogerpielkejr.blogspot.com/2009/07/two-decades-of-no-warming-consistent.html I am content to leave open the question of whether this is a longer term trend. The point is that 0.8 degrees per decade (and declining sensitivity to greenhouse gases) is not sufficient to warrant restricting the economic aspirations of billions of people. RealClimate states that this is not global cooling (at least not following the next decade or so) but natural variation - due to globally synchoised sea surface temperature changes triggering climte shifts over 20 to 30 years - on a warming trend. Has anyone argued that we can keep increasing carbon dioxide emissions. Certainly people like Bjorn Lomberg argue for an economically and technologically rational transition that doesn’t put millions of lives in the developing world at risk. And yes – stable democracy and a minimally regulated capitalism is the only way billions of people will emerge from poverty this century – although this would be more a policy than a science thread. So David, stop putting words in my mouth. If it is a contest between God and capitalism and aetheism and socialism - I am on the side of the angels.
    0 0
  13. damn it - I meant 0.08 degrees per decade
    0 0
  14. Robbo says "declining sensitivity to greenhouse gases" That implies that climate sensitivity is selective and variable, quite an interesting concept. References?
    0 0
  15. One need to be carefull before coming to conclusions from linear trends. Indeed, the choice of the time interval is not neutral and can not be chosen arbitrarly. Also, the natural variability needs to be taken into account. Luckly there are statistical criteria to be met. As for the first issue (the time interval) you need to look at the residuals and no trend must be present. You can also look at autocorrelation and be sure it is minimal. This criterion excludes both '50-'97 and '45-'98 intervals. This does not mean you can't use them but you cannot draw robust conclusions, just a rough average trend. Using GISS data and trying to go as far back in time as possible, I found the interval 1970-2008 consistenly linear with a trend of 0.165 +/- 0.014 °C/decade. As for variability, you need to calculate the standard deviation of the residuals and use the standard 2*sigma criterion (equivalent to the 95% confidence level). Doing this will make apparent that nothing has changed up to now (2008), all the data points are within the +/- 2*sigma interval. Also, the last decade is nowhere near an anomalous deviation from the trend. Before claiming that we are in period of cooling or even flat temperatures we need to wait until the anomaly drops consistenly outside the statistical significance range. Using the same data and range as before I found a natural variability (2*sigma criterion) of about +/- 0.2 °C. It's worth to notice that even using smaller intervals down to the last decade sigma remains unchanged and again all the points are within +/-2*sigma, including those commonly considered extremes.
    0 0
  16. Philippe, This is simply a fundamental concept of atmospheric physics. Greenhouse gases are transparent to shortwave radiation and opaque to specific bands of infrared radiation depending on the gas. As there are already gases in the atmosphere - some of the radiation is already blocked. More gas doesn't linearly decrease transparency of the atmosphere to IR - rather the transparency exponentially declines with each additional molecule. Once the IR window is closed - no amount of addtional greenhouse gas will trap more IR - but we are not there yet. In fact, I once calculated what would happen to global temps if the IR window was closed completely (it's an engineering thing) - and I don't think we want to go there. It is why there is a quasi linear response to an exponential increase in greenhouse gases. Yes - climate does respond to anthropogeninc greenhouse gases - I'm just not sure what it is. The upper limit appears to be the trend between 1946 to 1998 rather than 1976 to 1998. This makes a difference between - oh hell - we are all going to die and we have some time for human technological capacity to make a difference. Instead we have all these people - including the UN - who are wildly exaggerating the threat - and they admit to that all the time - and saying they can solve the problem with more taxes and bigger government. Excuse me for being hyper skeptical. Trust me - I'm a scientist/engineer. No don't do that - look it up on Wikepedia. Cheers Robbo
    0 0
  17. Riccardo. You are torturing the data - up against the wall MF! Cheers Robbo
    0 0
  18. re61 David Horton "But to be rabbiting on, at such length, about these minor matters, while the great big CO2 elephant in the room keeps trumpeting for attention, is a sign of the same old denialism that is based on an unshakeable ideology that either (or both), humans can't affect a god-given home; or unfettered capitalism based on an ever increasing dependence on burning fossil fuels is the only way to conduct human affairs" You left one important, strong human ideological tendancy out. Socialist-determinism, the worst historical distorter of data on record. (eg eugenics, communism, race-based Nazism). I think some communist propaganda posters depict capitalism as a big elephant, but I don't know what they would have made of human-induced global warming... It is amazing, that just like Karl Marx, you just cant see the weaknesses and common disortions in your own side of the argument. (eg 1. Karl Marx was so blind he scoffed at the idea that factory managers would be tempted to distort/exploit the new 'economic system', not to mention the 'radical intellectuals' themselves- just like you seem to have trouble doing...) (eg 2. check out Pipes of Harvard Uni's book on Communism-who claims that communism was largely founded by radical intellectuals-just like the human induced C02 warming agenda)
    0 0
  19. What you said suggested that the climate was selectively reacting to different radiative forcings. AFAIK, there is nothing in the scientific litterature that could support that. A radiative forcing is a radiative forcing. Otherwise pointers would be appreciated. It also suggested that the response to a given forcing could vary, which would require much more elaboration (your post #66 vaguely describes how the forcing could vary, not the response). Perhaps it was just the wording leading me to interpret that way. However, I see nothing in your post #66 that I was not already aware of, nor anything that could definitely clarify your statement in #62. In my opinion, Riccardo is not torturing the data at all, he is using normal rules of statistical analysis. These rules apply for data in general, why would they not apply to temp. time series? Not paying attention to the residuals, autocorrelation, standard deviations would really be torturing the data. As for not trusting you, I see a number of reasons for that. You referred to blog postings by Spencer, who has clearly not a clue of what he does with his own maths on occasions. Spencer who has gone off the deep end with the CO2 cycle theories that he puts on the intertubes (but refrains to put up for peer-review). Those even scared "skeptics" on WUWT, a blog where it is considered acceptable to ponder whether or not Antarctica is cold enough to make atmospheric CO2 snow out of the air (seriously, they had a post on that, many thought it was plausible). That even these bozos would say Spencer should shut up on the CO2 cycle is telling, methinks. Also you cite that ridiculous (for a lack of a stronger word) EPA suppression story, which is such an empty pile of nonsense it's not worth discussing at all. Your insistence on cherry picking 1998 is no more reassuring. Thanks for the advice, but really, I'm safe. I'm not about to trust the Yobbo from the blog (albeit a better one) on any scientific matter. Nothing personal, I wouldn't really trust anyone else either. I form my own opinion.
    0 0
  20. "You left one important, strong human ideological tendancy out." Nothing says Strong Science quite like inferring that your adversaries are communists. Heckofa rebuttal. Well played.
    0 0
  21. Re #60, Shawnet Yes I suspect that this discussion has reached the end of the road. I'm going to summarize the conclusions as I see them. 1. While we've been discussing minutae of the solar/cloud/climate response the obvious thing that I think we agree on is that there has been no significant secular trend in the cosmic ray flux (CRF) since detailed measures began in 1958. So the very large global scale warming of the last 30-odd years has nothing to do with the CRF. It's worth re-emphasising this. After all on the blog page you referred us to, Shaviv asserts without evidence that cosmic rays "…does however explain most of the solar-climate link and a large fraction (perhaps 2/3's of the temperature increase over the 20th century)." Each of those sub-statements is a misrepresentation of scientific knowledge on these subjects (role of CRF in solar-climate link; role of CRF in 20th century temperature increase), as is readily apparent by looking at thr science, and it's worth being clear about the difference between what some people assert on blogs and what a dispassionate assessment of the scientific literature "says". 2. There's now substantial published analysis of CRF-solar cycle-cloud relationships. Early studies indicated a correlation between the CRF and the low cloud cover (LCC) component of the International Satellite Cloud Climatology Project (ISCCP) infra-red (IR) product during 1983 through 1994 (solar cycle 22) [Marsh and Svensmark, 2000]. Kristjánsson et al. (2002) extended the analysis through 2000, and showed that the correlation becomes poor after 1993. They also showed (i) that the correlation with the more reliable[*] ISCCP-IR/vis product was considerably poorer still, and (ii) that rather than correlating with the CRF, the correlation with the solar cycle seemed to match the irradiance changes rather than the CRF changes. This disconnect between CRF variation and LCC has become more apparent as time has progressed. 3. Svensmark and Shaviv have pretty much withdrawn from scientific analysis of these direct CRF-cloud relationships, advocating for their hypothesis from web blogs and web reports, while persuing other subjects (admirable basic physics of CRF effects on aerosol micro-nucleation; stellar winds and such like). In the meantime the ISCCP data has been extended to 2008, and two groups in particular have attempted to pull out the intricacies of any CRF-cloud/solar cycle-cloud relationships. 4. Each of these groups (Wolfendale/Sloan and Kristjánsson) have published several detailed analyses of possible solar cycle-CRF-cloud relationships (see references below), and have independently come to a similar conclusion. This is that any apparent correlation observed between the solar cycle and LCC changes arises from the irradiance component of the solar cycle and not the CRF component. Any LCC variation seems not to be a response to changes in the CRF. 5. Does LCC correlate with the solar cycle? The correlation is good during the early part of the ISCCP record (solar cycle 22) but the relationship begins to weaken around 1994, and the correlation from then to the present becomes progressively weaker. This is particularly apparent when the more reliable ISCCP-IR/vis product is used. There isn't much of a correlation between the solar cycle and ISCCP-IR/vis at all: one can inspect the ISCCP data from the ISCCP depository here: http://isccp.giss.nasa.gov/climanal7.html 6. For this reason, most analyses make use of just the period of solar cycle 22 (up to around 1994) and using the less reliable ISCCP-IR data, to investigate possible causal relationships. As indicated in [4.] above the evidence indicates any solar-cycle-LCC correlation isn't causal with respect to the CRF; apparent correlation between CRF and solar cycle seems to be an artefact of the fact that the CRF correlates with the solar cycle. 7. Direct empirical analysis of the CRF-LCC hypothesis therfore leads to the conclusion that there isn't a detectable causal link between CRF and LCC. However there may be a relationship between LCC and solar irradiance changes through the solar cycle. 8. Note that the two main advocates of the CRF-cloud-climate hypothesis don't address these subjects by doing relevant science, but either ignore these comprehensive analyses or snipe from web blogs. Ignoring the proper scientific channels and resorting to web blogs and web reports has the advantage for advocates that bogus arguments can be used to attempt to counter these analyses, and whenever a scientist might take the time to point out the errors on the blog, they can just be ignored. 9. Forbush events. Inconclusive so far. Some tenuous evidence that cloud cover might change in response to very large short term drops in the CRF. [*] according to the ISCCP scientists (Rossow and Schiffer, 1999), the ISCCP-IR/vis data is a more reliable product that the ISPCC-IR data set, since (i) IR cannot distinguish low clouds from any region of the earth's surface below that has trhe same temperature, and (ii) thin cirrus clouds can be misassifned as low level clouds. Rossow and Schiffer (1999) Advances in understanding clouds from ISCPP. Bull. Am. Met. Soc. 80, 2261-2287 Kristjánsson, J. E., A. Staple, J. Kristiansen, and E. Kaas, A new look at possible connections between solar activity, clouds and climate, Geophys. Res. Lett., 29(23), 2107, 10.1029/2002GL015646, 2002. Kristjansson JE, Kristiansen J, Kaas E (2004) Solar activity, cosmic rays, clouds and climate - an update Adv. Space Res. 34, 407-415. Kristjansson JE, Stjern CW, Stordal F, et al. (2008) Cosmic rays, cloud condensation nuclei and clouds - a reassessment using MODIS data Atmos. Chem. Phys. 8, 7373-7387. Erlykin AD, Sloan T, Wolfendale AW (2009) Solar activity and the mean global temperature Environ. Res. Lett: 4 art # 014006 Sloan T, Wolfendale AW (2008) Testing the proposed causal link between cosmic rays and cloud cover Environ. Res. Lett. 3 art. # 024001 A.D. Erlykin, T. Sloan, A.W. Wolfendale (2009) The search for cosmic ray effects on clouds J. Atmos. Solar Terrestr. Phys. 71, 955-958 A.D. Erlykin, G. Gyalai, K. Kudela, T. Sloan, A.W. Wolfendale (2009) Some aspects of ionization and the cloud cover, cosmic ray correlation problem J. Atmos. Solar Terrestr. Phys. 71, 823-829
    0 0
  22. 'What you said suggested that the climate was selectively reacting to different radiative forcings. AFAIK, there is nothing in the scientific litterature that could support that. A radiative forcing is a radiative forcing. Otherwise pointers would be appreciated.' What I said was: 'The point is that 0.08 degrees per decade (and declining sensitivity to greenhouse gases) is not sufficient to warrant restricting the economic aspirations of billions of people.' I am sure what I said implies that the climate response to a quanta of increase in greenhouse gases declines exponentially as gas concentrations increase. If we add x amount of greenhouse gases to the atmosphere there is y response. If we then add another x quanta - the response is less than y. Nothing magical about it. I very patiently explained the very basic atmospheric physics and suggested you look it up on Wikepedia. What is your problem? The EPA report is worth reading. I assume you haven't read it? I referred the the UAH temperature graph available on Roy Spencers website. It is also available on a NASA website. I have just had a look the Spencer CO2 blog. My first thought was - really 300 ppmv CO2 is background for an interglacial - but 380 ppmv is probably anthropogenic. I don't think Spencer claims to be convinced otherwise. Dr Roy Spencer has always been measured and rasonable. 'Roy W. Spencer received his Ph.D. in meteorology at the University of Wisconsin-Madison in 1981. Before becoming a Principal Research Scientist at the University of Alabama in Huntsville in 2001, he was a Senior Scientist for Climate Studies at NASA’s Marshall Space Flight Center, where he and Dr. John Christy received NASA’s Exceptional Scientific Achievement Medal for their global temperature monitoring work with satellites. Dr. Spencer’s work with NASA continues as the U.S. Science Team leader for the Advanced Microwave Scanning Radiometer flying on NASA’s Aqua satellite.' The freezing point of carbon dioxide is -57 degrees centigrade. The lowest temperature ever recorded was -89.2 at Vostok in 1983. CO2 snow seems broadly feasible - although I am not sure that I would claim any climate implications - other than it is bloody cold in Antarctica. Riccardo assumes that autocorrelation should be minimal - in fact it is the multi decadal signal in the data that is important, i.e. we are looking for the signal in the variation and not a period of approximately linear change. He assumes that the start and end points are arbitrary whereas they correspond to phase shifts in global climate as identified in the Swanson paper and as is evident in climate records. That is transitions in the mid 1940's, the mid 1970's and following 1998. He also assumes that variability is random noise whereas in fact it is temperature response to clouds, ENSO, volcanos etc. So in fact variation is meaningful and precision is limited only by the errors of measurement. 1998 is far from cherry picking - it was the end of one climate state and the beginnning of another. Very important. Swansons explanation is that the 1998 El Nino was so big it flipped climate into a new phase. I think clouds may be the driver - but feeding into a dynamic and resonant ocean and atmosphere. "But to be rabbiting on, at such length, about these minor matters, while the great big CO2 elephant in the room keeps trumpeting for attention, is a sign of the same old denialism that is based on an unshakeable ideology that either (or both), humans can't affect a god-given home; or unfettered capitalism based on an ever increasing dependence on burning fossil fuels is the only way to conduct human affairs" Does Thumb's post apply to the insistance that denialists are Christian and capitalists? I was trying to be relaxed and amusing on Riccardo's post. Perhaps I should have entered into a more serious statistical discussion. Nothing you are saying has any scientific content at all.
    0 0
  23. Chris, "1. While we've been discussing minutae of the solar/cloud/climate response the obvious thing that I think we agree on is that there has been no significant secular trend in the cosmic ray flux (CRF) since detailed measures began in 1958. So the very large global scale warming of the last 30-odd years has nothing to do with the CRF." I don't really disagree here, I suppose though I think that there might be a trend vis a vis the GCRs. IAC, I don't think cosmic ray flux has been a major contributor to the short term temperature trends. What I find puzzling, however, is the complete lack of interest in the *long-term* correlation of CRF and climate events. Since I consider this long-term correlation to be pretty definitive, this influences my interpretation of short-term measurements as well. If I ignored the long-term correlation as you do, I might well come to the same conclusions as you. http://arxiv.org/PS_cache/arxiv/pdf/0804/0804.1938v1.pdf IAC, I can see a lot of reasons why relatively small and fairly short-term varations may not be easily seen(leading to contradictory answers being found by say Erlykin and Harrison). I cannot, however, think of a good reason why multiple long term analyses demonstrate a correlation in different time schemes and proxies, where a relationship does not actually exist. I further think that the analysis of climate issues is massively complicated and it is fairly easy for mistakes to be made. Given this, it is pretty easy to imagine that what seems true after reading one paper may not turn out to be accurate in the future. I think you are somewhat unfair to Svensmark and Shaviv, but there is no reason to keep beating that horse. I don't think there is anything particularily illogical about their arguments. I still submit that you are much too quick to rule out the link between the solar cycle and cloudiness(based perhaps on the most recent cycle contradictory data). I feel that this link is pretty well accepted (by Erlykin et al. certainly). There must be some way that sunspot counts get reflected in the price of wheat and I don't see how a 0.1-0.2 deg. C could do it. Cheers, :)
    0 0
  24. Robbo, i have really nothing to comment on the torturing of data. It's just very basic statistics without which you can make the data tell you whatever you like. As infact too often happens. Swanson et al. identify the periods differently from you. "The top panel in Figure 1 shows that in a statistically rigorous sense such synchronizations only occurred four times (1910-20; 1938-45; 1956-60; and 1976-1981) during the 20th century, and three of those synchronizations (all but 1956-1960) coincided with shifts in the climate state." Hence, the period starting in '38-'45 ended in '75-'81. I started in 1970 but could have started in '75 or '81 as well, it makes no difference. Autocorrelations is progressivly lower the more you average. It does not depends on the time range but on averages. In monthly data (often quoted to "demonstrate" the cooling of the last decades) it's larger, lower for annual and even lower for longer averages. And yes, the variability is due to ENSO, volcanos, etc.; pretty random, isn't it? You could even check the degree of randomness and, what a surprise, it behaves pretty much similar to autocorrelation. But ... wait ... it's statistics again ... :D Anyway, if you have time to check, ENSO (MEI index) and volcanoes explain the great part of the fluctuations (almost all indeed) superimposed on a monotonic increase. Finally, 1998 is indeed your cherry picking. Swanson et al just hypothised that there has been a climate shift in 2000-'01 not in 1998. And it is just an hypothesis because they could not find any cause and the time span is too short. From Swanson's post on RealClimate: "Whether or not such a halt has really occurred is of course controversial (it appears quite marked in the HadCRUT3 data, less so in GISTEMP); only time will tell if it’s real." And I agree. Like it or not the last decade is still largely inside the natural fluctuations.
    0 0
  25. 'What you said suggested that the climate was selectively reacting to different radiative forcings. AFAIK, there is nothing in the scientific litterature that could support that. A radiative forcing is a radiative forcing. Otherwise pointers would be appreciated.' What I said was: 'The point is that 0.08 degrees per decade (and declining sensitivity to greenhouse gases) is not sufficient to warrant restricting the economic aspirations of billions of people.' I am sure what I said implies that the climate response to a quanta of increase in greenhouse gases declines exponentially as gas concentrations increase. If we add x amount of greenhouse gases to the atmosphere there is y response. If we then add another x quanta - the response is less than y. Nothing magical about it. I very patiently explained the very basic atmospheric physics and suggested you look it up on Wikepedia. What is your problem? The EPA report is worth reading. I assume you haven't read it? I referred the the UAH temperature graph available on Roy Spencers website. It is also available on a NASA website. I have just had a look the Spencer CO2 blog. My first thought was - really 300 ppmv CO2 is background for an interglacial - but 380 ppmv is probably anthropogenic. I don't think Spencer claims to be convinced otherwise. Dr Roy Spencer has always been measured and rasonable. 'Roy W. Spencer received his Ph.D. in meteorology at the University of Wisconsin-Madison in 1981. Before becoming a Principal Research Scientist at the University of Alabama in Huntsville in 2001, he was a Senior Scientist for Climate Studies at NASA’s Marshall Space Flight Center, where he and Dr. John Christy received NASA’s Exceptional Scientific Achievement Medal for their global temperature monitoring work with satellites. Dr. Spencer’s work with NASA continues as the U.S. Science Team leader for the Advanced Microwave Scanning Radiometer flying on NASA’s Aqua satellite.' The freezing point of carbon dioxide is -57 degrees centigrade. The lowest temperature ever recorded was -89.2 at Vostok in 1983. CO2 snow seems broadly feasible - although I am not sure that I would claim any climate implications - other than it is bloody cold in Antarctica. Riccardo assumes that autocorrelation should be minimal - in fact it is the multi decadal signal in the data that is important, i.e. we are looking for the signal in the variation and not a period of approximately linear change. He assumes that the start and end points are arbitrary whereas they correspond to phase shifts in global climate as identified in the Swanson paper and as is evident in climate records. That is transitions in the mid 1940's, the mid 1970's and following 1998. He also assumes that variability is random noise whereas in fact it is temperature response to clouds, ENSO, volcanos etc. So in fact variation is meaningful and precision is limited only by the errors of measurement. 1998 is far from cherry picking - it was the end of one climate state and the beginnning of another. Very important. Swansons explanation is that the 1998 El Nino was so big it flipped climate into a new phase. I think clouds may be the driver - but feeding into a dynamic and resonant ocean and atmosphere. "But to be rabbiting on, at such length, about these minor matters, while the great big CO2 elephant in the room keeps trumpeting for attention, is a sign of the same old denialism that is based on an unshakeable ideology that either (or both), humans can't affect a god-given home; or unfettered capitalism based on an ever increasing dependence on burning fossil fuels is the only way to conduct human affairs" Does Thumb's post apply to the insistance that denialists are Christian and capitalists? I was trying to be relaxed and amusing on Riccardo's post. Perhaps I should have entered into a more serious statistical discussion. Nothing you are saying has any scientific content at all.
    0 0
  26. Chris assumes that lack of increase in neutron count from 1953 implies that this does not correlate with increasing temperature. He essentially denies a 1150 year correlation based on half a century of observation. Utterly ridiculous. The true interpretation is that cosmic ray flux peaked in the last half of the 20th century on a 1000 year high at least. How should this translate into global energy storage. Solar irradiance changes very little – yet climate changes over 1500 year cycles. This has led to the pursuit of a GCR/Cloud connection to explain the discrepancy. The theory suggests a millennial low in cloud cover last century - but reasonably constant over period of the neutron record. As we have already seen, Chris confuses energy flux with energy – particularly as it accumulates in the ocean. The increase in shortwave radiation results in a radiative imbalance that takes some time to work through the system. See this Stanford University site for a far more balanced and considered discussion than is provided by blinkered global warmists. http://www2.slac.stanford.edu/vvc/cosmicrays/cratmos.html Contrary to the unscientific certainty of global warmists – this is not 100% certain. However, there are other cyclic processes that are far more certain. The planet is not warming for 20 to 30 years from 1998.
    0 0
  27. "The freezing point of carbon dioxide is -57 degrees centigrade. The lowest temperature ever recorded was -89.2 at Vostok in 1983. CO2 snow seems broadly feasible" If you really believe this, then I know I have nothing to learn from you. The other statement I was referring to earlier was this one: "declining sensitivity to greenhouse gases" i.e. variable sensitivity to a specific radiative forcing.
    0 0
  28. #75 "Does Thumb's post apply to the insistance that denialists are Christian and capitalists? " #62 "If it is a contest between God and capitalism and aetheism and socialism - I am on the side of the angels."
    0 0
  29. Philippe, 'The freezing point of carbon dioxide is -57 degrees centigrade. The lowest temperature ever recorded was -89.2 at Vostok in 1983. CO2 snow seems broadly feasible - although I am not sure that I would claim any climate implications - other than it is bloody cold in Antarctica.' You quote me out of context and imply a greater sigificance for a fun idea than it warrants. As I have explained - this is declining climate sensitivity to increasing greenhouse gases based on fundamental atmospheric physics. Bit of a shorthand - but I have tried to explain the concept. Are you saying this is wrong? There is no specific radiative forcing - just one forcing at one level of gases and another forcing at another - the relationship is not linear.
    0 0
  30. David, I don't deny that I am both a theist and a capitalist. I think that people who think that evolution doesn't need God don't understand Einsteins's space-time continuum. In the context of that discussion - my comment was in relation to stable democracy, small government, minimally regulated capitalism and the reduction in global poverty. I can't help if you have a problem with that but this is not the place and I didn't raise the subject.
    0 0
  31. Let’s have another quick look at clouds. There is a lot of useful data on Professor Ole Humlum’s homepage at: http://www.climate4you.com There are records of clouds from 1985. They show declining cloud cover to the turn of the century and increasing thereafter. Goode et al 2009 (can be found on the bibliography page of Project Earthshine – show this as albedo changes of a decrease in Earth albedo of 1% (additional shortwave of 3.5 W/m2) and an increase after 1999 of 0.75 % (less shortwave at the surface of 2 W/m2). High and low cloud in the climatically important equatorial zone declined to 1998 and increased thereafter. While the causes are not clear, it seems clear that 1998 marked a transition in biological, oceanographic and climate systems. Transitions occur in the instrumental and proxy records on a 50 year cycle – and it is interesting to consider a heliospheric /cloud connection. It may be that the cycle is a mode of internal dynamic variability that result in cloud changes.
    0 0
  32. re #80: "I think that people who think that evolution doesn't need God don't understand Einsteins's space-time continuum." It's pretty clear that people who use the phrase "space-time continuum" in the same sentence as "evolution" don't understand either of those things. It's a bit like saying "i think that people who think that ducks don't need bicycles don't understand computers" - the sentence parses correctly, but really doesn't say anything useful...
    0 0
  33. Gewtting back to the topic of ocean-earth heat lag. Hansen 2005 states: "Levitus et al. (14) compiled ocean temperature data that yielded increased ocean heat content of about 10 W yr m-2, averaged over the Earth’s surface, during 1955-1998". Yes, as expected by heat lag from the sun to the 1990s. But then he states: "First, the predicted energy imbalance due to increasing greenhouse gases has grown to 0.85 ± 0.15 W/m2". In other words he ENTIRELY assumes that past century T rise is by greenhouse gases first, which has therefore created a "predicted energy imbalance", by "increasing greenhouse gases". If we assume an energy imbalanace, then we get an energy imbalance. Mindbloggingly circular and stupid. There is no evidence to conclude, as he does, that the there is an energy imbalance at present, unless one assumes that T is rising by C02 in the first place, as he states above, that he does. This is not proof, is is circular reasoning. If we assume an energy imbalanace, then we get an energy imbalance. He uses the same argument further down to get a figure of 0.6 degrees C still 'in the pipeline' ie from ocean heat content, ie imbalanced with c02 forcing. NOWHERE does he discuss or address or acknowldedge the fundamental assumptions of the models he bases this figure on, ie that he ASSUMES T rise is being driven by c02, and not the sun. Ill repeat it for the sake of clarity: "the predicted energy imbalance due to increasing greenhouse gases has grown" How many circular assumptions kiddies are in this statment?? I count 3. 1. "predicted energy imbalance"..ie based on their being an energy imbalnace due to c02 driving T. 2."due to increasing greenhouse gases"-which assumes that they are driving T. No mention of the sun, or heat lag from such. 3.Has grown-ie if you assume the first 2 you get the last-has grown. Based on this sort of feedback reasoning, I predict that their T predictions, energy imbalances, and such, will just keep going up and up, because there is nothing stopping their "self-reinforcing reasoning feedback loops" from just getting larger and larger. Meanwhile, T hasnt risen in the last 10 years, because it is not subject to the 'global warmists by humans' self-reinforcing reasoning-positive feedback loops. Heat lags have now stabilised, there is no energy imbalance, and T will not rise over the next 10-20 years, unless the sun becomes more active again.
    0 0
  34. I also strongly suspect, that Figures 1 and 2 above are based on model assumptions relating entirely to c02 driving T as well (see my previous post). They are therefore not evidence, jsut self-perpetuating data models, adjusted at whim as a modeller sees fit. Figure 1's 'runs' above are based on Hansens model assumptions of T being driven by c02 in his paper; figure 2 'erbs' and 'ceres' and also based on predicted fluxes-assuming an imbalance with respect to T being driven by c02. They are both therefore circular-reasoning graphs which dont show anything except the whims and assumptions of the modellers who compiled them. i have seen similar modelling assumptions in modelling work by financial instutions.
    0 0
  35. re 82 Nothing to do with heat lag but the connection is with the arror of time. The past lost - the future unformed - all there is the evolving moment which moves forward in time like an arrow. Space-time does not evolve - it simply exists. ‘It is believed to be a 'continuum' because so far as we know, there are no missing points in space or instants in time, and both can be subdivided without any apparent limit in size or duration. So, physicists now routinely consider our world to be embedded in this 4-dimensional Space-Time continuum, and all events, places, moments in history and in the future, actions and so on are described in terms of their location in Space-Time.’ http://einstein.stanford.edu/content/relativity/q411.html Can evolution be said to occur if the future form exists in a future moment in the time-space continuum? Meanwhile - the duck rides the bicycle around and around at relativistic speeds until it disapears up it's own ring in a secular humanist universe.
    0 0
  36. re 82 Nothing to do with heat lag but the connection is with the arror of time. The past lost - the future unformed - all there is the evolving moment which moves forward in time like an arrow. Space-time does not evolve - it simply exists. ‘It is believed to be a 'continuum' because so far as we know, there are no missing points in space or instants in time, and both can be subdivided without any apparent limit in size or duration. So, physicists now routinely consider our world to be embedded in this 4-dimensional Space-Time continuum, and all events, places, moments in history and in the future, actions and so on are described in terms of their location in Space-Time.’ http://einstein.stanford.edu/content/relativity/q411.html Can evolution be said to occur if the future form exists in a future moment in the time-space continuum? Meanwhile - the duck rides the bicycle around and around at relativistic speeds until it disapears up it's own ring in a secular humanist universe.
    0 0
  37. Based on this sort of feedback reasoning, I predict that their T predictions, energy imbalances, and such, will just keep going up and up, because there is nothing stopping their "self-reinforcing reasoning feedback loops" from just getting larger and larger. Meanwhile - the duck rides the bicycle around and around at relativistic speeds until it disapears up it's own ring in a secular humanist universe Actually, the duck experiment seems to work well. Thanks Thingadonta.
    0 0
  38. Re #76 Robbo, your aggressive splattering of ill-considered assertions supported by dodgy sources doesn't make a good impression. It's essentially trolling. Why not relax and try to consider these points scientiically rather than politically. Which 1150 year "correlation" are you thinking of? What do you think this correlation actually means? Try to think scientifically. Let's have a look: 1. we've already seen (my post #71), that despite some prodigious research efforts, a causal link between variations in the cosmic ray flux (CRF) and clouds hasn't been established. Recent research rather significantly decreases the likelihood of a causal link. If there is a correlation between the solar cycle and low level clouds the evidence indicates that this is discorrelated with the CRF and is causally related to irradiance changes. 2. Similar arguments apply even more strongly in the past. Changes in 10Be in ice cores and 14C in tree rings is a measure of varying solar outputs represented by the CRF. But just as with the very detailed contemporary analyses (see my post #71), there is no good a priori reason for assuming that any climate-related consequences of solar variation are causally related to the putative CRF component of the solar variation. In fact recent evidence suggests that this a priori assumption is a very weakly supported one. 3. There are clearly solar contributions to earth temperature variation during the past 1150 years. Scientific analysis of the likely contributions to variations in climate forcings during this period include solar, volcanic and greenhouse gas. Local variations (e.g. enhanced high N. latitude warming in the so-called MWP and cooling in the LIA) likely have contributions from changes in atmospheric and ocean currents that result in changes in heat transport from the equatorial regions to the high Northern latitudes (e.g. [*]. 4. Very detailed analysis of the strength of solar forcing variation by various solar experts determined by empirical analysis during periods where detalied observational data can be obtained [e.g. **, ***, ****] indicates that the solar irradiance contribution to warming from the period of very low solar proxies around the period of the so-called Maunder minimum in the LIA to the mid 20th century may be of the order of 0.2 oC. 5. Probably the most extreme paleoproxy analysis gives a reduced temperature of around -0.6 oC in the N. hemisphere relative to the mid-20th century temperature [*****]. It's likely that this event was somewhat focussed in the N. hemisphere event with the global temperature reduction a bit less than that, but even if we consider that the full global temperature was 0.6 oC cooler then than now, one doesn't need to postulate uncharacterized CRF contributions for which there is no evidence. 6. It's easy to determine the expected contribution of enhanced greenhouse concentrations since we know the CO2 concentrations right through the last 1000 years [******]. These were around 276 ppm at the time of the Maunder minimum and around 310 ppm around 1940. Within the mid range of likely climate forcing (3 oC of warming per doubling of atmospheric CO2 [*******], it's easy to calculate that the equilibrium response resulting from a change of CO2 from 276-310 ppm is around 0.5 oC. There's also good evidence form volcanic ash in cores that there was likely a small contribution from the high volcanic activity in the period of the LIA. Say around 0.1 oC. 7. So why bring in an uncharacterized hypothesised contribution for which the evidence is increasingly poor? Yes there are some correlation between Be and carbon isotopes and climate but we can understand these in terms of solar contributions to both climate and to the CRF flux. These both correlate to the solar properties. It's illogical to assume that this constitutes an a priori causal relationship between the CRF and climate. Recent evidence (see my post #71) indicates that this is an assumption that has little support in evidence. 8. Not sure what your unpleasant insinuations about my understanding of energy and energy flux refers to. Try to be a bit more explicit with criticisms – dumping post after post containing poorly-attributed and vague assertions ain't science Robbo. We can see you have strong political views but why not get in the spirit of this website and stop trolling. [*]Lund DC et al. (2006) Gulf Stream density structure and transport during the past millennium, Nature 444, 601-604 [**] Foukal, P. (2002), A comparison of variable solar total and ultraviolet irradiance outputs in the 20th century, Geophys. Res. Lett., 29(23), 2089, doi:10.1029/2002GL015474. [***]Lean, J. (2000), Evolution of the Sun’s spectral irradiance since the Maunder Minimum, Geophys. Res. Lett., 27, 2425–2428. [****] Lean, J. L., and D. H. Rind (2008), How natural and anthropogenic influences alter global and regional surface temperatures: 1889 to 2006, Geophys. Res. Lett., 35, L18701 [*****] Moberg, A et al. (2005) Highly variable Northern Hemisphere temperatures reconstructed from low- and high-resolution proxy data Nature 433, 613–618 (2005) [******]D. M. Etheridge et al (1996) “Natural and anthropogenic changes in atmospheric CO2 over the last 1000 years from air in Antarctic ice and firn J. Geophys Res. 101, 4115 -4128 [*******]R. Knutti, G. C. Hegerl (2008) The equilibrium sensitivity of the Earth's temperature to radiation changes Nature Geoscience 1, 735-743
    0 0
  39. re: #86 "Can evolution be said to occur if the future form exists in a future moment in the time-space continuum?" This is gibberish. Do you really expect to be taken seriously by anybody when you write such bizarre nonsense as this? At least now your complete inability to follow the science makes some sense. Chris, your herculean efforts to bring facts and reason to the discussion (nice summary above BTW) are clearly wasted on somebody who writes such nonsense. This is no longer a scientific discussion, it is an exploration into abnormal psychology. Interesting, but other than learning about the psychological barriers to understanding that deniers have, it has little connection to science. Perhaps Robbo should go "debate" the timecube guy?
    0 0
  40. Honestly - I link and quote a Stanford University website on what is a widely accepted understanding of space-time and a foolish little person insists on compounding their idiocy. Time would be better spent in expanding both their education and their imagination. Chris at least raises scientific issues – if in his usual disingenuous way. The 1150 year is of course the Usoskin correlation as he knows full well. I get it – you don’t think there is a link between clouds and cosmic rays and that natural climate variation is caused primarily by changes in solar irradiance. The usual consensus is that changes in irradiance are insufficient to explain observed climate variation. See for instance: Shortwave forcing of the Earth's climate: modern and historical variations in the Sun's irradiance and the Earth's reflectance, P.R. Goode, E. Palle, J. Atm. and Sol.-Terr. Phys., 69,1556, 2007. PDF I advise that there is an error on Figure 4 in that the left hand axis was mislabelled – which was brought to my attention by Chris misinterpreting this as a 20 fold reinterpretation of the data. I am very bored with the endless repetition of this argument and your dogmatic assertions – particularly so as I am barely involved in this line of argument. I merely referred to the Stanford University high energy physics site which suggests that the idea should not be dismissed out of hand – very much more in the spirit of scientific openness and debate. Much as is the work coming out of CERN and elsewhere. But you know best. I am much more interested in the empirical science of clouds, ocean temperature, rainfall and biology and in the climate transitions of the mid 1940’s, the mid 1970’s and following 1998. My exact words were that while ‘the causes are not clear, it seems clear that 1998 marked a transition in biological, oceanographic and climate systems. Transitions occur in the instrumental and proxy records on a 50 year cycle – and it is interesting to consider a heliospheric /cloud connection. It may be (however) that the cycle is a mode of internal dynamic variability that result in cloud changes. If you have 1 reference that questions this – I would be happy to hear of it.
    0 0
  41. I have been edited - LOL 'The 2008 defensive reaction to the recent lack of global warming can be considered as another fine example of groupthink. A premature sense of apparent unanimity prevails (most scientists agree that global warming is real and manmade), and any doubts and contrary views are suppressed (by ... institutions launching lists of ‘correct’ answers to a number of critical questions (so-called myths), including the lack of warming since 1998).' 'To make groupthink testable, Irving Janis devised eight symptoms indicative of groupthink (1977). 1. Illusions of invulnerability creating excessive optimism and encouraging risk taking. 2. Rationalising warnings that might challenge the group's assumptions. 3. Unquestioned belief in the morality of the group, causing members to ignore the consequences of their actions. 4. Stereotyping those who are opposed to the group as weak, evil, biased, spiteful, disfigured, impotent, or stupid. 5. Direct pressure to conform placed on any member who questions the group, couched in terms of "disloyalty". 6. Self censorship of ideas that deviate from the apparent group consensus. 7. Illusions of unanimity among group members, silence is viewed as agreement. 8. Mindguards — self-appointed members who shield the group from dissenting information. Groupthink, resulting from the symptoms listed above, results in defective decision making. That is, consensus-driven decisions are the result of the following practices of groupthinking: 1. Incomplete survey of alternatives 2. Incomplete survey of objectives 3. Failure to examine risks of preferred choice 4. Failure to reevaluate previously rejected alternatives 5. Poor information search 6. Selection bias in collecting information 7. Failure to work out contingency plans.
    0 0
  42. Context is irrelevant in the case of the CO2 snow idiocy. No other context is necessary than the atmosphere of this planet. In this context, "broadly feasible" is so far off the mark that it's downright comical. No implication about climate needs to be considered at all. The idea is not fun, it's stupid, and anyone entertaining it as even remotely possible should be met with profound distrust on science considerations.
    0 0
  43. "Honestly - I link and quote a Stanford University website on what is a widely accepted understanding of space-time and a foolish little person insists on compounding their idiocy. Time would be better spent in expanding both their education and their imagination." Methinks someone's feelings were hurt. "'To make groupthink testable, Irving Janis devised eight symptoms indicative of groupthink (1977)." Now you're projecting. You gave your game away with this line: "...is not sufficient to warrant restricting the economic aspirations of billions of people." Your entire ongoing argument is based on finding anything, however small, that supports what I would argue is a false premise; that addressing our continued contribution to greenhouse gases would somehow have an adverse economic affect on "billions of people." In the real world in which I work converting to high efficiency and alternative energy sources creates jobs and holds an easily calculable payback when measured against current systems and fossil fuels, which, BTW, simply can't go on forever. Reducing greenhouse gases might be a driving force for some, but the real selling point for moving the global economy into green energy technologies is their potential to expand and enhance the economic aspirations of billions of people.
    0 0
  44. "Similar arguments apply even more strongly in the past. Changes in 10Be in ice cores and 14C in tree rings is a measure of varying solar outputs represented by the CRF. But just as with the very detailed contemporary analyses (see my post #71), there is no good a priori reason for assuming that any climate-related consequences of solar variation are causally related to the putative CRF component of the solar variation. In fact recent evidence suggests that this a priori assumption is a very weakly supported one." The problem with this line of argument is that total irradiance doesn't vary nearly as much as the climate has. Kirkby's 2007 review states that "...more recent estimates suggest that long-term irradiance changes are probably negligible". As such, since the total irradiance doesn't change much and the CRF does, the fact that CRF varies in tandem with climate changes, is good evidence that the CRF itself influences climate somehow. It is possible that some other solar-related property varies much more closely than CRF to the observed climate changes, but clearly irradiance changes themselves don't explain what we see happening. Cheers, :)
    0 0
  45. I've been trying to understand RC's post on a simple model in the light of this article and, if possible, I would like to understand the reason for a difference. According to RC's post: σTs4 = S /(1 - 0,5λ) Where S = (1-a)TSI/4 λ = emissivity (0,769) However, as I understand it, according to this article, that would rather be: σT4 = S/λ Using RC's notation: λ = ε (emissivity) S = what in this article is S(1-A)/4 Are my numbers wrong? Are the two approaches based on different simplifications? Thanks! RC's post Formulas better displayed here
    0 0
  46. The problem with this line of argument is that total irradiance doesn't vary nearly as much as the climate has. Kirkby's 2007 review states that "...more recent estimates suggest that long-term irradiance changes are probably negligible". As such, since the total irradiance doesn't change much and the CRF does, the fact that CRF varies in tandem with climate changes, is good evidence that the CRF itself influences climate somehow.
    That doesn't seem logical to me Shawnet. It begs rather a lot of questions. 1. The climate transitions since the Maunder minimum are understandable in terms of known contributions from solar, volcanic and greenhouse contributions (points 4,5 and 6 of my post #88). That doesn't mean that my breakdown of contributions is exactly correct! However one doesn't need to postulate any as yet uncharacterised forcings (solar or otherwise) to understand this variation. 2. That may or may not apply to the previous few centuries, e.g. involving the MWP. The climate variation during this period isn't so well characterised, and some of the climate variation may be regional and due to changes in ocean/atmospheric heat transport (my point 3 in post #88). Of course that begs the question of whether these heat transport variations are internal modulations of the climate system or are externally forced. 3. Previous to that there isn't a very good understanding of global Holocene climate variability I believe (I haven't seen serious Holocene global paleoproxy reconstructions other than these: Holocene_Temperature_Variations.png There are various bits of highly localized proxies (stalagmites; glacial ice etc.) which correlate solar proxies with climate proxies, but whether these are representative of global scale changes isn't very clear I think. So I'm not sure we can say that the total irradiance hasn't varied as much as the climate has, since we haven't got much evidence for the climate variability and solar irradiance variability during periods of the Holocene before a couple of millenia ago. Note that some of the early Holocene climate variability (around 8000-6000 years ago, I think) is a Milankovitch effect). 4. The fact that the CRF might vary more than solar irradiance (I assume you mean in terms of % variation around some mean), doesn't necessarily say anything about the relative contributions of the CRF changes and irradiance changes. After all, if CRF changes don't have a significant climate effect it doesn't matter how much these change. 5. Obviously climate has changed considerably in the past. But this is largely understandable in terms of earth orbital variations (Milankovitch cycles) with greenhouse gas and albedo feedbacks (last couple of million years), and further into the deep past through changes in greenhouse gas concentrations (rising CO2 concentrations from tectonic processes; reducing greenhouse gas concentrations from weathering processes), the progressively decreasing solar constant as we go back in time (Kirkby must surely know this, 'though perhaps by "long-term" he doesn't mean millions of years time scale), and tectonic activity. 6. So I'm not sure that we need to postulate any solar contributions outside irradiance changes. That's not to say that these don't exist (the evidence for the direct CRF-climate contribution is weak in my understanding of the science - e.g. see my post #71); it's just that they haven't been identified (to my knowledge), and aren't necessarily required to explain anything.... ...what do you think? Is there some serious evidence that some non-irradiance solar contributions are rwquired to explain particular climate transitions/variations?
    0 0
  47. Chris, I think you would be well served by reading the Kirkby review here/ From p.5-6 2.1.3 Solar and cosmic ray changes since the Little Ice Age The cold climate of the Little Ice Age appears to have been caused by an extended period of low solar activity. Few sunspots implies low magnetic activity and a corresponding elevated GCR flux. But could the observed warming since the Little Ice Age be explained by changes of solar irradiance rather than introducing the possibility of GCR-climate forcing? Recent results on Sun-like stars, combined with advances in the understanding of solar magnetohydrodynamics [8] have revised earlier estimates of the long-term variation of solar irradiance [5] downwards by as much as a factor of five (Fig. 5) [6, 7]. Apart from the irradiance changes due to sunspot darkening and facula brightening, no mechanism has been identified for solar luminosity variations on centennial or millennial time scales [8]. Current estimates of the secular increase of irradiance since 1700 are therefore based only on the variation in mean sunspot number. The increase in irradiance amounts to less than 0.5 Wm􀀀2, which corresponds to about 0.08 Wm􀀀2 at the top of the atmosphere, globally averaged (Fig. 5). Assuming a climate sensitivity of 0.7 K/Wm􀀀2, ***this would contribute less than 0.06C of the estimated 0.6C*** mean global warming between the Maunder Minimum and the middle of last century, before significant anthropogenic contributions could be involved. On the other hand, there is clear evidence of a substantial increase in solar magnetic activity since the Little Ice Age (Fig. 6) [55, 3]. http://arxiv.org/PS_cache/arxiv/pdf/0804/0804.1938v1.pdf "4. The fact that the CRF might vary more than solar irradiance (I assume you mean in terms of % variation around some mean), doesn't necessarily say anything about the relative contributions of the CRF changes and irradiance changes. After all, if CRF changes don't have a significant climate effect it doesn't matter how much these change." It does when the solar irradiance only has a slight ability to affect the climate(as per above for one of many examples), when the actual changes to the climate are much more extensive. If the magnitude of changes to climate and CRF are both large, then it follows that CRF is a better candidate than irradiance for the climate driver. If the magnitude of changes solar irradiance were of the same size as the changes in climate(or CRF), it would be simpler to assume irradiance was the culprit, but the magnitude is much too small. Cheers, :)
    0 0
  48. idiocy, stupidity, abnormal psychology, aggressive – is there a pattern emerging here? But the mildest reply and my feelings are hurt? Phillipe –what part of Vostok minus 89 degrees – freezing point of CO2 minus 57 – don’t you understand? To continue with irrelevancies is silly. If I got the numbers wrong from my quick internet search – please tell me. Otherwise it is simply another straw man. I have no problem with technology, efficiency and innovation. Efficient and cost effective technology needs no assistance from government – except perhaps i in providing R&D funding of which not nearly enough is happening. People like Bjorn Lomberg consistently argue for more R&D and an economically rational transition. Nothing to do with giving any game away – increasing costs for energy in the third world is guaranteed to have a price in human lives. Temperature rise to 1945 was largely natural – in that CO2 concentrations of 300 ppmv is par for the course for an interglacial. Please note that the IPCC talks about the last 50 years. CO2 levels started rising after the mid 1940’s – and temperatures declined for 30 years. The usual explanation was that sulphur dioxide caused the dip. But the IPCC net forcing was always positive in the period. Climate shifted suddenly in the mid 1970’s to a period of more frequent and intense El Niño and rising temperature and has shifted again post 1998 – as in the Swanson et al paper and Real Climate blog I have already referenced. But the literature on PDO, AMO, ENSO multidecadal variation and decadal fisheries and ecological productivity is extensive. This is a 50 year climate cycle. Global temperature has declined and ocean heat content is at most steady since 1998. As in the Swanson paper shows – the underling trend of post war warming (across a full cycle of multi-decadal variation) that might be attributed to CO2 is 0.08 degrees centigrade per decade and the planet is cooling for another decade or two.
    0 0
  49. I did read that in Kirkby's review, shawnet. This specific point that you cut and pasted doesn't accord with the evidence for two reasons. (i) Kirkby has very oddly attempted to treat every last bit of paleoclimatology in terms of the CRF. It leads to some ludicrous interpretations which we could discuss. He completely discounts any possible contribution from greenhouse gas variations stating in a footnote at the outset, this rather audacious illogic falsehood: "Greenhouse gases are not included since, prior to the twentieth century, short-term changes of greenhouse gases, such as occurred during glacial-interglacial transitions, are found to be a feedback of the climate system and not a primary forcing agent [11]." Perhaps you didn't read my post above (#88), but it's very straightforward to assess the CO2 concentrations through the last 1000 years from a number of Antarctic cores drilled at Law Dome. The pre-industrial CO2 concentration was near 280 ppm (reduced to around 276 at the Maunder minimum) and was around 310 ppm by 1940. Within a climate sensitivity of 3 oC, it's also straightforward to calculate the temperature rise at equilbrium resulting from a 276-310 increase in atmospheric CO2. It's near 0.5 oC. So Kirkby's assertion that you cut and pasted is bogus as is his astonishing footnote. We expect that the temperature rise from the CO2 change (virtually all of which is anthropogenic), to be very significant indeed (something approaching 0.5 oC) between the Maunder minimum and the mid-20th century. (ii) Kirkby comes up with a tiny value for the solar irradiance contribution to warming from the Maunder minimum to the mid 20th century. He's right that the value is not very large. However, the solar scientists that actually determine the solar irradiance reconstructions consider that the irradiance contribution is somewhat larger than that. Lean calculates a solar irradiance contribution near 0.9 oC between 1890 and the present with almost all of this before the mid 20th century. The Maunder minimum to mid 20th century contribution is likely near 0.2 oC (see reference in my post #88 – her 2008 paper). So Kirkby's argument just doesn't accord with the evidence. There is a well-characterised source for a large contribution to to the temperature rise between the Maunder minimum and the mid-20th century. Kirkby also ignores the volcanic contribution to the Little Ice Age cold [*; see Figure 7]. But then his review rather astonishingly ignores anything that can't be interpreted in terms of the CRF…. [*] P.D. Jones and M.E. Mann (2004) Climate over Past Millenia (2004) Reviews of Geophysics, 42, RG2002.
    0 0
  50. Robbo, this is an oddly false assertions...what were you thinking of?: "Temperature rise to 1945 was largely natural – in that CO2 concentrations of 300 ppmv is par for the course for an interglacial. Please note that the IPCC talks about the last 50 years. CO2 levels started rising after the mid 1940’s – and temperatures declined for 30 years." No. The natural interglacial concentration is 270-280 ppm. We can assess this in great detail for the present interglacial [*]. The preindustrial concentrations were very close to around 277 +/- ~ 5 ppm since around 1000 AD to the preindustrial period. Significant anthropogenic contributions to atmospheric CO2 started around the start of the 19th century (land use changes largely at that point) and CO2 concentrations had reached around 310 ppm by around 1940. That CO2 rise is expected to give a contribution to the earth's global temperature of around 0.5 oC at equilibrium (using the median value of the climate sensitivity of 3 oC). So the pre-1945 temperature rise was very unlikely to be natural. Quite a large chunk is almost certainly anthropogenic. Note that the rather rapid increases in anthropogenic CO2 only started after post-war industrialisation especially from the early 1960's ([CO2] levels were still only 320 ppm in 1962). They really started to race upwards from around that time (see data below). Of course the IPCC doesn't just "talk(s) about" the last 50 years. Why not try reading some of the IPCC reports rather than just making up stuff? 1006.0000 279.4000 1046.0000 280.3000 1096.0000 282.4000 1146.0000 283.8000 1196.0000 283.9000 1246.0000 281.7000 1327.0000 283.4000 1446.0000 281.7000 1499.0000 282.4000 1547.0000 282.8000 1589.0000 278.7000 1604.0000 274.3000 1647.0000 277.2000 1679.0000 275.9000 1720.0000 277.5000 1760.0000 276.7000 1796.0000 283.7000 1825.0000 285.1000 1845.0000 286.1000 1861.0000 286.6000 1877.0000 288.8000 1882.0000 291.7000 1891.0000 294.7000 1899.0000 296.5000 1905.0000 299.0000 1912.0000 300.7000 1926.0000 305.0000 1936.0000 307.9000 1948.0000 311.4000 1954.0000 314.7000 1959.0000 315.7000 1959.0000 318.2000 0.9400 1960.0000 319.2000 0.5000 1961.0000 319.7000 0.9600 1962.0000 320.7000 0.6500 1963.0000 321.3000 0.7400 1964.0000 322.0000 0.3000 1965.0000 322.4000 1.0700 1966.0000 323.4000 1.2600 1967.0000 324.7000 0.6800 1968.0000 325.4000 1.0400 1969.0000 326.4000 1.3700 1970.0000 327.8000 1.0000 1971.0000 328.8000 0.7800 1972.0000 329.6000 1.7900 1973.0000 331.4000 1.1800 1974.0000 332.5000 0.7600 1975.0000 333.0000 1.0900 1976.0000 334.0000 0.9000 1977.0000 335.3000 2.0700 1978.0000 337.4000 1.3400 1979.0000 338.7000 1.6400 1980.0000 340.0000 1.8400 1981.0000 342.0000 1.4400 1982.0000 343.6000 0.7100 1983.0000 344.0000 2.1600 1984.0000 346.4000 1.3500 1985.0000 347.8000 1.2200 1986.0000 349.0000 1.5100 1987.0000 350.0000 2.3500 1988.0000 352.8000 2.1100 1989.0000 355.0000 1.2800 1990.0000 356.2000 1.3100 1991.0000 357.6000 0.9900 1992.0000 358.5000 0.4500 1993.0000 359.0000 1.3100 1994.0000 360.3000 1.8900 1995.0000 362.2000 2.0100 1996.0000 364.2000 1.1900 1997.0000 365.4000 1.9800 1998.0000 367.4000 2.9500 1999.0000 370.0000 0.9100 2000.0000 371.2000 1.7800 2001.0000 373.0000 1.6000 2002.0000 374.6000 2.5500 2003.0000 377.1600 2.3100 2004.0000 379.5000 1.5400 2005.0000 382.0000 2.53 2006.0000 384.0000 2.00 D ata are from: D. M. Etheridge et al (1996) "Natural and anthropogenic changes in atmospheric CO2 over the last 1000 years from air in Antarctic ice and firn J. Geophys Res. 101, 4115 -4128, and direct measurement from the Mauna Loa station from 1959 Column 1 is the year, column 2 is the [CO2] in parts per million, and column 3 is the yearly increment in the period from 1959. Ice core data from Etheridge (up to 1959) from a series of Antarctic (Law Dome) cores.
    0 0

Prev  1  2  3  4  5  6  7  8  Next

You need to be logged in to post a comment. Login via the left margin or if you're new, register here.


The Consensus Project Website

THE ESCALATOR

(free to republish)


© Copyright 2024 John Cook
Home | Translations | About Us | Privacy | Contact Us