Climate Science Glossary

Term Lookup

Enter a term in the search box to find its definition.

Settings

Use the controls in the far right panel to increase or decrease the number of terms automatically displayed (or to completely turn that feature off).

Term Lookup

Settings


All IPCC definitions taken from Climate Change 2007: The Physical Science Basis. Working Group I Contribution to the Fourth Assessment Report of the Intergovernmental Panel on Climate Change, Annex I, Glossary, pp. 941-954. Cambridge University Press.

Home Arguments Software Resources Comments The Consensus Project Translations About Support

Bluesky Facebook LinkedIn Mastodon MeWe

Twitter YouTube RSS Posts RSS Comments Email Subscribe


Climate's changed before
It's the sun
It's not bad
There is no consensus
It's cooling
Models are unreliable
Temp record is unreliable
Animals and plants can adapt
It hasn't warmed since 1998
Antarctica is gaining ice
View All Arguments...


Username
Password
New? Register here
Forgot your password?

Latest Posts

Archives

Climate time lag

Posted on 8 July 2009 by John Cook

The previous post on CO2/Temperature correlation sparked some interesting comments on climate time lag. Unfortunately, the discussion went pear shaped with some ideological anti-intellectualism and things got a little bitchy after that. Nevertheless, climate time lag is an important subject that deserves more attention. Several metaphors were invoked in an effort to explain the phenomenon including stove hot plates and warming baths. However, I find the best way to understand climate time lag is a direct look at the science.

Our climate receives its energy from the sun. The amount of energy the planet absorbs from the sun is calculated from this equation:

Incoming Energy Flux= πR2S(1-A)

R is the radius of the earth, S (the solar constant) is the energy flux from the sun and A is the Earth's albedo - around 30% of sunlight is reflected back to space. The earth also radiates energy into space. The amount of energy emitted is a function of its temperature:

Outgoing Energy Flux = 4πR2εσT4

σ is Boltzmann's constant, T is the absolute temperature in degrees Kelvin and ε is the average emissivity of the earth. Emissivity is a measure of how efficiently the earth radiates energy, between 0 and 1. A blackbody has an emissivity of 1. Greenhouse gases lower the earth's emissivity. When the climate is in equilibrium, energy in equals the energy out.

S(1-A) = 4εσT4

What happens if the sun warms (solar constant S increases) then maintains a sustained peak? This is what occured in the early 20th century when solar levels rose then plateaued at a hotter state in the 1950's. The radiative forcing from the warming sun is not particularly large - between 0.17 W/m2 (Wang 2005) to 0.23 W/m2 (Krivova 2007) since the Maunder Minimum. Nevertheless, let's assume for the sake of argument that there is some amplifying effect (perhaps the cosmic ray effect on clouds) so that the warming sun has a substantial effect on global temperature.

When the sun warms, initially more solar energy is coming in than is radiating back out. The earth accumulates heat and it's temperature rises. As the earth warms, the amount of energy radiating back out to space increases. Eventually, the energy out matches the incoming solar energy and the planet is in equilibrium again. The time lag is how long it takes climate to return to equilibrium.

How long does the climate take to return to equilibrium? The lag is a function of climate sensitivity. The more sensitive climate is, the longer the lag. Hansen 2005 estimates the climate lag time is between 25 to 50 years.

How would climate have responded to the solar levels maxing out in the 50's? For the next few decades after the 50's, the radiative imbalance would've gradually decreased until the climate reached radiative equilibrium around the late 80's (give or take a decade). So how has our planet's radiative imbalance evolved over the latter 20th century?
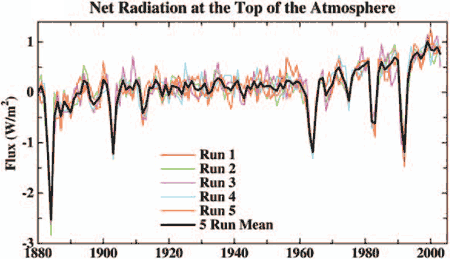

Figure 1: net radiation flux at the top of the atmosphere (Hansen 2005).

Hansen 2005 finds that the net radiative imbalance has steadily increased over the 20th century. There is no indication that the climate is heading towards equilibrium - quite the contrary. This is confirmed by satellite measurements of energy flux at the top of the atmosphere:
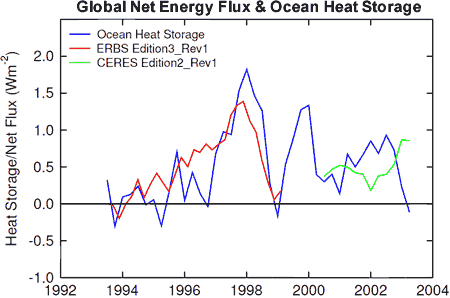

Figure 2: Global ocean heat storage (blue) against global net flux anomalies (Wong 2005).

The climate is not heading towards equilibrium. Rather, the radiative imbalance is increasing with the climate steadily receiving more energy than it is radiating back out into space. And this is where the true significance of climate time lag lies. Even if the radiative imbalance were to level off at its current rate of around 0.85W/m2, it would take several decades for the climate to return to radiative equilibrium. Based on this climate lag, Hansen 2005 calculates there is still 0.6°C warming still "in the pipeline".

0 0

Printable Version  |  Link to this page

Comments

Prev  1  2  3  4  5  6  7  Next

Comments 101 to 150 out of 339:

  1. whoops that table didn't format terribly well!
    1006.0000 279.4000
    
    means that the year is 1006 AD and the [CO2] atmospheric is 279.4 ppm
    2001.0000 373.0000 1.6000
    
    means that the year is 2001 AD, the [CO2] atmospheric is 373 ppm, and the increment for that year (2001) is 1.6 ppm.
    0 0
  2. Chris - Even the IPCC concentrates on the past 50 years. I think your being to precise with paleo graphicic data. I eyeballed in the Vostok data. Multi- decadal climate shift seem especially significant in the Arctic and North America as a whole. The graph of Arctic temperature is a goo d place to start. The following contains a more detailed discussion. The Significance of the 1976 Pacific Climate Shift in the Climatology of Alaska Brian Hartmann and Gerd Wendler http://ams.allenpress.com/perlserv/?request=get-abstract&doi=10.1175%2FJCLI3532.1
    0 0
  3. re #99 Robbo, your odd and unsupported assertions seem strangly divorced from reality. What are you think of? There isn't any non-arbitrary evidence that the climate has shifted post 1998. 1998 was just an anomalously warm year on a rising trend. If one considers the 10 record warm years (NASA Giss) all of the 2000's years are greater than all of the 1990's years except for 1998 and 1997: 2005 1998 2002 2003 2006 2007 2004 2001 2008 1997 2008, despite the large La Nina and the sun sitting stubbornly at the bottom of the solar cycle, is the 9th warmest year on record. 2009 will almost certainly be warmer than 2008 and so only the highly anomalous year of 1998 will be in the top ten. Despite your assertion of a climate shift and an extended cool period (none of which has any basis in non-arbitrary assesment), we seem to be entering the early stages of an El Nino. The El Nino/La Nina pattern doesn't seem to be different pre-1998 vs post-1998 [see *]. The sea surface temperature in June was the second warmest month on record [*]. [*]http://data.giss.nasa.gov/gistemp/graphs/SST.glob+Nino3.4.pdf Now of course one should be careful in drawing conclusions from short periods. But it's difficult to relate your assertions of cooling with the observation that despite the fact that we've just come through a strong La Nina, and the sun is right at the bottom of its solar cycle (I thought you guys were arguing for a very strong solar contribution to climate???) and seems to be sitting there in a rather protracted manner, that the global sea surface temperature is almost as high as in the very anomalous 1998.
    0 0
  4. Chris, the 0.5C number is an equilibrium number(after albedo etc...). Your "simple" calculation doesn't take that into account. Yes, the CO2 effect might *in equilibrium* cause a temperature increase of about 0.5C. Since most of that Also, in re:land use changes, while they may release more CO2, they have cumulativelty also changed albedo resulting in a cooling of around 1/2 the warming due to CO2 you are talking about(if memory serves). see for instance Brovkin et al. (1999) IAC, the reasons for suspecting a CRF climate-link was explored in many, many papers on Kirby, I don't see the point of talking about each one in detail. Fact is, you asked for reasons to suspect that there is something about CRF specifically that influences climate, I provided it. I don't have any desire to eliminate all doubt in your mind. Cheers, :)
    0 0
  5. Mr. Yobbo to you Chris - I don’t really think you have had time to read the Alaskan paper I referenced last. Nice link to the global SST. I am sure you recognise that the Nino 3.4 area is in the central Pacific Ocean. The graph is comparing global anomalies to central Pacific sea surface anomalies. It shows the dominance of changes in Pacific Ocean processes in the global mean. Here’s a good link to a number of relevant indices. http://ioc3.unesco.org/oopc/state_of_the_ocean/all/ I have a web site with some information of the relevance of these indices and a description of the physical processes involved in the Pacific dominance. Something I occasionally update as my interests develop. www.earthandocean.robertellison.com.au I think your graph illustrates the Pacific dominance well - and I will certainly go back to it. But we know that atmospheric temperature and total ocean heat content has plateaued on perhaps a thousand year high. Yep – it’s warm alright (except in Vostok). All that I am saying is that there is a very obvious 50 year cycle superimposed on background warming. The Nino 3.4 data clearly shows the difference between the 1946 to 1975 state and the 1976 to 1998 state. This can be more clearly seen in the Multivariate ENSO index of Wolter Claus (http://www.cdc.noaa.gov/people/klaus.wolter/MEI/ ) – or the related PDO index (http://jisao.washington.edu/pdo/PDO.latest ). Here’s a great paper on the interactions of ENSO and the PDO. A cool mode PDO is associated with more frequent and intense La Niña and, conversely, a warm mode is associated with more frequent and intense El Niño. Verdon, D. and Franks, S. (2006), Long-term behaviour of ENSO: Interactions with the PDO over the past 400 years inferred from paleoclimate records, Geophysical Research Letters 33: 10.1029/2005GL025052. Statistically, a weak El Niño or neutral conditions is more likely than a return to strong El Niño. The current Nino 3.4 anomaly is at 0.63 °C for the week ending July 11. The definition of an El Niño is sustained sea surface anomaly of greater than 0. 5°C for five months. Look at your Nino 3.4 graph at the bottom. The recent La Niña was not exceptional at all and we have barely scratched the surface an El Niño yet people are jumping on the bandwagon – and hoping like hell things will turn around. The PDO and ENSO states have been mixed since 1998. Swanson et al – uses a global sea surface temperature synchronisation technique to posit shifts in climate state. They were very pleased with themselves for using an objective technique rather than eyeballing it in. I think the terminology is useful and the methodology promising. http://www.uwm.edu/~kswanson/publications/2008GL037022_all.pdf http://www.realclimate.org/index.php/archives/2009/07/warminginterrupted-much-ado-about-natural-variability/and Dodgy sources I know – but what can you do? NASA nominated a switch to a cool PDO since 2008. The anchovy index indicates a shift in post 1998 - http://news.bio-medicine.org/biology-news-2/From-sardines-to-anchovies-and-back-in-50-years-5939-2/ Now I’m just being provocative – I’ll get the missus to spank me. Try instead: http://alexeylyubushin.narod.ru/Climate_Changes_and_Fish_Productivity.pdf You are very out of your depth here Chris Cheers Robbo
    0 0
  6. Can some 'global warmists by humans' care to explain this revealing sentence from Hansen 2005, claiming we have an energy imbalance in the atmosphere, and still have 0.6 degrees in the pipeline?? "First, the predicted energy imbalance due to increasing greenhouse gases has grown to 0.85 ± 0.15 W/m2". I'll clarify: How many circular assumptions kiddies are in this statment?? I count 3. 1. "predicted energy imbalance"..ie based on their being an energy imbalnace due to c02 driving T. 2."due to increasing greenhouse gases"-which assumes that they are driving T. No mention of the sun in the article, or heat lag from such. 3.Has grown-ie if you assume the first 2 you get the last-"has grown". Hansens 2005 paper is NOT a refute to the heat-lag sun dominant-driver argument, it is just a re-iteration of the creed of c02 driving warming. IE 'We know that the heat lag from the sun isnt approaching ewquilibrium because c02 is driving warming, which means there must be a 'predicted' energy imbalance'. A perfectly circular argument. Sounds like 'bankspeak' to me, I wouldn't invest my money in it. Nor should any country.
    0 0
    Response: You're misreading what Hansen is saying. If you read the whole paper so you have the full context, you'll see that Hansen 2005 is saying that:
    1. We predict there will be an energy imbalance due to increasing CO2.
    2. Empirical observations of increasing ocean heat confirm there is an energy imbalance.
    3. The energy imbalance, calculated from ocean heat measurements, is steadily growing and is currently at 0.85 W/m2
    The energy imbalance has been directly observed, independent of models, theories or predictions. In terms of the sun/heat lag issue, all we need to know is direct observations tell us the planet's energy imbalance has been gradually increasing over the past 40 years. Therefore, recent global warming cannot be a case of lagged solar warming which would show the energy imbalance approaching equilibrium (in fact, should've reached equilibrium approximately 20 years ago).
  7. Robbo, it's very simple. CO2 exists in the atmosphere at 387 ppm. We're not talking about freezing 100% CO2 in gas form.
    0 0
  8. Furthermore, we're looking at a pressure near or below 1 atmosphere. Carbonic snow on Earth? Only the so-called "skeptics" come up with that kind of stuff.
    0 0
  9. Mr Yobbo to you too Phillipe. OK...I did say broadly from a couple of numbers on Wikepedia. Do you know it's cold in Vostok? Cheers Robbo
    0 0
  10. re #105 Yes that's right shawnet. So of the 0.5 oC of anthropogenic warming contribution expected from the change in atmospheric CO2 in the long period between the Maunder minimum and 1940, we might expect to have realized 0.35 oC by 1950, with 0.1 - 0.15 "in the pipeline" to be realized sometime after 1950. Something like that. The solar contribution was around 0.2 oC....0.1 oC of the warming might be attributed to the release of negative forcing from the reduction of the large volcanic activity... So it's straightforward to obtain 0.6 oC of warming from our understanding of known forcings and their magnitudes. Of course the numbers are unlikely to have been exactly as I defined! But analyzing the data in line with empirical evidence and theoretical understanding (the known levels of greenhouse gases, the well-characterised estimates of radiative forcings, the current best estimates of solar irradiance changes and their forcings and so on)....gives us a value of warming that corresponds to pretty much the largest estimate of temperature change for the MM to 1950 period(Moberg's reconstruction - see my post # 88). We don't have to propose as yet uncharacterized contributions for which recent evidence suggest are less than likely to exist. You dont "see the point..(re Kirkby's presentations)....of talking about each one in detail". But isn't that what we should do if we're trying to establish (i) the veracity of a presentation with respect to scientific understanding...and (ii) use logic, empirical and theoretical analysis to understand causal relationships in the natural world?
    0 0
  11. Philippe, I'm often baffled by the stuff these guys come up with to avoid recognising the reality of greenhouse gas global warming. What was the point of "CO2 snow"? Did they think that all the excess CO2 was going to come tumbling out of the sky in the polar regions and so, even though CO2 wasn't causing any problem ("we call it plant food"), it certainly couldn't cause any problem as the CO2 snow flakes drifted down in the ultimate negative forcing. I mean, I know this sounds silly, but is that what they were saying?
    0 0
  12. Chris, that might work(if you ignore land use's cooling effects) except that now you can't explain the MWP. There are no anomalous processes that took about 40 ppm of CO2 out of the atmosphere to cool the MWP temp to the ones recorded in the LIA. As such, you are left with a solar forcing for this change and if the variation of SI doesn't change much(and the relationship to its variation wrt CRF is constant), then you're theory is in trouble. "You dont "see the point..(re Kirkby's presentations)....of talking about each one in detail". But isn't that what we should do if we're trying to establish (i) the veracity of a presentation with respect to scientific understanding...and (ii) use logic, empirical and theoretical analysis to understand causal relationships in the natural world?" The issues here are so complex and involved that it would take all year to go through them. For me, it is enough to point out the *multiple* studies show a match btw the phase and magnitude of climate changes and CRF. If you have a dispute with parts of this, (say for instance of the relationship btw cosmic rays and the intertropical convergence zone), that is your responsibility. Cheers, :)
    0 0
  13. Chris, that might work(if you ignore land use's cooling effects) except that now you can't explain the MWP. There are no anomalous processes that took about 40 ppm of CO2 out of the atmosphere to cool the MWP temp to the ones recorded in the LIA. As such, you are left with a solar forcing for this change and if the variation of SI doesn't change much(and the relationship to its variation wrt CRF is constant), then you're theory is in trouble. "You dont "see the point..(re Kirkby's presentations)....of talking about each one in detail". But isn't that what we should do if we're trying to establish (i) the veracity of a presentation with respect to scientific understanding...and (ii) use logic, empirical and theoretical analysis to understand causal relationships in the natural world?" The issues here are so complex and involved that it would take all year to go through them. For me, it is enough to point out the *multiple* studies show a match btw the phase and magnitude of climate changes and CRF. If you have a dispute with parts of this, (say for instance of the relationship btw cosmic rays and the intertropical convergence zone), that is your responsibility. Cheers, :)
    0 0
  14. I don't think it was even going that far David, although I wouldn't be surprised if it did. Not sure how exactly the all thing developped, I followed a link from another site. What's really funny is that a number of posters who pontificate on a regular basis at WUWT were arguing very seriously about the idea. That included Watts himself and some dude (Steven Goddard) who apparently is the go-to guy over there on matters of meteorology, although he is obviously not too good with phase diagrams. Eventually Watts got some sense hammered into his head by posters who knew better. All that happened on the science blog of the year, I kid you not. Yet, as idiotic as WUWT stuff can be, some of his regulars were suggesting that one of Spencer's more off-the-deep-end ideas about the carbon cycle should be removed from the site. That says someting about the ideas that Spencer puts on the intertubes. His published works are far less, if at all, challenging to the consensus model of Earth climate. He had a really funny one at Watts, on which he makes a complete hash of statistical analysis, trying to argue that the Oceans are actually the source of the increased atmospheric CO2. His fuzzy maths were addressed by Tamino on this post: http://tamino.wordpress.com/2009/01/19/a-bag-of-hammers/ It's kind of funny since Spencer is himself the go-to guy for many "skeptics" seeking appeal to authority. I believe that the post was subsequently removed, as often happens on wuwt.
    0 0
  15. I was talking about minute amounts of CO2 snow in mid winter in Vostok. Spencer has done an ernormous amount in satellite sensing at temperature. He still works for NASA. Likewise, CO2 has a direct ocean link. Meanwhile (LOL) our mates at realclimate - confirmed this week that the planet wasn't cooling. Just not warming for 20 or 30 years from 2000/2001.
    0 0
  16. re #114 That's not really logical shawnet – you seem to be following Jasper Kirkby's fallacy which is to assume that everything has a single cause! Far better to consider all of the factors known to contribute to these phenomena. Let's consider this in the light of the (N. hemispheric) paleoreconstruction that gives the largest temperature variation, even if this may well be an over-interpretation of the true variability. This is Moberg et al (2005) [*]. You can look at part of this in Jasper Kirkby's figure 2. All temperature anomalies are relative to the mid 20th century anomaly of 0 oC 1. The MWP. Jasper Kirkby truncates Moberg's reconstruction, but inspection of the original paper shows that (as far as the reconstruction indicates), the N. hemispheric temperature trundled along near an anomaly around -0.35 for hundreds of years, but then rises very slowly from around 700 AD to a value almost reaching 0 oC for a while centred around 1100 AD. 2. During the subsequent couple of hundred years the temperatures drifted back to the pre-MWP value (around -0.35 oC). 3. The LIA. From around 1400 to around 1550 the temperatures drifted down towards the value associated with the LIA (around -0.6 - -0.65 oC) where the temperature stayed for 100-150 years before starting to drift back up from around 1700. Causality: 4. First off we don't know for sure. Two other sources of uncertainty: (i) We've chosen the most extreme paleoreconstruction; the real temperature variation might not be so large as Moberg determines. (ii) The MWP and LIA seem likely to be predominantly N. hemisphere phenomena (see point 6 and 7 below). Therefore we don't know how much we need to explain these phenomena in terms of forcings involving global scale temperatures. Let's press on anyway: 5. The MWP. It's not clear whether there was a solar contribution. The sunspot record only starts around 1600. We can inspect Kirkby's Figure 2 again and see that the CRF proxy bears little relation to the MWP. The MWP temperature max was achieved well before 1100 when the CRF proxy started rising (I'm using Kirkby's inversion of the CRF where "rise" corresponds to "warming"). Much of the MWP warmth was dissipated before the CRF proxy started falling around 1250-1300. 6. A plausible explanation for the very slow and rather small temperature rise to the MWP was a small change in the Gulf Stream component of the thermohaline circulation [**, ***]. If the Gulf stream intensity increases more heat is drawn to the high Northern latitudes and vice versa. This doesn't require much, if any, global scale temperature variation, but is mostly a redistribution of heat. There's quite a bit of evidence for this contribution to late Holocene temperature, particulalry for reduced Gulf Stream flow during the LIA [***]. 7. So we can understand the MWP (if we wanted to) in terms of a slow, slow rise of the Gulf Stream intensity, and its slow return to the pre-MWP equilibrium. That only leaves an explanation for the LIA which is essentially a drift of the (N. hemisphere) temperature from the equilibrium near -0.35/-0.4 value to a value around -0.6/-0.65. We've already seen that the very anomalous solar changes might have given a reduced irraidiance contribution of up to -0.2 oC globally. There is also the evidence for a small reduction of Gulf Stream intensity [***]. The low volcanic acivity of thre MWP gave way to high and persistent volcanic activity during the LIA. We only need to "find" 0.2 – 0.25 oC of cooling. 8. So we don't need to conjure up any "magical " contributions. We don't have to consider a role for CO2 (there was a little contribution but not much) other than the very well-characterised and quite large contribution to the long term temperature rise from around 1800 to the mid 20th century base period. We could assume that the "recovery" of the LIA would take the N. hemisphere temperature back to the -0.35/-0.4 oC level. However the growing anthropogenic forcing made this overshoot to the mid 20th century 0 oC value. [*] Moberg, A et al. (2005) Highly variable Northern Hemisphere temperatures reconstructed from low- and high-resolution proxy data Nature 433, 613–618 (2005) [**] Lund DC et al. (2006) Gulf Stream density structure and transport during the past millennium, Nature 444, 601-604 [***] Denton GH and Broecker WS (2008) Wobbly ocean conveyor circulation during the Holocene? Quart. Sci. Rev. 27, 1939-1950.
    0 0
  17. re #113
    The issues here are so complex and involved that it would take all year to go through them. For me, it is enough to point out the *multiple* studies show a match btw the phase and magnitude of climate changes and CRF. If you have a dispute with parts of this, (say for instance of the relationship btw cosmic rays and the intertropical convergence zone), that is your responsibility.
    shawnet, since the CRF correlates with the other solar parameters (outwith Forbush events and perhaps some other events) one cannot assume that any historical correlations in 10Be and 14C isotopes with local climate proxies signify causal CRF-climate relationships. They could be irradiance-climate correlations. We've already seen that during the periods when we can actually assess this specific point in great detail, that the original CRF-cloud-temperature hypothesis is found to be wanting (see my post #71). As for my "responsibility", I'm just pointing out what I consider the scientific evidence shows! Nobody has any particular responsibility here (I think it's useful to be honest, clear and to provide supporting evidence for anything I say). Perhaps if you can take anything from my posts, you might consider that I'm demonstrating why, despite some extraordinary self-publicising by a couple of its advocates, that rigorous scientific analysis of climate contributions doesn't include this ill-characterised and unquantitated hypothesis.
    0 0
  18. There is no CO2 snow falling on Earth at Vostok, or anywhere else, even in infinitesimal amounts. If you want to argue that it is physically possible on this planet to have atmospheric CO2 naturally snow, go right ahead. Spencer has done indeed some work and the serious work he has done is a far cry from the stuff he allows himself to post on the internet. Check the link and look at his demonstration if you don't believe me. "CO2 has a direct ocean link." Obviously. What are you trying to say? The oceans are the largest net carbon sink on the planet. Spencer has tried to argue that they are instead a source of atmospheric CO2, against all evidence and all known physical processes. Your interpretation of the RC post is more a reflection of your ideology and bias than of the actual content of the post.
    0 0
  19. Just a couple of quick points here. Whether or not thermohaline circulation is implicated rather begs the point. What causes the circulation to vary this massively? If it's not solar, then what? "shawnet, since the CRF correlates with the other solar parameters (outwith Forbush events and perhaps some other events) one cannot assume that any historical correlations in 10Be and 14C isotopes with local climate proxies signify causal CRF-climate relationships. They could be irradiance-climate correlations. We've already seen that during the periods when we can actually assess this specific point in great detail, that the original CRF-cloud-temperature hypothesis is found to be wanting (see my post #71)." Chris, you've just spent the last few posts arguing that solar contributions to climate change are negligible. For the LIA, the increase is due to CO2 from land use changes(ignoring the fact that those same land use changes also cool the climate) and for MWP the cause is the TH circulation. Are we then supposed to believe that for other previous correlations solar proxies actually have a causative effect? This would, of course, imply that the that the relationship btw CRF and solar irradiance was different in the past, than it is now. I don't think so. IAC, as I have said before, this particular line of argument is but **one** piece of the CRF picture. Sure you can ignore the CRF-climate correlation of the last 1000 years and treat them as coincidental to other effects(land use changes or some other phenomenon), but to have a chance of having an accurate theory you have to explain all the other correlations that Kirkby mentions. I submit that were you to attempt this, your final theory would be a massive kludge. Cheers, :)
    0 0
  20. re: response to 107: I did read the whole Hansen 2005 paper, and Wong 2005,and I'm not at all convinced that so-called energy imbalances are 'measured' and not modelled-in fact I think Hansen 2005 is actually saying that he does 'model' the imbalance, both current and predicted. Hansen 2005 states that he derives 'predicted' energy imbalance from greenhouse gas models. "First, the predicted energy imbalance DUE TO INCREASING GREENHOUSE GASES has grown to 0.85 ± 0.15 W/m2". (Hansen 2005) (although he also conveniently often fuses the 2-'calculated' and 'predicted'). However, you state the energy imbalance of the climate is "measured" independant of theories, models and predictions: "The energy imbalance has been directly observed, independent of models, theories or predictions". (THIS IS WRONG, IT IS "CALCULATED", USING A MODELLED RELATIONSHIP BETWEEN OCEAN HEAT, ATMOSPHERE T, AND OUTGOING AND INCOMING SOLAR ENERGY.MOREOVOER, this modelling of Hansen 2005 does not take into account solar changes and heat lags in 20th century, it is solely MODELLED using strong c02 forcings of the 20th century. Contrary to what you state, there is NO way this relationship between ocean heat, climate T, and incoming-outgoing heat can be 'measured', outside of modelling, and assumptions. Moreover, the predictions or Hansen 2005 of future energy imbalances are based on greenhouse gas models, further IMPOSED on this exisitn modelling. It is an exquisite case of modelling on modelling on modelling. THERE IS NO INVESTIGATION, OR INPUT FROM SOLAR EFECTS IN THE 20TH CENTURY IN THE HANSEN 2005 PAPER-NOT EVEN MENTIONED. Your points: 1."We predict there will be an energy imbalance due to increasing CO2". (THIS IS A MODEL, AS YOU SAY, BASED ON MODELLED GREENHOUSE -T RELATIONSHIPS IN THE 20TH CENTURY-WITHOUT TAKING INTO AFFECT THE SUN-AS ALSO DOES HANSEN 2005) 2."Empirical observations of increasing ocean heat confirm there is an energy imbalance". (THIS 'IMBALANCE' IS DERIVED FROM GREENHOUSE GAS MODELS IN THE 20TH CENTURY-THERE IS NO "CONFIRMATION" UNLESS ONE FIRST ASSUMES THAT THE SUN HAS HAD LITTLE/NO EFFECT, WITH NO SOLAR HEAT LAGS-WHICH CNACEL THE IMBALANCE) 3."The energy imbalance, calculated from ocean heat measurements, is steadily growing and is currently at 0.85 W/m2" (A MEANINGLESS FIGURE BASED ON MODELS BETWEEN CLIMATE'S CURRENT T AND OCEAN HEAT-AS DERIVED FROM MODELLED PAST RELATIONSHIPS OF SUN-OCEAN RELATIONSHIPS-WONG 2005) "In terms of the sun/heat lag issue, all we need to know is direct observations tell us the planet's energy imbalance has been gradually increasing over the past 40 years". (NO, OCEANS HAVE BEEN HEATING IN LINE WITH SOLAR ACTIVITY AND HEAT LAG-THIS IS NOT INVESTIGATED IN HANSEN 2005 PAPER, IT IS ONLY ASSUMED TO BE DUE TO C02). "Therefore, recent global warming cannot be a case of lagged solar warming which would show the energy imbalance approaching equilibrium (in fact, should've reached equilibrium approximately 20 years ago)". IT IS ONLY ASSUMED TO BE NOT BE APPROACHING EQUILIBRIUM IF ONE FIRST ASSUMES T IS BEING DRIVEN BY C02 EFFECTS, WHICH THEN PRODUCES THE "IMBALANCE", THEN IS NO INVESTIGATION MADE OF SOALR ACTIVITY, SOLAR LAGS, AND EFFECTS ON THIS ON OCEAN HEAT IN 20TH CENTURY. Heat solar lag effects would produce increasing ocean heat content, which would level off, as it has done since the early 2000s in the ocean-land T. There is no 'imbalance', unless one models the ocean-atmosphere-solar system as being driven by c02 - the paper by Hansen 2005 does NOT address solar heat lag, solar effects, it only assumes that there is a long climate heat lag from c02 (not the sun), and then assumes an imbalance from this effect, then predicts a long term lag from this current, modelled imbalance, ALL BASED ON GREENHOUSE GAS MODELLING. Circular, and willfully ignorant. Hansen 2005 paper does not refute solar heat lag, because Hansen himself does not address it in the paper. He states that he uses greenhosue gas modelling. "First, the predicted energy imbalance DUE TO INCREASING GREENHOUSE GASES has grown to 0.85 ± 0.15 W/m2". In other words he assumes that past century T rise is by greenhouse gases first, which has therefore created a "predicted energy imbalance", by "increasing greenhouse gases". If we assume an energy imbalanace, then we get an energy imbalance. Mindbloggingly circular and stupid. There is no evidence to conclude, as he does, that the there is an energy imbalance at present, unless one assumes that T is rising by C02 in the first place, as he states above, that he does. This is not proof, is is circular reasoning. If we assume an energy imbalanace, then we get an energy imbalance. He uses the same argument further down to get a figure of 0.6 degrees C still 'in the pipeline' ie from ocean heat content, ie imbalanced with c02 forcing. NOWHERE does he discuss or address or acknowldedge the fundamental assumptions of the models he bases this figure on, ie that he ASSUMES T rise is being driven by c02, and not the sun. I am not convinved that, both the paper of WONG 2005 and Hansen 2005- that they don't model an "imbalance" based on greenhouse gas modelling, and also neither address solar effects and heat lags. Climate is approaching equilibrium, T has levelled off since the early 2000s, in both land and ocean, and this so-called large climate 'imbalance' is only in the heads of the human-induced global warmists, getting bigger every day as they attempt to explain why the earth is no longer heating sicne the early 2000s.There may be some ocean heat lag leftfrom solar actvity in 20h century, particularly in the southern hemisphere, but c02 is playing very little effect, as can be seen over the last decade as T from the sun levels off-co2 has been trying to heat the earth sicne this time, but it is just way too small to have any effect. There is no large current energy imbalance, this is a conclusion based on assumed strong c02 forcing, conceptually 'stealing' the real climate heat lag discovered from the sun, and which 'model' does not even bother investigating solar activity and solar heat lags (Hansen 2005 Wong 2005).
    0 0
  21. Sorry for the capital letters in the last post, I just wanted to differentiate my words from others. I wont do it anymore.
    0 0
  22. Chris, you've just spent the last few posts arguing that solar contributions to climate change are negligible. For the LIA, the increase is due to CO2 from land use changes(ignoring the fact that those same land use changes also cool the climate) and for MWP the cause is the TH circulation......
    Please don't misrepresent straightforward posts shawnet. What are you hoping to achieve by distortion? Nowhere did I say that solar contributions to climate change are negligible. I have already stated that one cannot understand the paleotemperature/greenhouse relationships over the long earth history without taking into account the steady long term increase in solar output during earth history. I've pointed out the research of solar scientists that the evidence supports a solar contribution of around 0.1 oC to 20th century warming and that the solar contribution to the around 0.6 oC of warming from the Maunder minimum to the mid 20th century was likely around 0.2 oC. As far as the evidence goes, the reduction in N. hemisphere temperature from the baseline -0.35/-0.4 equilibrium temperature to a value near -0.6 oC was likely largely a solar effect as was its recovery back to the equilibrium level near -0.35/-0.4 oC. I didn't say that "For the LIA, the increase is due to CO2 from land use changes" did I shawnet. I pointed out that the well characterised anthropogenic rise in atmospheric from the start of the 19th century to the mid 20th century, the early sources of which were from land use changes, is expected to give a temperature rise approaching 0.5 oC at equilibrium, perhaps giving around 0.35 oC by 1950 with the rest "in the pipeline" to be realized post-1950. I pointed out the likely solar contribution (see previous paragraph) and a volcanic contribution, and cited some empirical evidence for a ocean/atmospnhere heat transfer (Gulf stream) reduction which may have contributed to high N hemisphere cooling during the LIA. I even said in relation to the MWP/LIA "We don't have to consider a role for CO2 (there was a little contribution but not much) other than the very well-characterised and quite large contribution to the long term temperature rise from around 1800 to the mid 20th century base period." And yet you paraphrase my comments on this subject to infer that I stated that "For the LIA, the increase is due to CO2 from land use changes…Go figure! You did ask a relevant question about about the possible contributions of changes in ocean circulation that could have given rise to the around 0.2-0.25 oC rise in high N. hemisphere temperature and the 0.2-0.25 oC drop in high N. hemisphere during the LIA, according to the Moberg reconstruction. This has been addressed in a recent detailed analysis of ocean and atmospheric circulation in the North Atlantic during the MWP and the LIA: Valérie Trouet et al. (2009) Persistent Positive North Atlantic Oscillation Mode Dominated the Medieval Climate Anomaly Science 324, 787-80 http://www.sciencemag.org/cgi/content/abstract/324/5923/78 (abstract below) What might be the origin of these circulation changes? The authors conclude:
    "The persistent positive phase reconstructed for the MCA appears to be associated with prevailing La Niña–like conditions possibly initiated by enhanced solar irradiance and/or reduced volcanic activity (21) (Fig. 4D) and amplified and prolonged by enhanced AMOC."
    (AMOC being "Atlantic meridional overturning circulation") Solar irradiance and volcanic activity. Again no need to postulate a role for the unsubstantiated CRF hypothesis ------------------------------------------------------- abstract: The Medieval Climate Anomaly (MCA) was the most recent pre-industrial era warm interval of European climate, yet its driving mechanisms remain uncertain. We present here a 947-year-long multidecadal North Atlantic Oscillation (NAO) reconstruction and find a persistent positive NAO during the MCA. Supplementary reconstructions based on climate model results and proxy data indicate a clear shift to weaker NAO conditions into the Little Ice Age (LIA). Globally distributed proxy data suggest that this NAO shift is one aspect of a global MCA-LIA climate transition that probably was coupled to prevailing La Niña–like conditions amplified by an intensified Atlantic meridional overturning circulation during the MCA.
    0 0
  23. a bit of a formatting error in my post just above - hope this works better!
    Chris, you've just spent the last few posts arguing that solar contributions to climate change are negligible. For the LIA, the increase is due to CO2 from land use changes(ignoring the fact that those same land use changes also cool the climate) and for MWP the cause is the TH circulation......
    Please don't misrepresent straightforward posts shawnet. What are you hoping to achieve by distortion? Nowhere did I say that solar contributions to climate change are negligible. I have already stated that one cannot understand the paleotemperature/greenhouse relationships over the long earth history without taking into account the steady long term increase in solar output during earth history. I've pointed out the research of solar scientists that the evidence supports a solar contribution of around 0.1 oC to 20th century warming and that the solar contribution to the around 0.6 oC of warming from the Maunder minimum to the mid 20th century was likely around 0.2 oC. As far as the evidence goes, the reduction in N. hemisphere temperature from the baseline -0.35/-0.4 equilibrium temperature to a value near -0.6 oC was likely largely a solar effect as was its recovery back to the equilibrium level near -0.35/-0.4 oC. I didn't say that "For the LIA, the increase is due to CO2 from land use changes" did I shawnet. I pointed out that the well characterised anthropogenic rise in atmospheric from the start of the 19th century to the mid 20th century, the early sources of which were from land use changes, is expected to give a temperature rise approaching 0.5 oC at equilibrium, perhaps giving around 0.35 oC by 1950 with the rest "in the pipeline" to be realized post-1950. I pointed out the likely solar contribution (see previous paragraph) and a volcanic contribution, and cited some empirical evidence for a ocean/atmospnhere heat transfer (Gulf stream) reduction which may have contributed to high N hemisphere cooling during the LIA. I even said in relation to the MWP/LIA: "We don't have to consider a role for CO2 (there was a little contribution but not much) other than the very well-characterised and quite large contribution to the long term temperature rise from around 1800 to the mid 20th century base period." And yet you paraphrase my comments on this subject to infer that I stated that "For the LIA, the increase is due to CO2 from land use changes…Go figure! You did ask a relevant question about about the possible contributions of changes in ocean circulation that could have given rise to the around 0.2-0.25 oC rise in high N. hemisphere temperature and the 0.2-0.25 oC drop in high N. hemisphere during the LIA, according to the Moberg reconstruction. This has been addressed in a recent detailed analysis of ocean and atmospheric circulation in the North Atlantic during the MWP and the LIA: Valérie Trouet et al. (2009) Persistent Positive North Atlantic Oscillation Mode Dominated the Medieval Climate Anomaly Science 324, 787-80 http://www.sciencemag.org/cgi/content/abstract/324/5923/78 (abstract below) What might be the origin of these circulation changes? The authors conclude:
    "The persistent positive phase reconstructed for the MCA appears to be associated with prevailing La Niña–like conditions possibly initiated by enhanced solar irradiance and/or reduced volcanic activity (21) (Fig. 4D) and amplified and prolonged by enhanced AMOC."
    (AMOC being "Atlantic meridional overturning circulation") Solar irradiance and volcanic activity. Again no need to postulate a role for the unsubstantiated CRF hypothesis ------------------------------------------------------- abstract: The Medieval Climate Anomaly (MCA) was the most recent pre-industrial era warm interval of European climate, yet its driving mechanisms remain uncertain. We present here a 947-year-long multidecadal North Atlantic Oscillation (NAO) reconstruction and find a persistent positive NAO during the MCA. Supplementary reconstructions based on climate model results and proxy data indicate a clear shift to weaker NAO conditions into the Little Ice Age (LIA). Globally distributed proxy data suggest that this NAO shift is one aspect of a global MCA-LIA climate transition that probably was coupled to prevailing La Niña–like conditions amplified by an intensified Atlantic meridional overturning circulation during the MCA.
    0 0
  24. Chris, perhaps I have misunderstood you somewhere, so a point of clarification here. You say that 0.2C was caused by solar changes, so working backwards, this implies approximately 1.5W/m2 increase in TSI by my back of the envelope calculation(1.5W/m2 translates into about a 0.24W/m2 forcing at the top of the atmosphere(globally averaged), which in turn translates into ~.17 deg C. at 0.7Wm2/deg C. I confess I didn't look too closely at every reference you provided, so I may have missed the TSI reconstruction you are using. My understanding is that long-term TSI variations(no matter which one) are currently expected to be much less than that. The source for my conclusions is based on Kirkby's position that TSI varies (in recent times) by about 0.5W/m2. There is clearly a contradiction btw *that number* and the claim that solar influences led to a 0.2C temperature difference. If the 0.5W/m2 number is accurate, then a long-term correlation btw solar and climate influences needs some sort of amplification. BTW, the point about ascribing climate changes to changes in the ocean was that it is begging the question. Clearly, ocean temperature fluctuations have a major impact on the climate, but what causes the ocean's behavior to change? There is no contradiction btw saying that NAO was consistently positive in the MWP and saying that MWP was warmer because of a solar influence. Cheers, :)
    0 0
  25. Oops, I misread the last bit of your post. Please ignore the last paragraph of my previous post. SOrry.
    0 0
  26. response to response to 106: "The energy imbalance has been directly observed, independent of models, theories or predictions" This is patently false, and you know it. The 'energy imbalance' has been derived and modelled from all the usual suspects, ie -greenhouse gases, aerosols, and such like. Reference: climate-science.org/PDF/Earth.EnergyImbalance.pdf. You have lost credibility. The energy imbalance of Hansen 2005 is modelled, it is not an "observation", and is certainly not "independant of models, theories and predictions". The model, (even Hansen and co use the word) assumes strong c02 forcing, to arrive at the figure. Solar heat lags are not mentioned or investigated. With a solar heat lag the ocean would indeed warm, but the derived imbalance is actually based on assumed c02 forcing, and then 'checked' by model runs, also assuming c02 forcing. Oceans warming is probably correct, the imbalance estimate is a model. So much for your argument, and ability to properly investigate assumptions, the above is just a re-iteration of the creed of c02, nothing more.
    0 0
  27. re #124 shawnet, Kirkby simply isn't a good guide for reliable understanding of these issue as we've seen already. I used the reconstruction of Judith Lean: Y.-M. Wang, J. L. Lean and N. R. Sheeley, Jr. Modeling the Sun's Magnetic Field and Irradiance since 1713 Astrophysical J. 625 522-538 Lean, J. L., and D. H. Rind (2008), How natural and anthropogenic influences alter global and regional surface temperatures: 1889 to 2006, Geophys. Res. Lett., 35, L18701 Here's the sentence on page 6 of Kirkby which you have used to make your calculation: "The increase in irradiance amounts to less than 0.5 W/m^2, which corresponds to about 0.08 W/m^2 at the top of the atmosphere, globally averaged (Fig. 5). Assuming a climate sensitivity of 0.7 K/W/m^2, this would contribute less than 0.06C of the estimated 0.6 C mean global warming between the Maunder Minimum and the middle of last century, before significant anthropogenic contributions could be involved." Those two sentences are packed with inaccuracies: [ONE] the data in his "Fig 5" shows two reconstructions of Lean (1995 and 2002). However the reference to the Lean 2002 data refers to a paper (his ref 6) in which Lean only analyzes the solar irradiance back to 1840. [TWO] the data in his Figure 5 assigned to Lean 2002, looks more like a solar irradiance reconstruction that Lean published a few years later in 2005 in which she and her collaborators explicitly considered irradiance changes since the Maunder Minimum (it's the one I used): Y.-M. Wang, J. L. Lean and N. R. Sheeley, Jr. Modeling the Sun's Magnetic Field and Irradiance since 1713 Astrophysical J. 625 522-538 Lean's analysis gives a cycle-average reduction in the total solar irradiance at the time of the Maunder Minimum of ~ 1 W/m^2 (rather than Kirkby's "…less than 0.5 W/m^2). 1 W/m^2 gives a temperature change of 1 * 0.25 (geometry)* 0.7 (albedo)* 0.8 (sensitivity) or 0.14 oC. (see point [FOUR] for a bit more on this analysis). [THREE] We've already seen that Kirkby's statement about "…. the middle of last century, before significant anthropogenic contributions could be involved." is entirely bogus. The anthropogenic contribution to surface temperature results from a pre-"middle of last century" change in atmospheric CO2 from 280 ppm (pre-industrial) to 310 ppm (in 1940). This gives near 0.44 oC of warming at equilibrium within a climate sensitivity of 3 oC. [FOUR] Note that the ~ 1 W/m^2 of Wang et al. (2005) is a general interpretation from two analyses using slightly different models that Wang et al made. One analysis gives a TSI cycle-averaged TSI change at the Maunder Minimum of 1.0 W/m^2; the other (containing a secular varying ephemeral region background) gives a change of 1.4 W/m^2. 1.4 W/m^2 gives almost exactly 0.2 oC temperature contribution to reduced surface temperature at the Maunder Minimum from irradiance variation using our parameters.. [FIVE] Again there are several uncertainties. We've already seen that the MWP and the LIA are predominantly defined in the N. hemisphere and we've used the paleoreconstruction having the largest variation (Moberg et al. (2005)). The atmospheric/ocean current changes that seem to be involved in MWP/LIA N hemisphere temperaturevariation (see my post just above) likely involve large changes in heat transfer to the high Northern latitudes, and the volcanic and solar influences on these might be amplified somewhat by albedo effects from slow Arctic sea ice regression/expansion over the long time scales involved. So the climate sensitivity might be a tad larger than the 0.8 W/m^2 over the very long timescales encompassing MWP/LIA temperature variation..
    0 0
  28. Re: #115 Robbo: "Spencer has done an ernormous amount in satellite sensing at temperature. He still works for NASA. " He even won an award for this work in the mid-90's. That was before a series of very large and embarassing errors were discovered, some by others, in the UAH data product. The errors have been numerous, of great magnitude on the global trend, and with corrections going almost all in the same upward direction. http://www.nsstc.uah.edu/data/msu/t2lt/readme.18Jul2009 Robbo: "Dr Roy Spencer has always been measured and rasonable." Hardly. When his data showed a per decade cooling trend, he uncritically accepted that it was entirely correct, all other data was wrong, and GCMs were mainly bunk - displaying the opposite characteristics of a good measured and reasonable skeptic. Article: Spencer and co-author Dr. William Braswell of Nichols Research Corporation have great confidence in the quality of their satellite data. "We've concluded there isn't a problem with the measurements," http://science.nasa.gov/newhome/headlines/essd5feb97_1.htm This is one reason why it's odd that he's still the go-to-reference for some. What's a bit more strange is I still see the 1997 NASA link above being cited by skeptics on occasion.
    0 0
  29. All the Spencer link form 1997 says is that a more complex vertical temperature structure is evident in the satellite data than is evident in the land based observations. Spencer still does this work for NASA. 'Analysis of the satellite record that began in 1979 indicates that global temperatures are increasing in the mid-troposphere, but the magnitude of the trend differs based on the analysis methods used in adjusting for factors such as orbital decay and inter-satellite differences. Mid-tropospheric and lower stratospheric temperature data are collected by NOAA's TIROS-N polar-orbiting satellites and adjusted for time-dependent biases by the Global Hydrology and Climate Center at the University of Alabama in Huntsville (UAH). An independent analysis is also performed by Remote Sensing Systems (RSS) and a third analysis has been preformed by Dr. Qiang Fu of the University of Washington (UW) (Fu et al. 2004)**. Not sure what the problem is? Let's see if I have got the Swanson paper right. There was a 1976/77 climate shift and one that occured in 2000/2001. Ignoring the end points as climate shifts - gives an underlying warming trend - between 1977 and 1997 of 0.1 degrees centigrade per decade. Not enough to be a serious concern. The current warming hiatus is likely to last 20 to 30 years. Yes I think that's everything.
    0 0
  30. The so called 'energy imbalance', ie the warming oceans over the last ~50 years, simply confirms the solar heat lag effect. (eg like air warming between 1 and 3 pm on any normal day). There is no 'energy imbalance' (eg like air warming between 1 and 3 pm on any normal day). Now that the oceans T appear to be flattening and cooling since early 2000s (ie like after 3pm on any normal day-already invalidating Hansen's prediction of "record-breaking T" in the 3 or 4 years after 2005- "the climate system is now being pushed so hard that I have suggested that we can say with confidence that 2005 will have a warmth comparable to that of 1998, and the remarkable 1998 global temperature record will soon be broken, if not this year than within the next several years.)," (http://junkscience.com/Greenhouse/imbalance_release.pdf) Another failed prediction of Hansen...thus, because the 'energy imbalance' is simple a heat lag efect from the sun, the air T will not rise much further,there is no 'imbalance', and oceans will probably cool further. This solar heat lag is really so simple, yet it is not investigated either here, or by Hansen. I he had of bothered to model solar heat lag into his imbalance he would have found it fitted nicely with the energy that has gone into the ocean from the solar peak in the 20th century, with heat lag. How the oceans are cooling, in line with the subsiding heat lag effect and subsiding sun. Too simple for 'global warmists by humans' to even bother investigating.
    0 0
  31. Chris; "[FOUR] Note that the ~ 1 W/m^2 of Wang et al. (2005) is a general interpretation from two analyses using slightly different models that Wang et al made. One analysis gives a TSI cycle-averaged TSI change at the Maunder Minimum of 1.0 W/m^2; the other (containing a secular varying ephemeral region background) gives a change of 1.4 W/m^2. 1.4 W/m^2 gives almost exactly 0.2 oC temperature contribution to reduced surface temperature at the Maunder Minimum from irradiance variation using our parameters." So, IOW, if you take the highest value for TSI variation in the last few hundred years, you can account for the solar induced temperature change. However, if your reconstruction is on the high side, there will still be room for a solar amplification of some sort. Further, none of this really explains the close long term correlations btw precipitation and cosmic rays(as, for instance, with changes in the ITCZ and there relationship to Bond events). If cosmic rays had no effect on cloudiness, you would not expect this correlation to be present(and Bond events are much larger in magnitude than can be produced by TSI changes alone). As I keep saying, current climate changes are but one line of evidence for the CRF climate connection. "[FIVE] Again there are several uncertainties. We've already seen that the MWP and the LIA are predominantly defined in the N. hemisphere and we've used the paleoreconstruction having the largest variation (Moberg et al. (2005)). The atmospheric/ocean current changes that seem to be involved in MWP/LIA N hemisphere temperaturevariation (see my post just above) likely involve large changes in heat transfer to the high Northern latitudes, and the volcanic and solar influences on these might be amplified somewhat by albedo effects from slow Arctic sea ice regression/expansion over the long time scales involved. So the climate sensitivity might be a tad larger than the 0.8 W/m^2 over the very long timescales encompassing MWP/LIA temperature variation.." Just for the record, I don't buy these explanations for the variance in Northern-Southern hemisphere temp cahnges. I don't think anyone can find any evidence that the Southern Hemisphere has ever had a larger climate response in any period, than the Northern one did. There is a very simple reason for this IMO, the Northern hemisphere has more land than the Southern one, and land is more sensitive than water to changes in forcing. One only needs to look at maps of the ice extent in the N & S hemispheres during the last ice age to see what I mean. Cheers, :)
    0 0
  32. re #131 shawnet, we've already seen that there is some uncertainty in the analysis of temperature changes during the time of the MWP/LIA, in solar irradiance reconstruction and so on. So whether the solar irradiance contribution is 0.14 oC or 0.2 oC is pretty immaterial; either of these is entirely consistent with the scientific evidence and it's hair-splitting to suggest that one or other (0.06 oC over hundreds of years!) is more correct. The point is that the currently best evidence for solar irradiance changes indicates that they are significant, and these, plus our understanding of likely greenhouse gas contributions to temperature change over this period, plus the evidence for ocean/atmosphere circulation contributions (see my post #123), allows a pretty self-consistent interpretation of (N. hemisphere) temperature variation over the period we've been discussing. Sadly, Kirkby gives a completely false picture of the science on this subject since he resolutely pretends that there has been no role for CO2 changes in paleotemperature variation, and completely misrepresents current science on solar contributions (let alone the other contributions we've discussed). There isn't any evidence for a CRF contribution during these periods whereas Kirkby insinuates that it's almost entirely CRF driven. That's not to say that there wasn't a small CRF, or other non-irradiance contribution…there just isn't any evidence for it, nor is there a requirement for it in order to understand the phenomena. I don't understand your point about "variance in Northern-Southern hemisphere temperature changes". The point I'm making based on the analysis of the Trouet paper in my post #123 (and quite a wealth of other work this subject, none of which is referred to by Kirkby who seems reluctant to give his readers a reliable account of research on this subject)….is that changes in N. hemisphere temperatures during the MWP/LIA periods likely have contributions from variations in heat trasfer from the equator to the high Northern latitudes. That doesn't imply that the S.H. had "….a larger climate response in any period, than the Northern one did." Far from it. In fact we expect that the climate response to be significantly less in the S.H. during changes in heat transfer to the high Northern latitudes for exactly the reason you suggest – there is a lot more ocean in the S.H. Again that's consistent with the evidence that the MWP/LIA were largely N. hemisphere phenomena and were likely fairly insignificant in terms of global scale warming/cooling. That's not to say that there isn't also a lot of evidence over very long periods for N. hemisphere – S. hemisphere "see-saw" with compensating temperature rises and falls, or at least hemispherically-dominant phenomena. That's partly the theme of the Denton/Broecker paper in my post #116. For example the Dansgaard-Oeschger events that indicate large periodic temperature fluctuations in the Greenland cores are barely represented in Antarctic cores, and these are also interpreted in terms of exactly the same ocean/atmosphere heat transfer varaibility that likely underlie much of the MWP/LIA temperature variation. It's just that the D/O events entailed far more dramatic heat transfer changes possibly involving complete shutdown and later on rapid resumption of the thermohaline circulation in the N Atlantic. Not sure what you mean by "current climate changes". If you truly mean "current" (i.e. contemporary) then these have essentially zero evidence for a casual CRF connection (we've discussed this at great length here!). Notice that the ITCZ changes are understandable in terms of the ocean/atmosphere heat transfer changes of the sort that Trouet et al provide additional strong evidence for (my post #123). As they suggest the trigger for these may be ocean surface heat changes arising from solar irradiance and volcanic forcing. It's unnecessary to attempt to sneak in spurious CRF contributions when these have been shown likely to be insignificant. Kirkby's own analysis indicates that these can't have made significant contributions to the MWP phenomenon, and they're certainly not required for the LIA as we've discussed. I'm not going to comment on Bond events (other than in relation to D/O events for which Bond events might be a Holocene-scale minor continuation). I don't know enough about these and haven't got time to do much hunting in the scientific literature (last Thurs to Sat I was ill at home and found lots of time to do this – as well as watching the Open, the Ashes and the Tour de France!). If you know of any scientific literature that provides a good account of these phenomena as well as a discussion of potential causality I'd be more than happy to read these…..
    0 0
  33. Chris:"That's not to say that there isn't also a lot of evidence over very long periods for N. hemisphere – S. hemisphere "see-saw" with compensating temperature rises and falls, or at least hemispherically-dominant phenomena. That's partly the theme of the Denton/Broecker paper in my post #116. For example the Dansgaard-Oeschger events that indicate large periodic temperature fluctuations in the Greenland cores are barely represented in Antarctic cores, and these are also interpreted in terms of exactly the same ocean/atmosphere heat transfer varaibility that likely underlie much of the MWP/LIA temperature variation. It's just that the D/O events entailed far more dramatic heat transfer changes possibly involving complete shutdown and later on rapid resumption of the thermohaline circulation in the N Atlantic." The thermohaline explanation is pretty speculative frankly, but IAC, the point is that the see-saw doesn't operate symmetrically on both sides of the equator. The Northern side fluctuates much more than the Southern side(and the Southern side doesn't really go up, when the Northern side goes down). ""I'm not going to comment on Bond events (other than in relation to D/O events for which Bond events might be a Holocene-scale minor continuation). I don't know enough about these and haven't got time to do much hunting in the scientific literature (last Thurs to Sat I was ill at home and found lots of time to do this – as well as watching the Open, the Ashes and the Tour de France!). If you know of any scientific literature that provides a good account of these phenomena as well as a discussion of potential causality I'd be more than happy to read these…" Bond events aren't minor. Do you know of a minor change that would cause a 2C change in the Atlantic ocean. Certainly, it couldn't be solar which can only change irradiance by about 0.2C or so. In that context, the correlation btw such changes and CRF makes no sense. IAC, good luck with your search. Let me know what you find out when you have explored other avenues of evidence. Here is a pretty good place to start IMO - Bond, G.C., B. Kromer, J. Beer, R. Muscheler, M.N. Evans, W. Showers, S. Hoffmann, R. Lotti- Bond, I. Hajdas and G. Bonani, Persistent solar influence on North Atlantic climate during the Holocene, Science 294, 2130–2136 (2001). Cheers, :)
    0 0
  34. #130 - "Now that the oceans T appear to be flattening and cooling since early 2000s " How many cubic miles of land ice are running into the oceans as ice-cold water in recent years? Has this number been increasing? Wouldn't this have some effect on ocean temps in the same way adding ice to your drink will cool your drink?
    0 0
  35. I've read Bond et al shawnet. I was referring to some research published in the intervening period based on research that isn't nearly 10 years old. Your idea that research fields can be fully defined by recourse to single papers or dodgy reviews is not going to give you much insight into these difficult subjects! Note that you've mis-interpreted Bond et al who are rather consistent with the evidence from the pukka science that I've been discussing, and makes no mention of any CRF effects. In fact Bond et al interpret their data in terms of solar irradiance changes, amplified by thermohaline circulation effects:
    "Each of those episodes also corresponds to paired intervals of reduced solar irradiance and increases in North Atlantic ice drift in our records" and: "Results of recent atmospheric general circulation (GCM) modeling, however, have shown that a decrease of only ~0.1% in solar activity over the 11-year sunspot cycle could produce a change in surface climate through the atmosphere's dynamic response to changes in stratospheric ozone and temperature"
    Whereas you consider the thermohaline circulation "pretty speculative" (even 'though I provided papers referring directly to evidence for this for the periods specified), Bond et al certainly don't consider it to be speculative:
    The Arctic-Nordic Seas thus may have been a key region where solar-induced atmospheric changes were amplified and transmitted globally through their impact on sea ice and North Atlantic thermohaline overturning. Reduced northward heat transport, moreover, could have further altered North Atlantic latitudinal temperature and hydrologic gradients, potentially enhancing the climate response in low-latitude climates [e.g., (39)].
    This assertion of yours is illogical: "Do you know of a minor change that would cause a 2C change in the Atlantic ocean. Certainly, it couldn't be solar which can only change irradiance by about 0.2C or so". Think about it. Your assertion requires that you know the magnitiude of the irradiance changes contemporaneous with the events. We've been talking about contributions from irradiance changes (0.2 oC's worth) during a period where there's a reliable reconstruction (Lean et al back to the Maunder Minimum). Do you know what the irradiance values were further back in the Holocene? I don't think so…
    0 0
  36. What Bond et al. are rather clear on is the correlation btw solar events and climate ones and the magnitudes thereof. They don't mention CRF, of course, (and I never said they did), but they do say such things as "Our correlations are evidence, therefore, that over the last 12,000 years virtually every centennial time scale increase in drift ice documented in our North Atlantic records was tied to a distinct interval of variable and, overall, reduced solar output." They provide various possible amplifiers for solar input, because solar input alone doesn't work. Obviously, CRF climate interactions are one possible solar amplifier. "Think about it. Your assertion requires that you know the magnitiude of the irradiance changes contemporaneous with the events. We've been talking about contributions from irradiance changes (0.2 oC's worth) during a period where there's a reliable reconstruction (Lean et al back to the Maunder Minimum). Do you know what the irradiance values were further back in the Holocene? I don't think so…" There are two options here. Either the magnitude of solar irradiance has a (more or less) constant relationship to the level of CRF fluctuations or it does not. If the first case is true, then the pattern of climate fluctuations to the solar proxies implies that there is an amplifying agent, which is why Bond et al. proposes some. If, OTOH, the magnitude of solar changes is not constant wrt CRF changes then there is no reason why the correlations that Bond et al find should exist at all. IAC, perhaps we are making headway here - do you agree with Bond et al. that some sort of solar amplification is likely? I don't think we have enough evidence to tell what the nature of the solar amplification is, but we do IMO have enough to tell us that one does exist. I don't really want to get into the reasons why THC based explanations aren't very good IMO. That is a whole other line of argument. I don't really have a fundamental problem with them as *response* to long-term solar heating, I suppose. It is simply with them as a catch all fill-in-the-blanks type mechanism, I object to. Cheers, :)
    0 0
  37. "I don't really want to get into the reasons why THC based explanations aren't very good IMO. That is a whole other line of argument. I don't really have a fundamental problem with them as *response* to long-term solar heating, I suppose. It is simply with them as a catch all fill-in-the-blanks type mechanism, I object to." That's a self-contradictory assertion. It contradicts the essential basis of scientific understanding namely . We've already seen that there is abundant evidence for THC contributions (Lund et al, 2006; Denton and Broecker, 2008; Trouet et al, 2009; see Thornalley et al 2009 below) to the events we've been discussing; we could cite much more of this. You reject it without giving any evidence. The CRF effects you argue for have very little evidence. We've discussed a wide range of studies that indicate that the causal relationships between CRF and climate are even weaker than considered to be possible some years ago. One could hardly imagine a presentation which is more of a "catch all fill-in-the-blanks type mechanism" than Kirkby's. I'm comfortable with the scientific evidence. We can understand the MWP/LIA phenomena in terms of solar irradiance and volcanic influence with perhaps some effect on thermhaline circulation. The N. hemisphere temperature rise from the bottom of the LIA to the mid-20th century likely has a solar/volcanic contribution and almost certainly in the latter phase a strong anthropogenic greenhouse contribution. I don't know enough about the Bond effects to consider causality in detail, but I'd be very interested to see what scientific analysis informs your views on this. In the meantime, I'm prepared to accept Bond's interpretation of solar forcing with some potenial THC amplification. Since we don't know the magnitude of solar irradiance contemporaneous with these events we can hardly assert that this was not sufficient to mediate these phenomena. Your either this/either that binary choice is non-scientific, since it pre-selects for interpretations that are not necessarily consistent with the evidence. For example, it's quite possible that the Bond events report changes in heat transport through variations in thermohaline circulation that predominantly affect the high Northern latitudes. That's consistent with much of the science I've already cited (including Bond et al 2001) as well as additional recent evidence for Holocene oscillations in North Atlantic heat and salinity driven by variations in the THC [*], and observations that the events observed in the High Northern latitudes (Bond events, MWP; LIA) generally don't have deep Southern Hemisphere correlates [**] I don't see the point in trying to pin down causality for events for which the evidence doesn't support fundamental interpretations. We can understand the MWP/LIA quite well as we've already discussed. Bond events aren't well characterised. There's no evidence for a CRF influence since the evidence strongly supports the interpretation that any putative CRF-climate links are weak. The evidence in my view supports ocean and atmosphere circulation changes, acting predominantly on heat transfer to the high N. latitudes that might be internally or externally modulated in the latter case via volcanic and/or solar effects. [*] David J. R. Thornalley et al. (2009) Holocene oscillations in temperature and salinity of the surface subpolar North Atlantic Nature 457, 711-714 Abstract: The Atlantic meridional overturning circulation (AMOC) transports warm salty surface waters to high latitudes, where they cool, sink and return southwards at depth. Through its attendant meridional heat transport, the AMOC helps maintain a warm northwestern European climate, and acts as a control on the global climate. Past climate fluctuations during the Holocene epoch (11,700 years ago to the present) have been linked with changes in North Atlantic Ocean circulation1, 2. The behaviour of the surface flowing salty water that helped drive overturning during past climatic changes is, however, not well known. Here we investigate the temperature and salinity changes of a substantial surface inflow to a region of deep-water formation throughout the Holocene. We find that the inflow has undergone millennial-scale variations in temperature and salinity (3.5 °C and 1.5 practical salinity units, respectively) most probably controlled by subpolar gyre dynamics. The temperature and salinity variations correlate with previously reported periods of rapid climate change3. The inflow becomes more saline during enhanced freshwater flux to the subpolar North Atlantic. Model studies predict a weakening of AMOC in response to enhanced Arctic freshwater fluxes4, although the inflow can compensate on decadal timescales by becoming more saline5. Our data suggest that such a negative feedback mechanism may have operated during past intervals of climate change. Schaefer JM et al. (2009) High-Frequency Holocene Glacier Fluctuations in New Zealand Differ from the Northern Signature, Science 324, 622-625 Abstract: Understanding the timings of interhemispheric climate changes during the Holocene, along with their causes, remains a major problem of climate science. Here, we present a high-resolution Be-10 chronology of glacier fluctuations in New Zealand's Southern Alps over the past 7000 years, including at least five events during the last millennium. The extents of glacier advances decreased from the middle to the late Holocene, in contrast with the Northern Hemisphere pattern. Several glacier advances occurred in New Zealand during classic northern warm periods. These findings point to the importance of regional driving and/ or amplifying mechanisms. We suggest that atmospheric circulation changes in the southwest Pacific were one important factor in forcing high-frequency Holocene glacier fluctuations in New Zealand.
    0 0
  38. whoops, I left out a word: My first two sentences should read: That's a self-contradictory assertion. It contradicts the essential basis of scientific understanding evidence.
    0 0
  39. Chris: "That's a self-contradictory assertion. It contradicts the essential basis of scientific understanding namely . We've already seen that there is abundant evidence for THC contributions (Lund et al, 2006; Denton and Broecker, 2008; Trouet et al, 2009; see Thornalley et al 2009 below) to the events we've been discussing; we could cite much more of this. You reject it without giving any evidence." My point is that saying that THC changes are responsible for something when we don't know what causes the THC to change is simply begging the question. I think THC is a symptom of climate "fundamentals", not properly the cause of them. For you to simply accept that the THC causes climate change without understanding what causes the THC is not "supporting fundamental interpretations". ""I don't know enough about the Bond effects to consider causality in detail, but I'd be very interested to see what scientific analysis informs your views on this. In the meantime, I'm prepared to accept Bond's interpretation of solar forcing with some potenial THC amplification. Since we don't know the magnitude of solar irradiance contemporaneous with these events we can hardly assert that this was not sufficient to mediate these phenomena. Your either this/either that binary choice is non-scientific, since it pre-selects for interpretations that are not necessarily consistent with the evidence. For example, it's quite possible that the Bond events report changes in heat transport through variations in thermohaline circulation that predominantly affect the high Northern latitudes. That's consistent with much of the science I've already cited (including Bond et al 2001) as well as additional recent evidence for Holocene oscillations in North Atlantic heat and salinity driven by variations in the THC [*], and observations that the events observed in the High Northern latitudes (Bond events, MWP; LIA) generally don't have deep Southern Hemisphere correlates [**] " First off, if THC is the result of an amplification of some sort then THC-forcing is simply an indirect solar forcing. Secondly, the large climate events correlate to CRF, so if the magnitude of CRF doesn't correlate with the magnitude of irradiance, then that is good evidence that CRF *on its own* has climate impact. You call this either-or science, I call it simple logic. Phenomena do not typically have long-term with one another when there is not some causal connection. I think it is always preferable to have the simplest theory possible. Cheers, :)
    0 0
  40. "Phenomena do not typically have long-term with one another when there is not some causal connection" But we've already seen that this simply isn't true for the very phenomenon we've been discussing. A large set of analyses described in my post #71 indicates that any correlation between CRF and climate-related influences (low level clouds) is NOT causal, and is an artefact of the correlation of the CRF with the solar cycle, components of which DO correlate with the effect. That could hardly be plainer. We don't choose the "simplest theory possible" if the theory is incompatible with the evidence. We know that the CRF generally varies in line with solar outputs (whether or not there is a strict linear relationship) and in very many studies is used as a proxy for solar output variation. We can hardly assert that changes in solar irradiance are insufficient to account for the phenomenon observed if we don't (a) have a measure of the solar irradiance contemporaneous with the phenomenon of interest and (b) have a good handle on the magnitude of solar irradiance required to influence the phenomenon. I don't see any point in introducing "catch all fill-in-the-blanks type mechanisms" as pseudo-explanations (CRF) when the evidence doesn't support these. What we do have is abundant evidence that ocean/atmosphere circulation changes are associated with much of the variation in high Northern latitude climate variation through the Holocene. We can accept that (heat transfer variations) as a fundamental proximate cause of temperature proxies observed since the evidence is very strong. We don't have to postulate global scale phenomena since the evidence doesn't support this. We don't understand the ultimate causes of the circulation changes very well- these do seem to have a solar component for Bond cycles observed in the Northern latitudes. The evidence indicates that this isn't due to the CRF component of the solar influence. Where we do have some evidence (MWP/LIA) this is likely solar irradiance/volcanic sea surface temperature influences (see Trouet et al, 2009 cited above, for example). I'm happy to leave it there until evidence accrues that allows us to make more detailed causal interpretations of Holocene N. hemisphere climate variability. I have no problem with accepting uncertainty where this exists - what we certainly don't do is to introduce Kirkby-style "catch all fill-in-the-blanks type mechanisms" to "fill in" uncertainty, particularly when the causality associated with the mechanism is increasingly found to be suspect.
    0 0
  41. #130 - "Now that the oceans T appear to be flattening and cooling since early 2000s " How many cubic miles of land ice are running into the oceans as ice-cold water in recent years? Has this number been increasing? Wouldn't this have some effect on ocean temps in the same way adding ice to your drink will cool your drink. No this doesnt work with the volumes involved. If you warm a cup of water with ice in it, the ice melts but does not cool the water overall, as the water is also warming when you warm the cup. The ice can only cool the water if there is a very large ice/water differential with poor heat transfer, which is not the case here-there is a large ocean/ice differential. The oceans are cooling because the sun is now waning. c02 has no effect on ocean T.
    0 0
  42. There is an amount of energy called the enthalpy of fusion. In the ice/liquid phase transition – the energy from the atmosphere or ocean used to melt ice is internalised as kinetic energy. This energy is ‘hidden’ but it is not sufficient to make a huge difference to global energy budgets. Melting ice may cause oceans to be cooler – just like the ice in your glass. Ocean temperature is measured but the calculated heat content of the ocean is the important metric. Just like the total heat in an insulated container containing ice and water doesn’t change rapidly – although the enthalpy of fusion may be significant on that scale. The total heat content of the planet doesn’t change as a result of melting ice other than with the minor enthalpy change noted. It is no great mystery why the ocean is not warming at the anticipated rate – or while the atmosphere is cooling at the same time. http://bbso.njit.edu/Research/EarthShine/literature/Palle_etal_2008_JGR.pdf There has been a decrease in shortwave forcing since 1998 of 2 W/m2. Earth albedo was at a minimum in 1998 and has increased since. Both low level and high level cloud decreased to 1998 and increased thereafter in the climatically important equatorial zone. I am inclined to accept the Usoskin’s correlation of cosmogenic isotopes – over 1150 years. A correlation against global and hemispheric reconstructions of temperature. I am inclined to accept as plausible the mooted mechanisms of a cosmic radiation cloud connection. The experiment evidence in the SKY experiment is intriguing. I am inclined to think that there is a correlation of the aa geomagnetic index with 20th century temperature as below. The question is – is the cloud response characteristic of 20 to 30 year climate cycles found everywhere in the climate record? Not enough cloud data. But the cycles remain – adding to temperatures in the warming phase of 1976 to 1998 and masking warming since. In the current cool phase - there appears to be a cloud connection. The regularity of phase changes suggests that we are looking for a cyclic phenomenon. http://academicjournals.org/ijps/PDF/Pdf2006/Oct/El-Borie%20and%20Al-Thoyaib.pdf Can we use the aa geomagnetic activity index to predict partially the variability in global mean temperatures? M.A. El-Borie1 and S.S. Al-Thoyaib2 1 Physics Department, Faculty of Science, Alexandria University, Alexandria, Egypt. 2 Physics Department, Al- Rass Teacher’s College, Al-Qaseem, K.S.A. Accepted 17 October, 2006. Data for geomagnetic activity index aa and solar sunspot number Rz for 1868-2004 were subjected to correlation analysis with the global surface temperature (GST). The annual-means GT show that it had two warming phases and one cooling period. Observations of the Earth's near-surface temperature showed a global-mean temperature increase of approximately 1.1° C since 1877, occurred from 1887 to 1940 and from 1970 to the 1998. The temperature change over the past 35 years (1970-2004) is unlikely to be entirely due to internal climate variability. Attribution of the warming early in the century has proved more elusive. The correlation analysis between the variation of global temperature and both aa geomagnetics and solar activity are +0.5 ± 0.05, for any lag or lead, indicating a significant role in such variation. All graphs have illustrated strong correlations between the solar activity and geomagnetics and surface global temperature. Our results do not, by any means, rule out the existence of important links between solar activity and terrestrial climate. Our results displayed that the present changes in aa geomagnetics may reflect partially some future changes in the global surface temperatures. Key words: Geomagnetic induction, Atmospheric sciences, Climatology, Climate and interannual variability.
    0 0
  43. Things (so far) that a solar heat lag of ~40-60 years explains: -the so called "energy imbalance" of Hansen 2005-ie why the oceans have heated up to the early 2000s, in apparent imbalance with air T and heat flux(Hansen et al don't bother examining solar heat lag to explain this ocean warming 1955-1998). -ocean heat flat-lining since the early 2000s. (ie: its after 2:30pm on any average day now) -air T flat lining since early 2000s (same as above) -flattening sea levels in last few years -increasing T since ~1980, despite no apparent increase in solar activity (heat lag effect) -sun slowly waning yet no marked decrease in T yet, only flat-lining (heat lag effect) -inability of c02 theorists to recognise heat lag effect since one can't easily match immediate causes and effects (which academics are generally trained to do). -possibly delayed low cloud cover after solar peak is reached, excaberting T in late 20th Century, particularly in temperate zones with less low cloud cover (closer to condensation point, and cosmic rays). -not examined or even thought of by Gore, Hansen and co because doesnt fit c02 ideology. Prediction: T flat lines and then wanes from early 2000s-2020+, as opposed to Hansen's 2005 prediction of "record breaking years" within 3-4 years after 2005 by his so called 'energy imbalance' (already invalidated)-which is just a solar heat lag effect.
    0 0
  44. John - time you stepped in again. Your attempt to set the record straight (so to speak) on "heat lag" has made the heat lag obsessives even more so. It is a theory that can't be falsified, because you simply choose whichever time lag will allow a close match with your non-cause.
    0 0
  45. re: 144 David Horton This is a quote from the press release from Hansen himself, about Hansens et al's 2005 paper on the so-called energy imbalance: "the climate system is now being pushed so hard that I have suggested that we can say with confidence that 2005 will have a warmth comparable to that of 1998, and the remarkable 1998 global temperature record will soon be broken, if not this year than within the next several years.)," (http://junkscience.com/Greenhouse/imbalance_release.pdf) Note: the years from and including 2005 were not 'record breakers'. Also, ocean T has flattened or cooled since the early 2000s. His 'energy imbalance', supposedly driven by c02, is just not working. The cause(s) of the 'energy imbalance' in the paper of Hansen et al 2005,(if the 'energy imbalance' is indeed real-which it may not be), NEVER took into account the possibility that oceans have been heating from 1955-1998 in line with a solar heat lag effect from the solar peak in the 20th century, he simply assumes ocean heat is being driven by c02/greenhouse gases. He checks this with 'models', no models have been run regarding solar heat lag, clouds etc. However, it could equally be a confirmation of the solar heat lag one would expect from the mid 20th century-that is- there seems to be nothing 'driving' the heat in the oceans when modelled with the energy (apparently) leaving the atmosphere. Hansen et al 2005 never even investigate or consider thispossibility, because they are so bound up with c02 modelling and ideology. The years since this paper, 2005, have also invalidated his alarmist predictions above, and if the solar heat lag alternative theory is correct (or a version of it), there is no '0.6C warming left in the pipeline', since the sun is now waning, as is T.
    0 0
  46. re: 144 David Horton This is a quote from the press release from Hansen himself, about Hansens et al's 2005 paper on the so-called energy imbalance: "the climate system is now being pushed so hard that I have suggested that we can say with confidence that 2005 will have a warmth comparable to that of 1998, and the remarkable 1998 global temperature record will soon be broken, if not this year than within the next several years.)," (http://junkscience.com/Greenhouse/imbalance_release.pdf) Note: the years from and including 2005 were not 'record breakers'. Also, ocean T has flattened or cooled since the early 2000s. His 'energy imbalance', supposedly driven by c02, is just not working. The cause(s) of the 'energy imbalance' in the paper of Hansen et al 2005,(if the 'energy imbalance' is indeed real-which it may not be), NEVER took into account the possibility that oceans have been heating from 1955-1998 in line with a solar heat lag effect from the solar peak in the 20th century, he simply assumes ocean heat is being driven by c02/greenhouse gases. He checks this with 'models', no models have been run regarding solar heat lag, clouds etc. However, it could equally be a confirmation of the solar heat lag one would expect from the mid 20th century-that is- there seems to be nothing 'driving' the heat in the oceans when modelled with the energy (apparently) leaving the atmosphere. Hansen et al 2005 never even investigate or consider thispossibility, because they are so bound up with c02 modelling and ideology. The years since this paper, 2005, have also invalidated his alarmist predictions above, and if the solar heat lag alternative theory is correct (or a version of it), there is no '0.6C warming left in the pipeline', since the sun is now waning, as is T.
    0 0
  47. re: 144 David Horton This is a quote from the press release from Hansen himself, about Hansens et al's 2005 paper on the so-called energy imbalance: "the climate system is now being pushed so hard that I have suggested that we can say with confidence that 2005 will have a warmth comparable to that of 1998, and the remarkable 1998 global temperature record will soon be broken, if not this year than within the next several years.)," (http://junkscience.com/Greenhouse/imbalance_release.pdf) Note: the years from and including 2005 were not 'record breakers'. Also, ocean T has flattened or cooled since the early 2000s. His 'energy imbalance', supposedly driven by c02, is just not working. The cause(s) of the 'energy imbalance' in the paper of Hansen et al 2005,(if the 'energy imbalance' is indeed real-which it may not be), NEVER took into account the possibility that oceans have been heating from 1955-1998 in line with a solar heat lag effect from the solar peak in the 20th century, he simply assumes ocean heat is being driven by c02/greenhouse gases. He checks this with 'models', no models have been run regarding solar heat lag, clouds etc. However, it could equally be a confirmation of the solar heat lag one would expect from the mid 20th century-that is- there seems to be nothing 'driving' the heat in the oceans when modelled with the energy (apparently) leaving the atmosphere. Hansen et al 2005 never even investigate or consider thispossibility, because they are so bound up with c02 modelling and ideology. The years since this paper, 2005, have also invalidated his alarmist predictions above, and if the solar heat lag alternative theory is correct (or a version of it), there is no '0.6C warming left in the pipeline', since the sun is now waning, as is T.
    0 0
  48. Chris: ""Phenomena do not typically have long-term with one another when there is not some causal connection" But we've already seen that this simply isn't true for the very phenomenon we've been discussing. A large set of analyses described in my post #71 indicates that any correlation between CRF and climate-related influences (low level clouds) is NOT causal, and is an artefact of the correlation of the CRF with the solar cycle, components of which DO correlate with the effect." The fact is that at best, the only thing that has been disproved is *one particular interaction of CRF* with climate. Further, as I have already mentioned, climate science is very complex, and what appears true today is not necessarily so(adjustments to climate data are pretty common). Finally, there is no inherent reason why short term "weather" fluctuations might not obscure a CRF signal, that might become clearer over the long-term. Fundamentally, what is clear is that there must be some sort of solar amplification to climate, and we don't know what it is yet. Also, be advised that there are yet other lines of evidence(that we haven't talked about yet) for CRF-climate links which detail climate fluctuations for periods when the relationship btw CRF and solar irradiance is known to be altered. "I'm happy to leave it there until evidence accrues that allows us to make more detailed causal interpretations of Holocene N. hemisphere climate variability. I have no problem with accepting uncertainty where this exists - what we certainly don't do is to introduce Kirkby-style "catch all fill-in-the-blanks type mechanisms" to "fill in" uncertainty, particularly when the causality associated with the mechanism is increasingly found to be suspect." Yes, I think that if you agree that there is some form of solar amplification, we aren't that far apart. You are missing the point of the Kirkby paper, though. It is saying that the CRF-climate interaction is worth studying precisely because it appears such an unknown amplification that CRF can help fill. Cheers, :)
    0 0
  49. This is just like the huffpost, except with bigger, fancier words.
    0 0
  50. #147 - well, there's a new one "CO2 ideology". I wonder what that could be? Is it the ideology that shows, from physical principles, that CO2 is a greenhouse gas: or could it be the ideology that shows CO2 levels increasing? Or the ideology that shows, from the isotope signature, that the increase comes from human use of fossil fuels? Or perhaps the chemistry ideology that shows increasing ocean acidity as usual buffering effect of the oceans starts to be overwhelmed by the speed of increase in CO2? Or could it be the ecological ideology that finds rapid changes in the behaviour and distributions of animal and plant species? Or the ice ideology that measures the reduction in glacier lengths and ice cap volumes? So much ideology, so little science eh? Or am I thinking of the opposition?
    0 0

Prev  1  2  3  4  5  6  7  Next

You need to be logged in to post a comment. Login via the left margin or if you're new, register here.


The Consensus Project Website

THE ESCALATOR

(free to republish)


© Copyright 2024 John Cook
Home | Translations | About Us | Privacy | Contact Us