Climate Science Glossary

Term Lookup

Enter a term in the search box to find its definition.

Settings

Use the controls in the far right panel to increase or decrease the number of terms automatically displayed (or to completely turn that feature off).

Term Lookup

Settings


All IPCC definitions taken from Climate Change 2007: The Physical Science Basis. Working Group I Contribution to the Fourth Assessment Report of the Intergovernmental Panel on Climate Change, Annex I, Glossary, pp. 941-954. Cambridge University Press.

Home Arguments Software Resources Comments The Consensus Project Translations About Support

Bluesky Facebook LinkedIn Mastodon MeWe

Twitter YouTube RSS Posts RSS Comments Email Subscribe


Climate's changed before
It's the sun
It's not bad
There is no consensus
It's cooling
Models are unreliable
Temp record is unreliable
Animals and plants can adapt
It hasn't warmed since 1998
Antarctica is gaining ice
View All Arguments...


Username
Password
New? Register here
Forgot your password?

Latest Posts

Archives

Climate time lag

Posted on 8 July 2009 by John Cook

The previous post on CO2/Temperature correlation sparked some interesting comments on climate time lag. Unfortunately, the discussion went pear shaped with some ideological anti-intellectualism and things got a little bitchy after that. Nevertheless, climate time lag is an important subject that deserves more attention. Several metaphors were invoked in an effort to explain the phenomenon including stove hot plates and warming baths. However, I find the best way to understand climate time lag is a direct look at the science.

Our climate receives its energy from the sun. The amount of energy the planet absorbs from the sun is calculated from this equation:

Incoming Energy Flux= πR2S(1-A)

R is the radius of the earth, S (the solar constant) is the energy flux from the sun and A is the Earth's albedo - around 30% of sunlight is reflected back to space. The earth also radiates energy into space. The amount of energy emitted is a function of its temperature:

Outgoing Energy Flux = 4πR2εσT4

σ is Boltzmann's constant, T is the absolute temperature in degrees Kelvin and ε is the average emissivity of the earth. Emissivity is a measure of how efficiently the earth radiates energy, between 0 and 1. A blackbody has an emissivity of 1. Greenhouse gases lower the earth's emissivity. When the climate is in equilibrium, energy in equals the energy out.

S(1-A) = 4εσT4

What happens if the sun warms (solar constant S increases) then maintains a sustained peak? This is what occured in the early 20th century when solar levels rose then plateaued at a hotter state in the 1950's. The radiative forcing from the warming sun is not particularly large - between 0.17 W/m2 (Wang 2005) to 0.23 W/m2 (Krivova 2007) since the Maunder Minimum. Nevertheless, let's assume for the sake of argument that there is some amplifying effect (perhaps the cosmic ray effect on clouds) so that the warming sun has a substantial effect on global temperature.

When the sun warms, initially more solar energy is coming in than is radiating back out. The earth accumulates heat and it's temperature rises. As the earth warms, the amount of energy radiating back out to space increases. Eventually, the energy out matches the incoming solar energy and the planet is in equilibrium again. The time lag is how long it takes climate to return to equilibrium.

How long does the climate take to return to equilibrium? The lag is a function of climate sensitivity. The more sensitive climate is, the longer the lag. Hansen 2005 estimates the climate lag time is between 25 to 50 years.

How would climate have responded to the solar levels maxing out in the 50's? For the next few decades after the 50's, the radiative imbalance would've gradually decreased until the climate reached radiative equilibrium around the late 80's (give or take a decade). So how has our planet's radiative imbalance evolved over the latter 20th century?
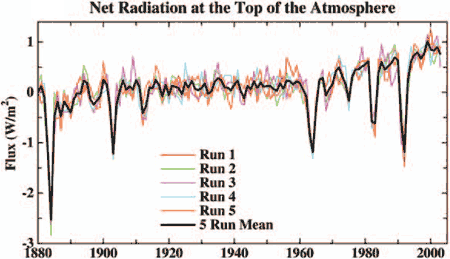

Figure 1: net radiation flux at the top of the atmosphere (Hansen 2005).

Hansen 2005 finds that the net radiative imbalance has steadily increased over the 20th century. There is no indication that the climate is heading towards equilibrium - quite the contrary. This is confirmed by satellite measurements of energy flux at the top of the atmosphere:
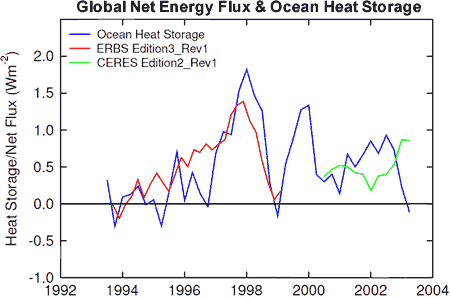

Figure 2: Global ocean heat storage (blue) against global net flux anomalies (Wong 2005).

The climate is not heading towards equilibrium. Rather, the radiative imbalance is increasing with the climate steadily receiving more energy than it is radiating back out into space. And this is where the true significance of climate time lag lies. Even if the radiative imbalance were to level off at its current rate of around 0.85W/m2, it would take several decades for the climate to return to radiative equilibrium. Based on this climate lag, Hansen 2005 calculates there is still 0.6°C warming still "in the pipeline".

0 0

Printable Version  |  Link to this page

Comments

Prev  1  2  3  4  5  6  7  Next

Comments 251 to 300 out of 347:

  1. Before Chris complains about Quadrant and Lindzen - compare it with the Trenberth and Fasula (2009) study above. Increased upward IR flux balancing CO2 warming. 'Instead the main warming from an energy budget standpoint comes from increases in absorbed solar radiation that stem directly from the decreasing cloud amounts. These findings underscore the need to ascertain the credibility of the model changes, especially insofar as changes in clouds are concerned.' This is reinforced by a study in last weeks Science by Clement et al(copy available at http://www.drroyspencer.com/Clement-et-al-cloud-feedback-Science-2009.pdf) - note that the paper is the link - although Spencer. as usual, is worth reading on this. Clement et al speculate that the decreasing is a positive feedback but the periods look much more like good ol' decadal SST. Increasing cloud cover since circa 2000 is a bit of a bummer for the cloud positive feedback theory - but icreasing temperature and water vapour and decreasing cloud cover was always a bit of a stretch. It could simply be a 'chaotic dynamic' response - a climate system tuned to a 50 year cycle. But one has to wonder about a connection to the 22 year solar cycle.
    0 0
  2. Should be - Clement et al speculate that decreasing cloud cover...
    0 0
  3. re #249 thingadonta, there is a huge body of evidence that the climate was intimately sensitive to atmospheric greenhouse gas concentrations throughout the long history of the earth. The effect of the progressively increasing solar constant is that greenhouse gas (largely CO2 since the end of the Archaean) thresholds for various broad climate states (hot/warm - cool/cold) shift through deep time. However the climate remains highly sensitive to greenouse gas levels (obviously so, since greenhouse gases are greenhouse gases!). So analysis of CO2 levels from paleoproxies and comparison with paleotemperatures and evidence for glaciations, demonstrates a rather close connection with atmospheric CO2 levels during many hundreds of million years. The decreasing levels of atmospheric CO2 through the late Eocene are linked with the onset of first Antarctic glaciation and in the late Pliocene with the onset of Greenland glaciation [*]. However the threshold for these glaciations (around 500 ppm of atmospheric CO2) are much lower than the thresholds for glaciation in the deep past, where, for example, the very much weaker solar output during the Ordovician meant that drops of CO2 levels below around 2000-3000 were sufficient to instigate significant widespread cold and localized glaciation [**]. There is a vast scientific literature on CO2-climate links right through the entire Phanerozoic, a vast period of 500-odd million years where there is a reasonable coverage of paleotemperature and paleo-CO3 proxies. The data frm more than 100 studies has been summarized in a detailed review published in 2006 [**]. Since that time a large number of additional evidence for close CO2-earth temperature links has been published [***]. So the earth's climate has been very sensitive to atmospheric CO2 levels for many 100's of millions (if not 1000's of millions) of years. When atmospheric CO2 levels drop below thresholds, the levels of which are modulated by the solar output, cold/glacial periods result. Likewise when atmospheric CO2 levels rise (e.g. following major tectonic events, or possibly during the long slow grinding of the Indian subcontinent towards and into South Asia through the early and middle Eocene, with the release of massive amounts of CO2 from carbonate sediments), the earth is warm/hot. [*] D.L. Royer (2006) "CO2-forced climate thresholds during the Phanerozoic" Geochim. Cosmochim. Acta 70, 5665-5675. [ ***] More recent studies supplement the information in Royers compilation and cover additional periods with new data sets right through the past several hundreds of millions of years: [**] D. J. Lunt et al. (2008) Late Pliocene Greenland glaciation controlled by a decline in atmospheric CO2 levels Nature 454, 1102-1105 R.E. Carne, J.M. Eiler, J. Veizer et al (2007) "Coupling of surface temperatures and atmospheric CO2 concentrations during the Palaeozoic era" Nature 449, 198-202 W. M. Kurschner et al (2008) “The impact of Miocene atmospheric carbon dioxide fluctuations on climate and the evolution of the terrestrial ecosystem” Proc. Natl. Acad. Sci. USA 105, 499-453. D. L. Royer (2008) “Linkages between CO2, climate, and evolution in deep time” Proc. Natl Acad. Sci. USA 105, 407-408 Zachos JC (2008) “An early Cenozoic perspective on greenhouse warming and carbon-cycle dynamics” Nature 451, 279-283. Doney SC et al (2007) “Carbon and climate system coupling on timescales from the Precambrian to the Anthropocene” Ann. Rev. Environ. Resources 32, 31-66. Horton DE et al (2007) “Orbital and CO2 forcing of late Paleozoic continental ice sheets” Geophys. Res. Lett. L19708 B. J. Fletcher et al. (2008) “Atmospheric carbon dioxide linked with Mesozoic and early Cenozoic climate change” Nature Geoscience 1, 43-48. [****] Kent DV, Muttoni G “Equatorial convergence of India and early Cenozoic climate trends” (2008) Proc. Natl. Acad. Sci. USA 105, 16065-16070. Bohaty SM et al. (2009) “Coupled greenhouse warming and deep-sea acidification in the middle Eocene”, Paleooceanography 24, art # PA2207. Robert M. DeConto et al (2008) "Thresholds for Cenozoic bipolar glaciation" Nature 455, 652-656
    0 0
  4. re 255: Chris: I can't comment about the relationship between co2 and climate sensivity etc throughout geological periods without having a more detailed look at the papers and data you mention. So thanks for the papers. But I DO know that glacial periods occur where there is eg: 1) restricted ocean current circulation (eg in the last 37 Ma-Australia's increasing separation from Antartica, Africa crashing into Asia and eliminating almost the the Tethys Sea-only the small Meditterranen Sea is left, and South America joining North America in the last few million years), and 2) where continents are bound together near the poles (eg Permo-Carboniferous). The general reduction in ocean circulation causes cooling in the oceans and subsequent lowering of c02 (higher solubility), the relative effect of lowering c02 on T itself is likely small-once again I suspect the reserchers have enhanced co2's relative effect in such cases. Its a chicken and egg argument, c02 drops because the ocean and earth cools, not the other way round. I also know from experience that it can be very difficult to nail-down cause(s) of geological-age climate changes, and the sometimes associated minor/mass extinction events; the usual trend is that the latest research 'fad' usually dominates the debate- eg K-T boundary extinction event in the 1980s with bolide impact, as opposed/coupled with strong volcanism in the Deccan traps in India (very likely a combination of both). Also, I mention the end Permian with its very strong volcanism in Siberia which widespread hothouse-(but what caused the Siberian volcanism in the first place?). Note also: there are no coals in the early Triassic, coal-forming plants went extinct at end Permian for around 10Ma and had to re-evolve, but was this due to greenhouse gases?. I suspect, but I am not familiar with all this more recent geological-greenhouse gas literature, that relative greenhouse gas effects can be 'adjusted' to produce whatever effect on climate and/or extinction events in the geological past is desired to produce a preconceived outcome. This happened with bolide impacts (with few real major or minor extinction events correlated); researchers have also probably overshot the mark with greenhouse gases and the geological past, with more chicken and egg-type arguments (co2 causing T to change or T causing c02 to change). eg: "When atmospheric CO2 levels drop below thresholds, the levels of which are modulated by the solar output, cold/glacial periods result". But how do you know that T didnt drop naturally first, with the drops in ocean T leading to drops in atmospheric c02 from higher solubility of c02 in cooler oceans? And one more thing, is the geological record at sufficient resolution to resolve this? I suspect it isnt, in the vast majority of cases. I'll have to read the stuff sometime.
    0 0
  5. That doesn't really accord with the evidence 'though thingadonta. For example, we can determine from the glacial record the response of CO2 levels to earth temperature variation. It's likely that the transitions are slow enough (~ 5000 years) for the atmospheric CO2 changes to come to near equilibrium with the temperature changes. So around 5 oC of warming/cooling (glacial/interglacial) gives around 90-100 ppm of atmospheric CO2 change (around 180 ppm glacial/around 270 ppm interglacial through a number of glacial cycles). This gives approx 20 ppm of atmospheric CO2 change per oC of global-scale warming/cooling from the geophysical response of CO2 ocean/atmosphere partitioning (and any other contributions like biological responses; terrestrial sequestering) to temperature. That is inconsistent with the very large CO2 variations observed in the Phanerozoic record: 3000 ppm atmospheric CO2 in the Devonian to 1000 ppm in the early Carboniferous to values down to 500 ppm preceding and during the mid Carboniferous and early Permian glacials back up to 1000 -1500 ppm in the late Permian; up to 2000 ppm in the Triassic; the Jurassic has values apparently as high as 4000-5000 ppm and then reduced CO2 to values near 500-1000 ppm during cold Jurassic periods….and so on. These extremely large changes are incompatible with temperature-driven re-equilibration of CO2 into the atmosphere which rather strong evidence indicates can only really yield CO2 changes of around 200 ppm over the full range of Phanerozoic temperatures. Likewise it's perverse to attribute very large increases of CO2 that are known to be contemporaneous with major catastrophic tectonic processes, to temperature responses that we know cannot possibly have produced such massive changes in CO2. For example the Paleo-Eocene Thermal Maximum (PETM) 55 MYA is clearly associated temporally with the massive tectonic processes involved in opening up of the N. Atlantic as the plates separated above a mantle plume, and which resulted in massive enhancement of atmospheric greenhouse gases (not to mention ocean acidification etc.) [*]. It would require some rather bottom-squirming dissembling to argue away this evidence, and one could raise further examples of catastrophically raised CO2 levels associated with some of the other major extinctions in Earth history (see [**] below). The fact that we don't know what caused any particular event (.g. why did the Serbian or Deccan Traps erupt just when they did?) is not really an argument against this very basic causality in relation to variations in greenhouse gas concentrations. After all we know that the loss of heat from the Earth's interior results in plate movement with ocean subduction, mantle plume formation and such like. We can assume that the process is essentially stochastic, and that occasionally continents collide (Africa into Europe; India into S. Asia), and mantle plumes breach the surface with massive flood basalt extrusion (e.g. Deccan Traps – I've seen smaller versions of these flood basalt landscapes in the West of Scotland). We can understand how biologic processes may result in large scale slow reduction of greenhouse gases (oxygen-producing organisms in the Archaean; plant evolution that gave rise to drawdown of CO2 and glaciation in the Carboniferous)….we understand the processes involved in weathering and their temperature dependences…and so on. As you indicate the location of the land masses is important (over the poles promotes ice build up; near the equator promotes weathering). There is such a truly vast scientific knowledge of these processes and their interrelationships, it doesn't seem reasonable to ignore this and propose that completely uncharacterised putative temperature swings of which there is neither evidence nor cause resulted in the extremely large atmospheric CO2 variations that we know cannot have been temperature-driven anyway! In my opinion we really have to follow the evidence. And interpretations based on the evidence is always much more interesting and satisfying than those involving attempted forcing of dodgy hypothesis into empirical scenarios that they just don't fit. Incidentally, I think you're right about the lack of really sound evidence for bolide impacts as recurring causal elements of extinctions. However these (extinctions) do seem to associate with major tectonic events [**] [*] M. Storey et al. (2007)Paleocene-Eocene Thermal Maximum and the Opening of the Northeast Atlantic Science 316, 587 - 589 abstract: The Paleocene-Eocene thermal maximum (PETM) has been attributed to a sudden release of carbon dioxide and/or methane. 40Ar/39Ar age determinations show that the Danish Ash-17 deposit, which overlies the PETM by about 450,000 years in the Atlantic, and the Skraenterne Formation Tuff, representing the end of 1 ± 0.5 million years of massive volcanism in East Greenland, are coeval. The relative age of Danish Ash-17 thus places the PETM onset after the beginning of massive flood basalt volcanism at 56.1 ± 0.4 million years ago but within error of the estimated continental breakup time of 55.5 ± 0.3 million years ago, marked by the eruption of mid-ocean ridge basalt–like flows. These correlations support the view that the PETM was triggered by greenhouse gas release during magma interaction with basin-filling carbon-rich sedimentary rocks proximal to the embryonic plate boundary between Greenland and Europe. [**] Wignall P (2005) The link between large igneous province eruptions and mass extinctions Elements 1, 293-297 Abstract: In the past 300 million years, there has been a near-perfect association between extinction events and the eruption of large igneous provinces, but proving the nature of the causal links is far from resolved. The associated environmental changes often include global warming and the development of widespread oxygen-poor conditions in the oceans. This implicates a role for volcanic CO2 emissions, but other perturbations of the global carbon cycle, such as release of methane from gas hydrate reservoirs or shut-down of photosynthesis in the oceans, are probably required to achieve severe green-house warming. The best links between extinction and eruption are seen in the interval from 300 to 150 Ma. With the exception of the Deccan Trap eruptions (65 Ma), the emplacement of younger volcanic provinces has been generally associated with significant environmental changes but little or no increase in extinction rates above background levels. R. J. Twitchett (2006) The palaeoclimatology, palaeoecology and palaeoenvironmental analysis of mass extinction events Palaeogeog., Palaeoclimatol., Palaeoecol. 232, 190-213 concluding paragraph: "Mass extinction studies have enjoyed a surge in scientific interest of the past 30 years that shows no sign of abating. Recent areas of particular interest include the palaeoecological study of biotic crises, and analyses of patterns of post-extinction recovery. There is good evidence of rapid climate change affecting all of the major extinction events, while the ability of extraterrestrial impact to cause extinction remains debatable. There is growing evidence that food shortage and suppression of primary productivity, lasting several hundred thousand years, may be a proximate cause of many past extinction events. Selective extinction of suspension feeders and the prevalence of dwarfed organisms in the aftermath are palaeoecological consequences of these changes. The association with rapid global warming shows that study of mass extinction events is not just an esoteric intellectual exercise, but may have implications for the present day." Keller G (2005) Impacts, volcanism and mass extinction: random coincidence or cause and effect? Austral. J. Earth Sci 52 725-757. Abstract: Large impacts are credited with the most devastating mass extinctions in Earth's history and the Cretaceous - Tertiary (K/T) boundary impact is the strongest and sole direct support for this view. A review of the five largest Phanerozoic mass extinctions provides no support that impacts with craters up to 180 km in diameter caused significant species extinctions. This includes the 170 km-diameter Chicxulub impact crater regarded as 0.3 million years older than the K/T mass extinction. A second, larger impact event may have been the ultimate cause of this mass extinction, as suggested by a global iridium anomaly at the K/T boundary, but no crater has been found to date. The current crater database suggests that multiple impacts, for example comet showers, were the norm, rather than the exception, during the Late Eocene, K/T transition, latest Triassic and the Devonian-Carboniferous transition, but did not cause significant species extinctions. Whether multiple impacts substantially contributed to greenhouse warming and associated environmental stresses is yet to be demonstrated. From the current database, it must be concluded that no known Phanerozoic impacts, including the Chicxulub impact (but excluding the K/T impact) caused mass extinctions or even significant. species extinctions. The K/T mass extinction may have been caused by the coincidence of a very large impact ( > 250 km) upon a highly stressed biotic environment as a result of volcanism. The consistent association of large magmatic provinces (large igneous provinces and continental flood-basalt provinces) with all but one (end-Ordovician) of the five major Phanerozoic mass extinctions suggests that volcanism played a major role. Faunal and geochemical evidence from the end-Permian, end-Devonian, end-Cretaceous and Triassic/Jurassic transition suggests that the biotic stress was due to a lethal combination of tectonically induced hydrothermal and volcanic processes, leading to eutrophication in the oceans, global warming, sea-level transgression and ocean anoxia. It must be concluded that major magmatic events and their long-term environmental consequences are major contributors, though not the sole causes of mass extinctions. Sudden mass extinctions, such as at the K/T boundary, may require the coincidence of major volcanism and a very large impact .
    0 0
  6. Nature Geoscience Published online: 13 July 2009 | doi:10.1038/ngeo578 Carbon dioxide forcing alone insufficient to explain Palaeocene–Eocene Thermal Maximum warming Richard E. Zeebe1, James C. Zachos2 & Gerald R. Dickens3 ‘The Palaeocene–Eocene Thermal Maximum (about 55 Myr ago) represents a possible analogue for the future and thus may provide insight into climate system sensitivity and feedbacks1, 2. The key feature of this event is the release of a large mass of 13C-depleted carbon into the carbon reservoirs at the Earth's surface, although the source remains an open issue3, 4. Concurrently, global surface temperatures rose by 5–9 °C within a few thousand years5, 6, 7, 8, 9. Here we use published palaeorecords of deep-sea carbonate dissolution10, 11, 12, 13, 14 and stable carbon isotope composition10, 15, 16, 17 along with a carbon cycle model to constrain the initial carbon pulse to a magnitude of 3000 Pg C or less, with an isotope composition lighter than -50. As a result, atmospheric carbon dioxide concentrations increased during the main event by less than about 70% compared with pre-event levels. At accepted values for the climate sensitivity to a doubling of the atmospheric CO2 concentration1, this rise in CO2 can explain only between 1 and 3.5 °C of the warming inferred from proxy records. We conclude that in addition to direct CO2 forcing, other processes and/or feedbacks that are hitherto unknown must have caused a substantial portion of the warming during the Palaeocene–Eocene Thermal Maximum. Once these processes have been identified, their potential effect on future climate change needs to be taken into account.’
    0 0
  7. re:257 Chris A few points, (even though this isnt climate time lag): "These extremely large changes are incompatible with temperature-driven re-equilibration of CO2 into the atmosphere which rather strong evidence indicates can only really yield CO2 changes of around 200 ppm over the full range of Phanerozoic temperatures". Yes, most of the c02 rise was driven by increased volcanism especially in the Jurassic, but the earth thrived throughout most of the times these c02 values were high in Jurassic-Cretaceous. Solar output was not much different than now, and values of 5000ppm C02 in Jurassic did not create runaway greenhouse etc. The general issue is: how much did changes in ocean currents, continental configurations, very strong volcanism, naturally driven T changes, lower solar output back then etc, actually interact with c02 /climate sensivity in all this? I suspect the models/explanations are 'tweaked', but it does require more reading from me. Because of volatile volcanism (those dinosaur movies were right-there was much more volcanism back then), the c02 variations in response to volcanism, T and tectonic changes, were also much more profound than "just 200ppm". But all this doesn't say much about strong or weak c02 sensitivity. But one crude skeptical point is that the world didnt end when Co2 values were much much higher. The very widesread basaltic volcanism in eg the Triassic-to especially the Jurassic (we have widespread Jurassic volcanics through NSW, Victoria, Tasmania, extending right through to Antarctica, South America, South Africa due to large-scale continental Gondwana breakup) caused the values of c02 to rise up to 5000ppm. The only major extinction event here was the end Triassic, associated with this break up. C02 levels remained much higher from this volcanism and ongoing continental configuration with no runaway greenhouse, with thriving organisms and a solar output not much different han now. The PETM event requires more reading from me. But I note that a recent blog/paper on 'Watts up with that website' questions the whole relative effect of c02/CH4 on this major event. My general concern is being able to quantify the relative contribution of c02/greenhouse gases in these geological ages and events without researcher's bias, and general climate sensitivity to c02, back then and now. You say there is 'abundant literature', but there is abundant literature on recent climate now without definitive/agreement on climate c02 sensitivity-people are still not sure about it. I doubt they can be that sure about the geological past as well, other than 'no end of the world'. The PETM event requires reading from me. The issue of 'suddenness' in the earth-climate c02 etc relationship is what the alarmists are all worried about with respect to recent human effects. I enjoy reading your abstracts, its been a while since I looked at some of these. I especially remember looking at the coals in NSW which simply 'disappear' at the end Permian, and not reappear for 10 Ma-organisms all dead!. Also the Triassic red sandstones and Jurassic volcanics-these were worldwide features. But I didnt know that c02 was so high then, makes sense with all the volcanism. By the way, there is evidence in the end Ordovician-early Silurian in Australia for major tectonism.
    0 0
  8. re 258: Robbo Yes, thats the PETM paper I was talking about.
    0 0
  9. Yes, that's an interesting article. Using the range of climate sensitivities currently available for fast response to raised atmospheric CO2 levels near 3 oC (+/- about 1.5 oC at 95% certainty) the estimated amount of CO2 added to the atmosphere during the PETM is expected to have caused only up to 3.5 oC of warming. Independent paleotemperature data indicates that tropical oceans warmed by 4-6 oC, and high latitude oceans by 5-8 oC. So within our current understanding of climate sensitivity, the PETM warming, if correct, is too large to be explained by current estimates of climate sensitivity to CO2 (assuming Zachos' estimates of [CO2] are about right). The authors consider that additional feedbacks amplified the CO2 (and methane) warming. Possible contributions include methane emissions from permafrost or swamplands, or enhanced water vapour [*]. As the authors describe, the entire PETM episode was very long (around 75,000 years), and a concern for our present understanding is that climate sensitivities determined taking into account relatively rapid feedbacks (the Charney sensitivity) don't accommodate longe term positive feedbacks (like large scale methane release induced by CO2-induced ramping up of temperature), that might enhance the earth's temperature sensitivity to CO2 (possibly after a certain threshold temperature rise is reached). The essential understanding of the PETM being triggered by massive release of greenhouse gases (CO2 and/or methane) likely associated with tectonic events involving opening up of the nascant plate boundary in the (now) N. Atlantic (see Storey 2007 abstract in my post just above), isn't affected by this article. [*] R. D. Pancost et. al. (2007) "Increased terrestrial methane cycling at the Palaeocene–Eocene thermal maximum" Nature 449, 332-335 abstract: The Palaeocene–Eocene thermal maximum (PETM), a period of intense, global warming about 55 million years ago1, has been attributed to a rapid rise in greenhouse gas levels, with dissociation of methane hydrates being the most commonly invoked explanation2. It has been suggested previously that high-latitude methane emissions from terrestrial environments could have enhanced the warming effect3, 4, but direct evidence for an increased methane flux from wetlands is lacking. The Cobham Lignite, a recently characterized expanded lacustrine/mire deposit in England, spans the onset of the PETM5 and therefore provides an opportunity to examine the biogeochemical response of wetland-type ecosystems at that time. Here we report the occurrence of hopanoids, biomarkers derived from bacteria, in the mire sediments from Cobham. We measure a decrease in the carbon isotope values of the hopanoids at the onset of the PETM interval, which suggests an increase in the methanotroph population. We propose that this reflects an increase in methane production potentially driven by changes to a warmer1, 6 and wetter climate7, 8. Our data suggest that the release of methane from the terrestrial biosphere increased and possibly acted as a positive feedback mechanism to global warming.
    0 0
  10. Henrik Svensmark et al have a new GRL paper in press entitled: ‘Cosmic ray decreases affect atmospheric aerosols and clouds’ The Abstract states: Close passages of coronal mass ejections from the sun are signaled at the Earth’s surface by Forbush decreases in cosmic ray counts. We find that low clouds contain less liquid water following Forbush decreases (FDs), and for the most influential events the liquid water in the oceanic atmosphere can diminish by as much as 7%. Cloud water content as gauged by the Special Sensor Microwave/Imager (SSM/I) reaches a minimum around 7 days after the Forbush minimum in cosmic rays, and so does the fraction of low clouds seen by the Moderate Resolution Imaging Spectroradiometer (MODIS) and in the International Satellite Cloud Climate Project (ISCCP). Parallel observations by the aerosol robotic network AERONET reveal falls in the relative abundance of fine aerosol particles which, in normal circumstances, could have evolved into cloud condensation nuclei (CCN). Thus a link between the sun, cosmic rays, aerosols, and liquid-water clouds appears to exist on a global scale. The paper concludes: Our results show global-scale evidence of conspicuous influences of solar variability on cloudiness and aerosols. Irrespective of the detailed mechanism, the loss of ions from the air during FDs reduces the cloud liquid water content over the oceans. So marked is the response to relatively small variations in the total ionization, we suspect that a large fraction of Earth’s clouds could be controlled by ionization. Future work should estimate how large a volume of the Earth’s atmosphere is involved in the ion process that leads to the changes seen in CCN and its importance for the Earth’s radiation budget. From solar activity to cosmic ray ionization to aerosols and liquid-water clouds, a causal chain appears to operate on a global scale. Svensmark, H., T. Bondo, and J. Svensmark (2009), Cosmic ray decreases affect atmospheric aerosols and clouds, Geophys. Res. Lett., doi:10.1029/2009GL038429, in press. (Climate Research News)
    0 0
  11. Based on findings related to oceanic acidity levels during the PETM and on calculations about the cycling of carbon among the oceans, air, plants and soil, Dickens and co-authors Richard Zeebe of the University of Hawaii and James Zachos of the University of California-Santa Cruz determined that the level of carbon dioxide in the atmosphere increased by about 70 percent during the PETM. You're wrong Chris - but being wrong scientifically is most of the way to being right if you remain open and questioning. It is carbon that spkiked in the geolgical record - and this includes the end products from methane conversion in the atmosphere. The methane clathate or other mechanism is required to explain the huge spike in carbon - because other sources are insuffcient in any scenario. So the methane is included in Zeebe et al but still can't explain all the warming.
    0 0
  12. Perhaps more succintly - the methane was required to explain the carbon spike not the warming.
    0 0
  13. 263:Robbo: I don't know anything about the PETM, but I'm guessing the role of c02 in the PETM has been 'enhanced' by research bias. Am I way off?? Did the corals go extinct by all the ocean acidification?. Or are the oceans, and the corals and shells in them, in fact, extremely adaptable and robust (unlike the coral researchers themselves)?
    0 0
  14. I would prefer to hope that most scientists don’t deliberately distort things to suit an agenda – but as Popper said – scientists bring their personal value systems to the scientific method. I didn’t think that corals went extinct but 35-50% of benthic foraminifera in the deep ocean because of anoxia (?). There is a discussion here. http://www.theresilientearth.com/?q=content/could-human-co2-emissions-cause-another-petm Speculations based on 55 million year old rocks are inherently not ‘falsifiable’ so can’t be proved or disproved and there always seem to passionate adherents on both sides. It may be the human condition. I think it is better to rely on modern measurement. The one contemporary study on ocean acidification using measured data that I can find shows that ‘ocean acidification is 10 times worse than calculated.’ Unfortunately, their site is directly in the path of deep ocean upwelling in the north eastern Pacific. Other than that – ocean pH changes hugely on a daily basis, seasonally and as a result of mixing with deep ocean water on interannual and decadal timescales. There are those, however, who are willing to distort the truth for a cause. ‘In the 1930s, George Orwell railed against “cranks” in his book, The Road to Wigan Pier. English advocates of the simple life in the 1930s, like Edward Carpenter and Leslie Paul, can be regarded as forerunners of modern ecological anticapitalism. Quoting from an article in Cabinet Magazine, “In the spirit of The Road to Wigan Pier, today's anti-capitalism could be said to draw towards it with magnetic force every tree-hugger, organic fruitarian, solar-powered scooter rider, water-birth enthusiast, Tantric-sex practitioner, world-music listener, teepee-dweller, hemp-trouser wearer, and Ayurvedic massage addict.” Crank culture is alive and well in the 21st century.’ The ocean acidification notion seems reminiscent of past environmental scares - very light on data heavy on fear tactics. Did you know that DDT was approved for use by the World Health Organisation in 2006? I had to read the document myself to believe it. In 2007, chemists at NASA’s JPL remeasured the photolysis rate of dichlorine peroxide at almost 1/10th of what was required to explain ozone depletion. Ozone depletion seems largely to be the result of increased UV from the sun. Acid rain was never a problem – plants are of course adapted to a range of environmental conditions. Global warming seems to be going the same way – if even Trenberth and Fasulla are saying it’s clouds – the writing is on the wall.
    0 0
  15. Remind me again of the definition of obsession?
    0 0
  16. re #263 You've got that wrong I think, Robbo. Have a more careful read of the Zeebe paper. These authors used paleorecords to constrain the initial carbon pulse which derived from CO2 and/or methane (which would have been quickly oxidised to CO2). This was limited (according to their analysis) to 3000 Pg of carbon or less, and (depending on the pre-existing atmospheric CO2 background) would have raised the atmospheric CO2 levels to around 1700 ppm. The authors conclude that additional feedbacks/forcings are required to yield the temperature rise estimates determined independently. These include the release of additional warming-induced greenhouse gases including methane. Since the authors state this explicitly, it's difficult to argue that they don't include this as a possible origin of additional forcing:
    Possible causes of the excess warming include increased production and levels of trace greenhouse gases as a consequence of the climatic warming (such as CH4; ref. 28).
    CH4 is methane Likewise David Beerling in his accompanying report to this paper in the same issue states (concerning the origin of feedbacks/amplification):
    Possible alternative candidates include methane emissions from swamplands6, 7 and permafrost8, and increases in atmospheric moisture9, biogenic aerosols and cloudiness10.
    Incidentally, there is a certain surreal element to this discussion (as most of the discussions on this thread). There is very little controversy that the PETM warming was driven by massive release of greenhouse gases into the atmosphere with subsequent warming, ocean acidification and some rather significant marine extinctions. On top of this fairly fundamental understanding there is some uncertainty about the details (such as we're discussing), not surprising since these 55 MYA phenomena are represented as paleoproxy traces in marine sediments and such-like. On this uncertainty, the Zeebe paper is rather concerning, since it indicates that the earth temperature response to very large greenhouse gas emissions may be amplified by feedbacks that are not generally considered in the standard estimation of climate sensitivity based on known short term feedbacks. Returning to uncertainty in science, most scientists would agree that uncertainty is great, since it provides an impetus for experimentation/observation and further understanding and refinement of our knowledge. Sadly, the tedious pretence that uncertainty over second-order (and often rather peripheral) elements of phenomena somehow constitutes cause for doubting the essential elements of our understanding is creepy, but perhaps it was ever thus where science impacts on politics and vested-interest!
    0 0
  17. Robbo, you've provided yet another example of my statement about the mis-use of glorious scientific uncertainty in peripheral elements of scientific knowledge, as a blunderbuss to cast doubt on rather well-established science. let's look at your dichlorine peroxide assertion in the light of my statement about uncertainty, which I reproduce below:
    Sadly, the tedious pretence that uncertainty over second-order (and often rather peripheral) elements of phenomena somehow constitutes cause for doubting the essential elements of our understanding is creepy, but perhaps it was ever thus where science impacts on politics and vested-interest!
    You stated: "In 2007, chemists at NASA’s JPL remeasured the photolysis rate of dichlorine peroxide at almost 1/10th of what was required to explain ozone depletion." Note that this observation never cast much serious doubt on our understanding of the role of CFC's in stratospheric ozone depletion (for example empirical atmospheric measures of oxygenated chlorinated species like ClO/ClOOCl were always incompatible with the laboratory analyses of Pope et al from NASA JPL). Normally, where there is some uncertainty, we sit back and wait to see how things develop, before charging in and asserting that the uncertainty fundamentally undermines our knowledge and understanding. Now that we've sat back and waited, we find that the uncertainty has resolved iself in favour of empirical observations and our previous understanding [*]. The experimental artefacts that bedevilled Pope et al's studies (extreme difficulty of preparing pure chlorine peroxide) have been solved by using a mass spectrometry fractionation method, and reanalysis of pure samples shows that the photolysis rates of ClOOCl are in fact in line with the standard photochemical models of ozone depletion. It's always worth relaxing about uncertainty; charging in with premature insinuations that our understandings are fundamentally flawed based on wildly cherrypicked interpretations of provisional analyses, is tedious, and reflects poor standards of scientific nous in those that are prone to those sorts of scientific misrepresentation. [*] Chen HY (2009) "UV Absorption Cross Sections of ClOOCl Are Consistent with Ozone Degradation Models "Science 324, 781-784 Abstract: Recently, discrepancies in laboratory measurements of chlorine peroxide (ClOOCl) absorption cross sections have cast doubt on the validity of current photochemical models for stratospheric ozone degradation. Whereas previous ClOOCl absorption measurements all suffered from uncertainties due to absorption by impurities, we demonstrate here a method that uses mass-selected detection to circumvent such interference. The cross sections of ClOOCl were determined at two critical wavelengths (351 and 308 nanometers). Our results are sufficient to resolve the controversial issue originating from the ClOOCl laboratory cross sections and suggest that the highest laboratory estimates for atmospheric photolysis rates of ClOOCl, which best explain the field measurements via current chemical models, are reasonable."
    0 0
  18. I like the idea that the Jurassic Dinosaurs ran around eating each other, diversifying, evolving and generally thriving when C02 was up to 5000ppm; illustrates Michael Crichton's global warming position rather nicely I suspect. As for PETM, there was a similar explosion of diversity around the PETM 55Ma event in mammals wasn't there? Love that C02 biodiversity!
    0 0
  19. Where does the heat "Hide" during the time lag? We all know it can't really hide, something has to get warm or change phase or something...
    0 0
    Response: The heat doesn't hide, this is the kind of misconception I was hoping to clear up in this post (perhaps to my discredit, I didn't explain clearly enough). What happens if the planet is in radiative imbalance with more energy coming in than going out? Then the planet is accumulating heat and begins to warm. Note - it immediately starts warming - the heat doesn't disappear for a few decades. But the heating is gradual because of the thermal inertia of the oceans - it takes a while for the oceans to warm up. Like turning on a kettle - the water doesn't boil immediately but takes a while to warm up.

    As the planet's temperature rises, the amount of energy radiated back out to space increases. Eventually the energy radiated out equals the energy coming in. At that point, the planet is back in radiative equilibrium and stops warming. The climate time lag is the time it takes for the planet to get back to equilibrium.
  20. well yes thingadonta, we can all look back into the depths of the barely imaginable past with great satisfaction, since whatever the contingent happenings, nasty or nice, their progression lead directly to each and every one of us existing now (even the irredeemably naughty Robbo). However that shouldn't lead us to believe that we (or our near descendants) are bound to sail through major climate perturbations with happy faces, since our societies may very well adapt poorly to changes that might arise. After all during major extinction events, life can be hard and species do go extinct. I doubt that humankind is seriously in danger of terminal decline, but major climate change will likely provide severe strains on our societies, and things are likely to be tough to decidedly unpleasant. Of course we could look back at the dinosaurs for comfort and observe that they sailed merrily through (apparently) major climate swings involving atmospheric CO2 concentrations ranging from (apparently) as high as 5000 ppm (hot-hot) to (apparently) as low as 500 ppm (chilly-chilly). However that is to compress geological time to human proportions. In reality these climate changes (as far as we can tell) occurred over many 100's of 1000's and millions of years, and individual dinosaur species migrated, adapted, evolved, became extinct through these vast periods. The fact that some dinosaur species thrived in a hot world nearly 200 million years ago is not a good marketing ploy for a suddenly hot contemporary world.
    0 0
  21. vChris You are avoiding the essential points - and indulging in the usual absurd and peripheral ad hominem arguments. If Pope et el were wrong in their cross-section measurement - I will check it out it is not the end of the Earth. I will go back to this topic as I obviously missed the April 2009 paper. Damned how could that happen? Speculation on 55 million year old rocks may be fun but very uncertain and not immediately applicable to contemporary issues. No comment on the new Svensmark paper, Clement et al, Trenberth and Fasula? This is not uncertainty – but certainty about the additional and probably related mechanisms – decadal SST changes, cloud changes, significant additional shortwave forcing in the most recent period of warming between 1976 and 1998, lees shortwave forcing since and what was always a reasonable connection of cosmic rays to clouds. The latter reinforced yet again in a different and quite elegant observational approach to the subject. So now we have theoretical, statistical, experimental and observational support. And this is the planetary reality – no warming in the oceans and the atmosphere (the heat content for the system) for 10 years. The probability of no warming for another decade or two as the decadal pattern of changes in SST and clouds continue. Yes I could be wrong along with thousands of other scientists – but the planet keeps telling me I am right. I have had enough of the juvenile insults. Goodbye Chris. Robbo
    0 0
  22. The Pope abstract below – and links to a couple of recent blogs on the new study. I absolutely repudiate without any qualification any suggestion that I have misrepresented the science. http://rabett.blogspot.com/2009/07/science-lurches-forward-about-two-years.html http://chinese.eurekalert.org/en/pub_releases/2009-05/as-pmc050609.php Ultraviolet Absorption Spectrum of Chlorine Peroxide, ClOOCl Francis D. Pope, Jaron C. Hansen, Kyle D. Bayes, Randall R. Friedl, and Stanley P. Sander Jet Propulsion Laboratory, California Institute of Technology, Pasadena, California 91109 J. Phys. Chem. A, 2007, 111 (20), pp 4322–4332 DOI: 10.1021/jp067660w Publication Date (Web): May 3, 2007 Abstract The photolysis of chlorine peroxide (ClOOCl) is understood to be a key step in the destruction of polar stratospheric ozone. This study generated and purified ClOOCl in a novel fashion, which resulted in spectra with low impurity levels and high peak absorbances. The ClOOCl was generated by laser photolysis of Cl2 in the presence of ozone, or by photolysis of ozone in the presence of CF2Cl2. The product ClOOCl was collected, along with small amounts of impurities, in a trap at about −125 °C. Gas-phase ultraviolet spectra were recorded using a long path cell and spectrograph/diode array detector as the trap was slowly warmed. The spectrum of ClOOCl could be fit with two Gaussian-like expressions, corresponding to two different electronic transitions, having similar energies but different widths. The energies and band strengths of these two transitions compare favorably with previous ab initio calculations. The cross sections of ClOOCl at wavelengths longer than 300 nm are significantly lower than all previous measurements or estimates. These low cross sections in the photolytically active region of the solar spectrum result in a rate of photolysis of ClOOCl in the stratosphere that is much lower than currently recommended. For conditions representative of the polar vortex (solar zenith angle of 86o, 20 km altitude, and O3 and temperature profiles measured in March 2000) calculated photolysis rates are a factor of 6 lower than the current JPL/NASA recommendation. This large discrepancy calls into question the completeness of present atmospheric models of polar ozone depletion.
    0 0
  23. really Robbo? Where was the ad hominem? I pointed out that you misread the Zeebe paper and made a general point about "uncertainty" in science (my post #268); I pointed out that you (once again) made a big issue out of a paper that was subsequently shown to be incorrect, and made a general point about cherrypicking provisional interpretations in areas of scientific uncertainty (my post #269; you did this with the Palle paper you first introduced yourself with...you did it with the Schwartz paper on climate inertia...and now the Pope et al. paper) ...it's not ad hominem to point out things that are true. I was a bit cheeky in my post (#272). But playfully so - I hope you're not in a bad mood because you were beaten by the Poms at cricket last week (who's whinging now!). I did comment on the Clement et al paper I believe. It indicates that there is evidence of a positive feedback to warming in the cloud response. What else do you want me to say? I'd say it's rather provisional and not yet worth making a fuss over. Otherwise, I've introduced dozens of papers on this thread that you haven't commented on. Many of yours seem subsequently to be either effectively retracted (Schwartz), or shown to be incorrect (Palle; Pope et. al). No one suggested that Pope et al's mis-interpretation is "the end of the Earth". It's nothing of the sort...it's one of the glorious aspects of science to be wrong. The tedious thing is to jump upon provisional results that seem to go against the mainstream and use them to pursue political points. No one is taken in by that sort of advocacy, and it's not worth getting so worked up about stuff like that. As for your odd assertion of "the probability of no warming for another decade or two..." where on earth has that come from? Lean and Rind have a paper in press in Geophys. Res. Lett. that indicates that we're expecting some rather significant warming in the coming years [*]. So again there seems to be something wrong with your assertions. Have you been cherrypicking provisional analyses in areas of scientific uncertainty again? [*] Lean, J. L., and D. H. Rind (2009) "How will Earth's surface temperature change in future decades?" Geophys. Res. Lett., doi:10.1029/2009GL038932, in press. abstract: Reliable forecasts of climate change in the immediate future are difficult, especially on regional scales, where natural climate variations may amplify or mitigate anthropogenic warming in ways that numerical models capture poorly. By decomposing recent observed surface temperatures into components associated with ENSO, volcanic and solar activity, and anthropogenic influences, we anticipate global and regional changes in the next two decades. From 2009 to 2014, projected rises in anthropogenic influences and solar irradiance will increase global surface temperature 0.15 +/- 0.03 oC, at a rate 50% greater than predicted by IPCC. But as a result of declining solar acivity in the subsequent five years, average temperature in 2019 is only 0.03 +/- 0.01 oC warmer than 2014. The lack of overall warming is analogous to the period from 2002-2008 when decreasing solar irradiance also countered much of the anthropogenic warming. We further illustrate how a major volcanic eruption and a super ENSO would modify our global and regional temperature projections.
    0 0
  24. Robbo (re #274), you can "absolutely repudiate without any qualification" all you want, but you were again using a paper that was subsequently shown to be incorrect, to pursue a dreary political point. you said in your political post #266 (discursions on "tantric-sex" and "water birth" and so on...): "The ocean acidification notion seems reminiscent of past environmental scares - very light on data heavy on fear tactics. Did you know that DDT was approved for use by the World Health Organisation in 2006? I had to read the document myself to believe it. In 2007, chemists at NASA’s JPL remeasured the photolysis rate of dichlorine peroxide at almost 1/10th of what was required to explain ozone depletion. Ozone depletion seems largely to be the result of increased UV from the sun. Acid rain was never a problem – plants are of course adapted to a range of environmental conditions. " So you were using Pope et al's provisional result to pursue a political point (about "fear tactics" apparently - the dreary notion that ozone-depletion by CFC's is some sort of conspiracy theory). However Pope et al. were wrong (nothing wrong with being wrong, of course!). As was Schwartz who you used to pursue a conspiracy theory point about climate sensitivity...as was Palle which you used to pursue a point about moonshine (literally!). Unfortunately, you're cherry-picking your sources according to a preconceived (non-scientific) world view. You don't make an effort to find out whether the rare "oh-so-convenient" study that suits your view might has been re-addressed in the meantime. You should at least run any paper more than a couple of years old through "Google Scholar" to determine whether anyone (including the authors themselves) might have reinterpreted their analyses.
    0 0
  25. 'Sadly, the tedious pretence that uncertainty over second-order (and often rather peripheral) elements of phenomena somehow constitutes cause for doubting the essential elements of our understanding is creepy, but perhaps it was ever thus where science impacts on politics and vested-interest!' Duh. Or is this snide and silly?
    0 0
  26. The amount of carbon conceivably released from volcanism etc is not sufficient to explain the spike in carbon in rocks during the PETM. Some mechanism such as methane release from clathate is required as an explanatory mechanism. Methane is oxidised in the atmosphere to carbon products and these are incorporated into the geologic record. As I understand it, Zeebe et al suggest that there is not enough carbon in the record to explain warming with current models. Again, I don’t see any point in this that can be applied to contemporary conditions. My point was that that citing the PETM as an example of climate sensitivity to carbon dioxide, and with absolute conviction, was misplaced enthusiasm. Lean et al are demonstrably wrong – you simply have to look at the ISCCP cloud reconstructions from any number of sources – try the CERES, Earthshine and ISCCP graph on the Project Earthshine site. About a one percent change in Earth albedo since 1998 – or a decrease of 2 W/m2 reaching the surface. There is a preprint of an article discussing this here. http://bbso.njit.edu/Research/EarthShine/literature/Palle_etal_2008_JGR.pdf Lean has not included the ‘climatologically significant’ shift Earth in albedo into their discussion. How can they possibly understand recent trends and predict the future? Note Swanson and Tsonis - half of the warming between 1976 and 1998 was decadal climate shift. Note Trenberth and Fasula on the imnportance of recognising the cloud effects in the planetary heat budget. Note Clements et al on a decline in cloud adding to warming between 1976 and 1998. Cloud cover that has since increased. Anything that doesn't fit the mold is cherry picking, dodgy, incorrect, misinterpreted, speculative or ignored by the global whiners.
    0 0
  27. Amazing how cherry pickers can continue to furiously cherry pick while complaining about being accused of being cherry pickers! Science doesn't work by selecting the odd paper here and there, and even just selecting sentences within one paper, while ignoring the massive weight of evidence in all kinds of disciplines. Consensus doesn't mean everybody conspiring to present some ideologically-driven view (and there must be at least as many right wing scientists as left wing, perhaps more, certainly in some disciplines), it means that the vast majority of scientists, and the published work, presents an absolutely coherent picture. Just as, say, cosmology does, or medical research. There may be odd niggling things here and there, or the odd scientist who remains certain of the cheesy composition of the moon, or that AIDS isn't caused by HIV, but even if such people fluke a hit, they don't affect the overall body of knowledge. So cherry pick away, but while you do, CO2 keeps rising, its greenhouse properties remain indisputable, temperatures rise, ice melts, climatic records continue to be set and odd events continue to occur, and plant and animal species begin to respond. The planet doesn't care about the cherry picking, just about the reality of an unprecedented and accelerating speed of warming.
    0 0
  28. Science proceeds by examining the evidence. The evidence is for decreased cloud cover to 1998 and increased cloud cover since. There is an alternative strand of evidence on multidecadal climate shift. And yes - usually one scientist (and then a few more)does dramatically change the ways things are understood. These are caled paradigm shifts.
    0 0
  29. The "paradigm shift" was the recognition that climate was changing as a result of greenhouse gas emissions. Your imaginary paradigm shifts are the result of a small group of people, with a range of motives, trying to turn the clock back. In this you are just like the creationists, who want to send biology back 200 years while pretending to be investigating "intelligent design". You might be fooling yourself Robbo, and I'll give you the benefit of the doubt that that is what you are doing, but you aren't fooling too many others.
    0 0
  30. RE:279 David, you need to re-examine your philosphical positions. Here are some points to consider. In complex, chaotic systems (EG stockmarket/economics, climate) the ones who usually get it wrong are those who over-simplify, and those who are over-confident in what can't be easily modelled or predicted. There is a fundamental difference here between complexity and simplicity, both viable scientific positions. This is largly the difference between views here, those who proscribe to complexity and chaos (e.g. in Crichton's Jurassic Park- the mathematician and 2 paleontologists, as opposed to the lawyer and developer- you know the story-which also neatly explains Crichtons position on global warming), and those who don't. "...an absolutely coherent picture". Your choice of words 'absolutly coherant picture' is revealing. This is an assumption taking the position of 'simplicity' in scientific systems, which also attmepts to smooth out 'chaos'. The trouble is, you are not dealing with a simple system. Small variations within complex chaotic systems can have large effects (this is also uually the reason that 'planned' economies fail). Medical research and cosmology also have aspects which are complex, and which are still uncertain. As does climate, such as just how much does the physics of rising c02 affect world temperature. World class physicists and many others still dont agree on this, they are not AIDS deniers or cheesy moon lunatics. They are reputable and varied scientists. Those who attmept to simplify uncertainties within complex systems are also often politically driven. As for "unprecedented and accelerating speed of warming". This sort of statement is not going to convince thinking scientists, because 1) you havent disentangled solar forcings and 2) it is simply not true. Temperature rose as fast or faster in Europe per decade immediately after/around the end of the Little Ice Age -per decade- than between the 1970s-1990s; T in the USA rose as fast in the decades to the 1930s compard to the decades to the 1990s. So the T rise it is not 'unprecedented' even in contemporary times. Neither is the rise 'accelerating', it is slowing down, or a relatively constant rise, depending on what starting and end points you use, (whether decadal, centurial or whatever). It is entirely comparable to previous rises-eg it is within normal variation/cycles, particularly the 1470 year solar cycle trend. You can keep parroting out these usual green phrases of 'unprecedented' and 'accelerating', but once a naive population is exposed to these sort of parroted phrases for long enough, they become immune, just like to a new virus, especially as the effects of the virus (meme)declines.
    0 0
  31. This is a nice story from NASA that examines the implications of solar irradiance changes over the 20th century. http://www.nasa.gov/centers/goddard/news/topstory/2003/0313irradiance.html I don't think anyone has ever said that CO2 is not a greenhouse gas - but that there are multiple other factors involved. Clouds have been addressed very poorly to date - by any account. Decadal climate shifts seem finally to be emerging from oceanograohy and hydrology into climate physics - and physicists still do not understand them very well. Look at the additional evidence on clouds in particular and - my favourite - the changes in SST surface temperature on decadal timescales that have decadal long implications for GMT and rainfall. It is not enough to go off on some other tangent and accuse me of being equivalent to a creationist.
    0 0
  32. Well Robbo, Thingy, it's been nice. Now that I've converted you guys you stay converted, you hear me? Stay away from denialist blogs and tabloid newspapers and books by geologists for awhile. Promise me now. Spend some time outside, smell the flowers, look for clouds in the shapes of animals, enjoy the sunsets. Think about the future. Have a great life.
    0 0
  33. Hey Robbo, what about climate cool lag? Nobody has mentioned this yet. ('Where's my global warming dude' is a funny website. "The science is settled... but somebody forgot to tell mother nature".). I think the 'cool lag' (if that is the right word-I really don't think it is) in thermodynamics is usually a bit shorter than heat lag, but I'm not really sure about the timing and what magnitude occurs in cooling once a system reaches 'equilibrium' with heat slowly declining. This would have implications IF the sun is driving recent 20th warming and c02 has little effect; what is T then going to be doing in the next few years/decades?. The sun does appear to be waning slightly. Some of the russians (reputable qualified peer-reviewed published scientists, despite Horton's loud protests with a 'consensus' blindfold on-ie there is an 'overwhelming consensus', but only amongst those who agree with you), predict lower T over the next few decades levelling out around 2050? based on various sun analyses, but I dont know how 'immediate' this effect will be over the next few years, (if of course it is the sun driving warming recently). It might even be in line with the flattening of T over the next decade or so, as predicted by some alarmists (eg realclimate-probably to cover themselves), or perhaps they secretly believe the sun is the driver of recent T after all?
    0 0
  34. re:272 Chris "The fact that some dinosaur species thrived in a hot world nearly 200 million years ago is not a good marketing ploy for a suddenly hot contemporary world". Actually there was an adaptive radiation (explosion) of dinsoaurs in the Jurassic as the world warmed, c02 rose, and continents broke up. You emphasise the rate of c02 changes in biosphere adaptability etc, but this does skittle over one major point. High C02 geologically is associated with high biodiversity and thriving plant (feeding of the c02) and animal life (which feed off the plants). This is also why there was an explosion of mammallian evolution at PETM 55Ma (see Wiki entry on PETM). (Love that C02!). Colder climates are generally associated with increased worldwide desertification and extinction. Warm periods and higher c02 produces biodiversity. One certainly doesn't hear this from the AGW side. In fact there is no getting around it, even "requiring some rather bottom-squirming dissembling to argue away this evidence", as you might put it. However I do note that the contention here is the rate of change, rather than just the warming.
    0 0
  35. re #288 Not realy thingadonta. The notion that biodiversity thrives under high CO2/warm-hot periods is one of those fallacies that one thinks must be true, but actually seems not to be. We've already seen that most of the major extinction events through the Phanerozoic are associated (where this is characterized) with greenhouse gas enhancement through tectonic processes, high temperatures, ocean acidification/anoxia etc. (see my post #257). In the more general case, high temperaures are associated with low biodiversity and vice versa, as indiated by detailed examination of the fossil record: *PJ Mayhew et al. (2007) A long-term association between global temperature and biodiversity, origination and extinction in the fossil record Proceedings of The Royal Society B 275, 47–53. Abstract: The past relationship between global temperature and levels of biological diversity is of increasing concern due to anthropogenic climate warming. However, no consistent link between these variables has yet been demonstrated. We analysed the fossil record for the last 520Myr against estimates of low latitude sea surface temperature for the same period. We found that global biodiversity (the richness of families and genera) is related to temperature and has been relatively low during warm 'greenhouse' phases, while during the same phases extinction and origination rates of taxonomic lineages have been relatively high. These findings are consistent for terrestrial and marine environments and are robust to a number of alternative assumptions and potential biases. Our results provide the first clear evidence that global climate may explain substantial variation in the fossil record in a simple and consistent manner. Our findings may have implications for extinction and biodiversity change under future climate warming. Hollywood films with Sophia Loren are simply not a good means of informing oneself on the subject of biodiversity. One really has to address the evidence ! Likewise, high temperatures seem to have the effect of greatly delaying for long, long periods, the recovery of biodiversity following greenhouse-induced extinction events; e.g. : Fraiser ML et al. (2007) Elevated atmospheric CO2 and the delayed biotic recovery from the end-Permian mass extinction Palaeogeog. Palaeoclim. Paleoecol. 252, 164-175 Abstract: Excessive CO2 in the Earth ocean-atmosphere system may have been a significant factor in causing the end-Permian mass extinction. CO2 injected into the atmosphere by the Siberian Traps has been postulated as a major factor leading to the end-Permian mass extinction by facilitating global warming, widespread ocean stratification, and development of anoxic, euxinic and CO2-rich deep waters. A broad incursion of this toxic deep water into the surface ocean may have caused this mass extinction. Although previous studies of the role of excessive CO2 have focused on these "bottom-up" effects emanating from the deep ocean, "top-down" effects of increasing atmosphere CO2 concentrations on ocean-surface waters and biota have not previously been explored. Passive diffusion of atmospheric CO2 into ocean-surface waters decreases the pH and CaCO3 saturation state of seawater, causing a physiological and biocalcification crisis for many marine invertebrates. While both "bottom-up" and "top-down" mechanisms may have contributed to the relatively short-term biotic devastation of the end-Permian mass extinction, such a "top-down" physiological and biocalcification crisis would have had long-term effects and might have contributed to the protracted 5- to 6-million-year-long delay in biotic recovery following this mass extinction. Earth's Modern marine biota may experience similar "top-down" CO2 stresses if anthropogenic input of atmosphere/ocean CO2 continues to rise. The contemporary situation is potentially very serious due to the rapid rate of change, combined with the equally problematic (if not more serious right now), confounding issues of massive deforestation, more generalised habitat destruction/degradation and over-exploitation: Brook BW (et al. (2008) "Synergies among extinction drivers under global change" Trends in Ecology and Evol. 23, 453-460 Abstract: If habitat destruction or overexploitation of populations is severe, species loss can occur directly and abruptly. Yet the final descent to extinction is often driven by synergistic processes (amplifying feedbacks) that can be disconnected from the original cause of decline. We review recent observational, experimental and metaanalytic work which together show that owing to interacting and self-reinforcing processes, estimates of extinction risk for most species are more severe than previously recognised. As such, conservation actions which only target single-threat drivers risk being inadequate because of the cascading effects caused by unmanaged synergies. Future work should focus on how climate change will interact with and accelerate ongoing threats to biodiversity, such as habitat degradation, overexploitation and invasive species
    0 0
  36. "The heat doesn't hide, this is the kind of ..." There might be some heat hiding in melted ice and parmafrost as internal kinetic energy equal to the enthalpy of fusion of water. This is a millimetre/year currently as melted icewater in the oceans. And some soil warms up. So where is all the heat from the radiative imbalance of the planet hiding? As it is apparently not in the oceans or atmosphere. Biology thives within reason I said and the anthropogenic C02 flux is a fraction of the natural cycle - most especially that below the thermocline. Cheers Robbo
    0 0
  37. re:287 Chris: I've never seen a Sophia Loren movie with anything to do with biodiversity but I wish I had. I'm extremely skeptical from my readings in geology that warmer periods dont correlate with biodiversity, and with higher c02, but I would have to read the recent papers. I hope they arent twisting the evidence. I think those papers may be actually examining 'rates' of warming, and smearing this into 'general' warming periods, but I would have to read them. I DO know that there is an association with increased desertification and colder periods. Deserts, for example expanded and savannahs increased in Africa around 4-7 Ma as the earth continued to cool, which is quite possibly how the savannah ape evolved (and argues about such effects). We are here probably because cooling shut down the forests in Africa, and enlarged the savannah, possibly also changing the balance of savannah peak/predator relationships etc and the availability of meat with the increase in grazing animals. Ice ages followed which may have gradually enhanced our dominance over other animals through reduced predation? etc. I certainly think there is some connection to the evolution of intelligence and the onset of worldwide ice ages, possibly with a concomittant reduction in competition/ biodiversity/predator-prey relationships (??). You didn't address the PETM 55 Ma mammalian explosion- one can read about it on the WIKI PETM entry. Makes an interesting connection though, severe stress then explosive evolution? What is going on here? Does severe stress increase rates of speciation, or does it produce extinction? Seems like more climate ambiguities. I am just thinking out loud, but thanks for the papers.
    0 0
  38. Just a small point Chris...the hypothesis that CRF effects cloud nucleation ( principally at low level) does not require CRF to vary. If you vary WV concentration whilst CRF remains constant you would achieve the same result - a variation in cloud nucleation.
    0 0
  39. Let me just pipe in, this article and the discussion during the last pages is very interesting for me to read, because it nicely summarizes what was buggering me the last weeks during my own personal quest for knowledge (TSI, lag, "heat storage", CO2 levels, PETM, evolution, etc.). I think some findings will always be open to interpretation, but the important thing is that all findings are on the table. Please continue to bring on your findings and your personal interpretation of it!
    0 0
  40. thingadota, I also have read the Wiki article on PETM with great interest. However, keep in mind that the "sudden" shift of temperature probably still strechted over thousands of years. Plenty of time for adaptation for flora and fauna. Also, the continents and oceans had totally different positions, resulting in a global mediate climate, which for example allowed for forest vegetation up until the poles. Therefore, I think we cannot assume that a sudden shift in temperature combinded with a rise in CO2 is positive for evolution. Last point, "explosive" evolution seems always triggered when a high stress on life conditions forces lifeforms to adapt; which means, they die and only newborn with genetic mutations fitting to the new conditions have a chance for survival. From all this, I don't think that the PETM events really translate into a positive outlook for our current, soon about 9 billion, human lifeforms for the next centuries.
    0 0
  41. My understanding from hearing paleo talks is that rapid species radiation following a severe event is pretty common. A proposed model is that in normal times, the competition for resources means that most mutations are unsuccessful. After the stress is removed and many niches are depopulated, then all sorts of mutations manage to survive because the pressure for resources is reduced, greatly increasing the scope for speciation.
    0 0
  42. Side Note: PETM warming is usually presented in simple form as 6C over 20k years or 5C over 12k years. If we get 3C from 1850 to 2150, we'll be warming at 24 times the latter PETM rate.
    0 0
  43. On the time lag... I don't understand two things here from the article: First, the TSI increase is said to be only "between 0.17 W/m2 (Wang 2005) to 0.23 W/m2 (Krivova 2007) since the Maunder Minimum". In the essay from Wang 2005 , I found this graph in figure 15, where you have the TSI from three studies compared, and you can eyeball an increase from 1 W/m2 to 2,5 W/m2 from the different curves. Second, it is said that "Hansen 2005 estimates the climate lag time is between 25 to 50 years", and then "climate reached radiative equilibrium around the late 80's (give or take a decade)". If I count from 1960 onwards and assume 50 years, there could be a lagged warming until 2010 (which of course does not exclude additional warming by GHG).
    0 0
  44. Falkenherz, In Wang 2005 they are reporting the solar constant S, which will be the flux of energy received by a flat disk facing the sun. However as the earth is a sphere, one will need to adjust this in order to make proper comparison with black body radiation and greenhouse gas forcing in simple climate models. For the earth with radius R, the rate of energy intercepted by the earth is given by S*π*R^2 (in Watts). In simple conceptual climate models this is assumed to be evenly distributed on the earth which has a surface area of 4*π*R^2, and thus the solar irradiance is in fact: S*π*R^2/4*π*R^2 = S/4 The solar constant S is about 1366W/m^2, which translates to about 341W/m^2 in the context of radiative balance for the earth. In addition the change in solar forcing is only 1/4 of the change in solar constant. In figure 15 of Wang et al. 2005, the bottom curves is the estimation from Lean 2000, whereas the Wang et al. approach gave the top two curves, which has an increase of less than 1 W/m^2 for S. Diving this by 4 gives an increase of at most 0.25 W/m^2 in solar forcing. THe 0.17W/m^2 figure quoted in this article is likely based on the thick solid curve in fig 15 of Want et al. 2005. Regarding the lag: I think the point is that if the current warming is solely a response to the increase in solar irradiance prior to 1950, then we should've seen a decrease in radiative imbalance over a period of 25-50 years, but radiative imbalance is in fact increasing (according to Hansen 2005 for example).
    0 0
  45. IanC, thank you very much, your explanation helped also for understanding a lot of other things which puzzled me (I cannot read mathematical formulas). Regarding the lag: I understand that a decrease in radiative imbalance from TSI is countered by a raising GHG-forcing. The point of the more serious sceptics is that they don't deny GHG-forcings but believe that it is overestimated and GHG is only a lagged "top-up" to (also lagged) TSI-forcings. So, we have two temperature lags to account for: TSI-lag, and a top-up CO2 lag. Could it be that TSI had a slow but constant increase over the last 150 years, and rising GHG-levels continue the resulting upward trend of global temperature for a little while before the imbalance from dropping TSI causes global temperature to finally drop? This would result in a long term curve similar to those seen in the arctic ice cores. If that was true, then we should see that, despite still raising CO2-levels for the next centuries, the global temperature should nevertheless drop after, say, another 50-100 years: As I understand from the ice cores, CO2 was still raising about 800 years while temperature was already dropping, but the known effects of CO2 implies that TSI must have been dopping x years before the temperature actually dropped. (I don't know if I explained that clear enough) So far the theory; but I think I also read that the radiative forcing of CO2 alone is about 3,4W/m2 (compared to ~ +0,25W/m2 TSI since 1700)? I also understand that rising CO2levels are large part antropomorphic. However, I am not sure if these factors would contradict said theory or just result in a longer raise of CO2 and temperature before finally temperature has to follow the downwards trend from a long term weaker TSI (which I am not sure we can assume after just 50 years of exact measuring and another 150 years historical approximations). (Another argument and excurs: We have had huge spikes of CO2 in early earth history, x thousands of ppm, and it is said it was "countered" by a very much weaker TSI at those times. But we don't know the exact relations; for example, if TSI at those times was a bit stronger than we believe, then CO2 necessarily must have had less effect than assumed.) Sorry, a lot of different thoughts, and I admit it is difficult to keep things apart.
    0 0
  46. Falkenherz, it is hard to follow you and to know what you actually mean. For instance, I don't believe you "cannot read mathematical formulas". Your paragraph starting with "Could it be ..." is not a theory, but speculation. That this speculation is not supported by any evidence is answered by yourself in the next paragraph. The two numbers you listed, called climate "forcings" are different, and unless you assume that 0.25 is bigger than 3.4 (note that the unit is the same, i.e. the impact on the planet is not another degree removed from this number), I do not see how you can make it support your speculation. Perhaps if you listed those "more serious sceptics" you talk about, it would be easier for us to understand what it is you want to get at. And just in case: People claiming that GHG forcing is much smaller than the number you listed are not "serious sceptics". Regarding very early Earth history, there is no reason to assume that high CO2 (likely not in "spikes" though) concentrations in the atmosphere had much different physical impact then than today. That it was not extremely warmer such as would be expected from its greenhouse properties, can indeed be explained by a fainter sun. That we may not know the "exact relations", better said the exact concentrations of CO2, levels of T, and TSI, has to do with the fact that scientists cannot retrieve these values with as high confidence (or not at all) from the proxies used as they can from younger Earth ages. Your conclusion "then CO2 necessarily must have had less effect than assumed" would only be supported if we knew T and TSI for these ages well enough and could exclude that TSI was below a certain value. Remember: Uncertainty cuts both ways. And because uncertainty for the climate during these Earth ages exists des not undermine what we know about CO2 and climate at present time.
    0 0
  47. The climate sceptics I consider more serious argue that the known forcing of 3,4W/m2 is associated with a too high climate sensitiviy, and the part of global warming actually caused by GHG is much lower. Their main argument seems to be what I tried to reproduce here, that long-term TSI increase and lags of its transformation in global warming are not considered properly as an explanation (basically, since the little ice age, hundreds of years of increase of TSI should have more impact than a 50 year CO2-development of +3,4W/m2). As uncertainty cuts both ways, they consider current knowledge as not enough in order to accept the AGW-theory for more than speculation, as long as possible other theories are not as intensively examined and researched.
    0 0
  48. BTW, I am not entirely sure; is the 3,4W/m2 current data or the calculated rate for a CO2-doubling?
    0 0
  49. Falkenherz could you please elaborate on the claim that 0.25 W/m2 of TSI increase in a couple of centuries should have more impact than 3.4 W/m2 in 50 years? I can't see how one can reach this conclusion.
    0 0
  50. Falkenhertz, which "serious" climate skeptics would you be talking about? The forcing from GHGs is much larger than the solar radiative forcing (see for example here). It is the dominant component forcing climate at the moment. Feedbacks (water vapour, carbon cycle, albedo etc) operate in response to any forcing, and do not select one forcing over another. "they consider current knowledge as not enough in order to accept the AGW-theory for more than speculation" ... the theory of climate is based on an awful lot more than speculation (also here and here) - you may want to check that your sources have not been feeding you fairy tales. ... as long as possible other theories are not as intensively examined and researched. Do you seriously thing that other theorieshypotheses have not been thoroughly researched?
    0 0

Prev  1  2  3  4  5  6  7  Next

You need to be logged in to post a comment. Login via the left margin or if you're new, register here.


The Consensus Project Website

THE ESCALATOR

(free to republish)


© Copyright 2024 John Cook
Home | Translations | About Us | Privacy | Contact Us