Climate Science Glossary

Term Lookup

Enter a term in the search box to find its definition.

Settings

Use the controls in the far right panel to increase or decrease the number of terms automatically displayed (or to completely turn that feature off).

Term Lookup

Settings


All IPCC definitions taken from Climate Change 2007: The Physical Science Basis. Working Group I Contribution to the Fourth Assessment Report of the Intergovernmental Panel on Climate Change, Annex I, Glossary, pp. 941-954. Cambridge University Press.

Home Arguments Software Resources Comments The Consensus Project Translations About Support

Bluesky Facebook LinkedIn Mastodon MeWe

Twitter YouTube RSS Posts RSS Comments Email Subscribe


Climate's changed before
It's the sun
It's not bad
There is no consensus
It's cooling
Models are unreliable
Temp record is unreliable
Animals and plants can adapt
It hasn't warmed since 1998
Antarctica is gaining ice
View All Arguments...


Username
Password
New? Register here
Forgot your password?

Latest Posts

Archives

Solar Hockey Stick

Posted on 13 April 2011 by dana1981

Vieira et al. recently posted a paper on arXiv preprint service which will later be published in the journal Astronomy & Astrophysics on a reconstruction of total solar irradiance (TSI) over the Holocene (the past 11,500 years).  The scientists reconstruct TSI using a reconstruction of the solar magnetic flux.

"The evolution of the decadally averaged magnetic flux is computed from decadal values of cosmogenic isotope concentrations recorded in natural archives employing a series of physics-based models connecting the processes from the modulation of the cosmic ray flux in the heliosphere to their record in natural archives...We present the first physics-based reconstruction of the total solar irradiance over the Holocene, which will be of interest for studies of climate change over the last 11500 years. The reconstruction indicates that the decadally averaged total solar irradiance ranges over approximately 1.5 W/m2 from grand maxima to grand minima."

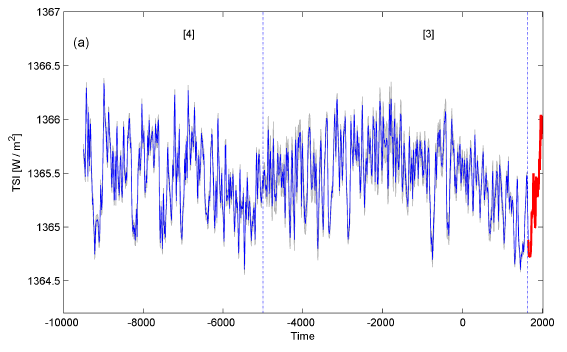
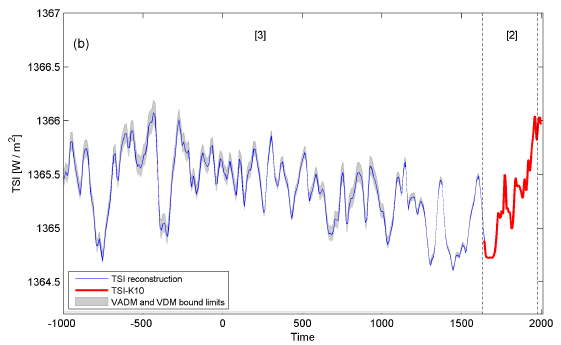
Vieira et al. provide figures depicting their TSI reconstruction over various periods, including the entire Holocene (Figure 1) and the past 3,000 years (Figure 2).
Holocene TSI

Figure 1: Vieira TSI reconstruction over the past 11,500 years
3000 year TSI

Figure 2: Vieira TSI reconstruction over the past 3,000 years

Interestingly, Figure 2 looks rather hockey stick-like.  But before we declare this as proof that the Sun is causing global warming, let's quantify this solar contribution to the global surface temperature change.

Quantifying Solar Warming

The solar radiative forcing is the change in total solar irradiance (TSI) in Watts per square meter (W/m2) divided by 4 to account for spherical geometry, and multiplied by 0.7 to account for planetary albedo (Meehl 2002).  The albedo factor is due to the fact that the planet reflects approximately 30% of the incoming solar radiation.  As with CO2, we calculate the equilibrium temperature change by multiplying the radiative forcing by the climate sensitivity parameter (λ).

The climate response to different radiative forcings is similar, but not identical.   This is known as the "efficacy" of a radiative forcing.  According to various studies of the direct solar forcing efficacy (from TSI alone), as summarized by the IPCC, it is likely smaller than the CO2 efficacy.  However, since there may be indirect solar effects not accounted for in the direct solar radiative forcing calculation, we'll conservatively estimate the solar climate sensitivity parameter as equal to the CO2 climate sensitivity of 0.8 (W/m2-K).

As shown in Figure 2, TSI has increased approximately 1 W/m2 over the past 200 years, from approximately 1365 to 1366 W/m2.  Plugging this change in TSI and the climate sensitivity parameter into the formula above, we find that it should have caused approximately 0.14°C warming of global surface temperatures over the past 200 years, and even less over the past 100 years (closer to 0.1°C).

It's Still Not the Sun

Considering that the average surface temperature has risen 0.8°C over the past century, this is a relatively small solar contribution.  Moreover, as Vieira et al. also discuss, TSI has not increased over the past 50+ years.  During this time the surface temperature has increased approximately 0.6°C.  So despite this solar hockey stick, there is still no basis to the myth "it's the sun".

Solar Contribution to Previous Climate Changes

We can also make use of the reconstructions in Vieira (2011) to evaluate the solar contribution to previous climate changes, such as the Little Ice Age (LIA; roughly  1550 to 1850 AD), the Medieval  Warm Period (MWP; roughly 800 to 1200 AD) and the Roman Warm Period (RWP; roughly 200 BC to 400 AD).

Ljungqvist reconstruction

Figure 3: Northern Hemisphere land temperature reconstruction from Ljungqvist (2010)

Overall during the MWP, there was little change in TSI.  However, it did increase approximately 0.2 W/m2 from in the years leading up to 1000 AD.  This would correspond to a 0.04°C increase in global surface temperature, or perhaps as much as 0.05°C in land surface temperature, as reconstructed through proxy measurements like Figure 3.  Thus TSI appears not to have played a particularly large role in the MWP, accounting for perhaps 10-20% of its peak warming.

There was similarly little change in TSI over the entire RWP.  But similarly, in the years leading up to 0 AD, there was perhaps a 0.2 W/m2 increase in average TSI.  Thus solar irradiance played a role in the modest Roman warming as well.

There was a fairly steady decline in temperature between the peaks of the MWP and LIA.  During that time, TSI decreased approximately 0.5 W/m2.  This corresponds to a decrease of approximately 0.07°C in average global surface temperature, or close to 0.1°C in land surface temperature.  This is a significant contribution to the LIA cooling, but still only about 10-20% of the overall temperature decrease.

Conclusion

Overall, TSI has remained relatively steady over the past 3,000 years, and indeed, over the entire Holocene.  Therefore, directly at least, the sun appears not to be responsible for significant global temperature changes over the past 11,500 years, and certainly not over the past half century.

0 0

Printable Version  |  Link to this page

Comments

Prev  1  2  

Comments 51 to 79 out of 79:

  1. Albatross, if you are going to imply that I am attempting to inflate uncertainty or whatever, can you please do me the courtesy of actually quoting me where I am doing this? From my POV, I have not talked about whatever uncertainties may exist at all. I have simply disagreed with dana's means of accounting for indirect effects. Am I not allowed to disagree with him? You are doing your cause much more harm than good here.
    0 0
    Moderator Response: [DB] Albatross' point was this: You are disagreeing for the sake of disagreeing, which is your right as a person. But don't expect anyone reading your words to place any weight on them as you provide no links to substantive peer-reviewed publications which support your positions. Essentially, you are hand-waving, and thus committing intellectual seppuku.
  2. I am not disagreeing to disagree, I am disagreeing *because* I disagree and to the extent that I am handwaving it was an effort to forestall the inevitable Get-thee-to-a-nunnery response that I am off-topic. There are plenty of people who have suggested non-linear responses to indirect solar proxies for example see here. http://rspa.royalsocietypublishing.org/content/462/2068/1221.full
    0 0
  3. shawnhet #31 Let's review the bidding for a moment. In Shawnhet #18, you said "Since we can be pretty sure that most of the leading candidates for indirect effects do not vary linearly with TSI ..." and in #19 Dana asked you to substantiate that claim. After a bit of back and forth, you substantiated that claim with the link to Frohlich et. al., "Correlation between Cosmic Ray intensity and Total Solar Irradiance during the last three solar cycles" and pointed us specifically to figure 5. Yet if we read the text, Frohlich et. al. tell us that there is a linear function that describes the correlation, namely TSI = Phi * 3.13 + 1363.7 So I fail so see how this substantiates your claim at all. Just because R < 1, that does not mean the relationship is non-linear.
    0 0
  4. Shawn, "and to the extent that I am handwaving it was an effort to forestall the inevitable Get-thee-to-a-nunnery response that I am off-topic." Surely you jest? Now your hand waiving is someone else's fault? "There are plenty of people who have suggested non-linear responses to indirect solar proxies for example see here" That may be true, but again, one does not need to invoke GCRs or some other hitherto unknown mechanism to explain the observed warming. Surely you agree with that much? And for every paper you quote showing that GCRs may have a discernible (yet tiny) impact of global SATs, I and others can show you and readers here papers which demonstrate that GCRs are not the silver bullet that 'skeptics' wish them to be. Again, Occam's razor Shawn.
    0 0
  5. Albatross #20 Why is the Feulner and Rahmstorf (2010) paper always used here as the last word on the effects of a new grand minimum on future climate? The link is broken by the way. I have the original paper, five pages of model predictions with questionable assumptions and circular reasoning, as the conclusions are assumed in the premise. The climate sensitivity to CO2 doubling is from private communications with A. Levermann, 3.4 C. And I see you have a convenient answer for the correlation between solar cycle length and global temperature anomalies. But your sources are outdated and don’t even consider that cycle 24 demonstrated the deepest minimum in over 100 years, please see updated solar cycle length. The evidence for possible future cooling based on cycle 24 being so quiet, should neither be dismissed or overlooked.
    0 0
  6. Albatross, "Surely you jest? Now your hand waiving is someone else's fault?" Hey, for all I know I may have totally misinterpreted the moderators approach, I was just explaining myself to the moderator. I was pointed to the cosmic ray thread a couple of times so I assumed that I was already skirting being OT. "That may be true, but again, one does not need to invoke GCRs or some other hitherto unknown mechanism to explain the observed warming. Surely you agree with that much?" I would pretty much agree with you *if* you qualify your statement for recent warming only. I think that there are plenty of longer term climate changes that do require some unknown mechanisms to explain them. Now, since I have answered your questions can you please point to what, specifically, it was that made you claim that I was sowing doubt or whatever? Keith, I agree that in the paper they find a linear correlation btw phi and TSI, however, that relationship does not hold constantly either on the short-term or extremely long-term time scales. Cheers, :)
    0 0
    Moderator Response: [DB] Still committing credibility seppuku.
  7. Is it not common knowledge at least that GCR changes with Earth's motion relative to the spiral arms of the galaxy?
    0 0
    Moderator Response: [DB] Shawn, this is not a debate or rhetoric forum (in which you'd also be doing poorly), this is an online community for the discussion of science. Unless you can provide contextual understanding of your points supported by linked peer-reviewed published science, no one here will take you seriously. Obviously, neither of us wish for that to happen. In your above comment, you provide no additional commentary for anyone reading it to understand why you write what you wrote or even that you understand it yourself, let alone how it is germane to the topic of this thread.
  8. Honestly, I have no clue what you were talking about in your previous comment so it is pretty much impossible for me to give more detail until I understand what you are talking about. Just throwing an offhand comment that I am committing seppukku is not helpful. Am I precluded from making any statements at all including of my own opinion that are not referenced in peer review literature? No one else on this thread is handcuffed to this extent.
    0 0
  9. Shawn @58, "Just throwing an offhand comment that I am committing seppukku is not helpful. " Re credibility seppuku-- that is not a comment or opinion, it is an empirical observation based on your posts here. You are entitled to your opinion, but do not expect to overturn credible science or make compelling arguments by talking through your hat. Re "That may be true, but again, one does not need to invoke GCRs or some other hitherto unknown mechanism to explain the observed warming. Surely you agree with that much?" OK, I think that we finally agree on something--I am referring to the observed warming since the early sixties, when TSI and global SATs traces diverged.
    0 0
  10. Albatross:"Re credibility seppuku-- that is not a comment or opinion, it is an empirical observation based on your posts here. You are entitled to your opinion, but do not expect to overturn credible science or make compelling arguments by talking through your hat." What are you talking about? If I am objectively trying to overturn science, what science am I trying to overturn? Please be *specific* because I *don't know* what you mean. Is there a reference which says that we can represent all indirect solar forcings as multiples of TSI? I am unaware of such, and, frankly, if there is such a reference you would be better off just providing it rather than continuing to make unsupported claims.
    0 0
  11. shawnhet wrote: "I think that there are plenty of longer term climate changes that do require some unknown mechanisms to explain them." I don't agree... and would have to wonder if you could name any of these "plenty" of long term changes... but it doesn't seem to matter. You've acknowledged (post #47) that most of the recent warming has been caused by greenhouse gas accumulation. At which point all this 'non-linear solar' and 'cosmic ray' stuff comes down to irrelevancy. Maybe they could have some kind of major effect under some kind of wacky circumstances... but they aren't right now (because the most pronounced warming spike of the past few thousand years or more is being driven mostly by GHGs) and there is no reason to think they are going to start doing so. Could some unforeseen climate forcing come along in the future and change everything? Sure. However, until there is actually some evidence of that it doesn't matter. The climate forcings we DO know about are having observed impacts which need to be addressed.
    0 0
  12. Dana1981, when you say "If you want to argue that this forcing isn't driving global warming, you need both a low climate sensitivity and a larger "natural" forcing." you are speaking about the long run. Sensitivity is not a constant, it varies as a function of weather. It is likely that sensitivity was higher in the 1990's and enhanced the CO2 warming. It lowered in 2000's to amplify less. No "natural" forcings are needed to attain the variations in warming that we have seen although they are also possible inputs. CBDunkerson, the volcanic response may be short term, but having more frequent volcanoes turns into stratospheric warming over longer periods (e.g. early 20th century). Having less frequent volcanoes (late 20th century with two exceptions) means longer run stratospheric cooling. There is no equilibrium for the stratosphere since it is hit with changing factors from above (solar UV) and below (volcanoes, large scale weather patterns). We are currently in a stratospheric cooling pattern, with some very large magnitudes like NH last winter, due to GHG as a constant over the long term, plus the varying but ongoing short term factors I listed above.
    0 0
  13. Sorry , my fault, A few citations, which recently I put on this site: Sub-Milankovitch solar forcing of past climates: Mid and late Holocene perspectives, Helama et al., 2010.: “The observed variations may have occurred in association with internal climate amplification (likely, thermohaline circulation and El Niño–Southern Oscillation activity). THE NEAR-CENTENNIAL DELAY in climate in responding to sunspots indicates that the Sun's influence on climate arising from the current episode of high sunspot numbers may not yet have manifested itself fully in climate trends. Testing solar forcing of pervasive Holocene climate cycles, Turney et al., 2005. : “The cycles, however, are not coherent with changes in solar activity (both being on the same absolute timescale), indicating that Holocene North Atlantic climate variability at the millennial and centennial scale is not driven by a linear response to changes in solar activity.Cyclic variation and solar forcing of Holocene climate in the Alaskan subarctic, Hu et al., 2003.: “Our results imply that small variations in solar irradiance induced pronounced cyclic changes in northern high-latitude environments. They also provide evidence that centennial-scale shifts in the Holocene climate were similar between the subpolar regions of the North Atlantic and North Pacific, possibly because of Sun-ocean-climate linkages.” Response of Norwegian Sea temperature to solar forcing since 1000 A.D., Sejrup,2010.: “The correlations are synchronous to within the timescale uncertainties of the ocean and solar proxy records, which vary among the records and in time with a range of about 5–30 years. The observed ocean temperature response is larger than expected based on simple thermodynamic considerations, indicating that there is dynamical response of the high‐latitude ocean to the Sun.Swingedouwet al., 2010. lag TSI - temperature - 40-50 years - regional NH. The influence of the de Vries (∼200-year) solar cycle on climate variations: Results from the Central Asian Mountains and their global link, Raspopov et al. 2006.: “An appreciable delay in the climate response to the solar signal can occur (up to 150 years). In addition, the sign of the climate response can differ from the solar signal sign. The climate response to long-term solar activity variations (from 10s to 1000s years) manifests itself in different climatic parameters, such as temperature, precipitation and atmospheric and oceanic circulation.” Mid- to Late Holocene climate change: an overview Wanner et al., 2008: „On decadal to multi-century timescales, a worldwide coincidence between solar irradiance minima, tropical volcanic eruptions and decadal to multi-century scale cooling events was not found..” Medieval Climate Anomaly to Little Ice Age transition as simulated by current climate models, González-Rouco et al., 2011.: “Therefore, under both high and low TSI change scenarios, it is possible that the MCA–LIA reconstructed anomalies would have been largely influenced by internal variability. ” Climate change and solar variability: What's new under the sun?, Bard and Frank, 2006.: “Overall, the role of solar activity in climate changes — such as the Quaternary glaciations or the present global warming — remains unproven and most probably represents a second-order effect.
    0 0
  14. The article notes that Vieira et al report that TSI has not increased over the past 50+ years. However Pinker (2005) finds that from 1992-2001 TSI at the earths surface increased at a rate of 0.16W/m2/y. Are Pinkers findings relevant?
    0 0
  15. Agnostic at 09:52 AM on 15 April, 2011 Do you have a link or more complete reference to that paper? It is at odds with the known TSI time series... unless he means the rising side of the Schwabe cycle. Source: NASA
    0 0
  16. "Pinker (2005) finds that from 1992-2001 TSI at the earths surface increased" Sounds like this Pinker et al 2005: Sustained decreases in [solar radiation at the earth's surface] S have been widely reported from about the year 1960 to 1990. Here we present an estimate of global temporal variations in S by using the longest available satellite record. ... We observed an overall increase in S from 1983 to 2001 at a rate of 0.16 watts per square meter (0.10%) per year; this change is a combination of a decrease until about 1990, followed by a sustained increase. Using satellites to estimate surface; yet somehow the estimate differs from the actual surface data?
    0 0
    Moderator Response: [DB] Scooped by the muoncounter, a fried keyboard (long story) and the need to re-register with Science online...full copy here (requires free registration with AAAS).
  17. Eric said:
    Sensitivity is not a constant, it varies as a function of weather. It is likely that sensitivity was higher in the 1990's and enhanced the CO2 warming. It lowered in 2000's to amplify less.
    Where on earth did you find that nonsense? Sensitivity is dependent on physics and the laws of physics do not change on decadal time frames.
    0 0
  18. From Pinker et al 2005: "The satellite-based record of surface solar fluxes from 1983 until 1992 does suggest some dimming, followed by an increase after 1992, as seen in numerous ground observations." And "The magnitudes of the observed tendencies in S at a global scale were much smaller in magnitude than those reported from ground observations." The Yooper
    0 0
  19. Yooper#68: "observed tendencies in S at a global scale were much smaller" I don't understand this: using satellites to estimate surface solar flux and the estimate (S) doesn't match the actual surface data? Sounds like a travesty to me.
    0 0
  20. Re-reading Trenberth's rede, I think he actually used the word "tapestry"... Anyway, I'm sure Spencer & Christy can figure it out, given a decade or two to parse it.
    0 0
  21. Ian, "sensitivity" is sometimes given a very narrow definition, especially here. That definition is the temperature increase due to a doubling of CO2 from 280 to 560 ppm. Some people extend that definition further to say any doubling. I have never seen that backed up with models (e.g. showing a 3C rise or even 2-5C range when going from 50 to 100 ppm of CO2 or any other doubling). Sometimes, sensitivity is given a broader definition as it was in this thread #46, in Dana1981's response to me. That definition is "the observed GAT response to known CO2 forving over a substantial interval of time (e.g. since the industrial revolution)". The problem with using that definition is that part of the rise in GAT since the industrial revolution is natural and that the amplification of CO2 warming by increases in water vapor is highly variable due to weather even on decadal timescales. In one specific case, the dominance of El Nino (a weather phenomenon) in the 1990's created a situation in which CO2 warming was more amplified by water vapor since El Nino creates more water vapor even without CO2 warming. In the looser definition of sensitivity, the response to CO2 forcing is variable and based on weather.
    0 0
  22. Eric, weather is what happens today or tomorrow, climate is what happens over long periods of time. The cycles which you "skeptics" like so much are just that cycles and can be ignored since they average out over sufficiently long periods of time.
    0 0
  23. Ian, your definition of weather is much too narrow since ENSO is partly weather (and partly climate). It is true that ENSO is somewhat cyclical and that it mainly redistributes heat already in the system. But ENSO also changes albedo and outgoing LWR over substantial portions of the earth. The constant small CO2 warming was amplified by favorable El Nino during most of the 90's. That part of the "cycle" will not necessarily be balanced by an opposite phase of the cycle. It can't just be ignored. Another "cycle" that we "skeptics" like to point to is Arctic Oscillation and North Atlantic Oscillation, both currently more negative than positive. Those tie nicely back into this thread since they are partly solar induced. For example the current low solar UV contributes to negative NAO in general and more specific changes in blocking (chart, paper: http://www.agu.org/journals/jd/jd0814/2008JD009789/2008JD009789.pdf) It is an oversimplification to say that those solar changes are "cooling". What they do is modulate weather (to a large extent) which then affects the amplification of CO2 warming or other forcings (to a smaller extent). And again, they are only nominally cyclical (the upcoming low solar maximum may be a part of a cycle from the higher solar cycles of the late 20th century, but solar cycles of century time scales are impossible to predict)
    0 0
  24. Eric, I suggest you read some of the posts at Open Mind to find out why this talk about "cycles" causing the increase in global temperatures is not valid. Global temperature increase is mostly caused by increases in CO2 resulting from the burning of fossil fuels. No matter how often you try and confuse the reality by mentioning ENSO, AMO etc, you will not convince anyone with a good scientific background that you are correct.
    0 0
    Moderator Response: And everybody please keep any discussion of cycles on the appropriate threads. This thread is about the Sun, so cycling of the Sun's output could be appropriate here, but there are other threads specific to ENSO, etc.
  25. "The solar radiative forcing is the change in total solar irradiance (TSI) in Watts per square meter (W/m2) divided by 4 to account for spherical geometry, and multiplied by 0.7 to account for planetary albedo" TSI is not a particularly good climate indicator. UV-A (between wavelength 320 and 400 nm) is better, because
    1. solar variability is much larger in the UV than in the visible or near infrared
    2. the atmosphere is pretty transparent to UV-A, because it does not fall into the O3 absorption band
    3. water is extremely transparent for UV-A, so this kind of radiation can penetrate into the ocean (down to several hundred meters) and deposits its energy there as heat
    As UV heating of seawater occurs at a lower geopotential than evaporative and radiative cooling (which happens right at the surface), UV heating, unlike thermal IR, contributes to ocean mixing. It means the effect of increased UV irradiation has a delayed effect on temperature, as heat capacity of oceans is enormous compared to any other part of the climate system. Unfortunately UV-A variability is not well constrained by measurements.
    Absorption Coefficient of Water
    0 0
  26. @Berényi Péter #75 It looks from your last graphic that UV-A radiation doesn't reach farther than blue light does. It looks like your UV heating is not much different of Blue Light heating. Reading the last figure we got some 1.3 x 10⁻⁴ cm-1 for blue light so we keep some 99.987% of light intensity once we penetrate one centimetre in the water -fresh, crystal clean water-. Some 87.8% of this blue light reaches 10 metres deep. Some 27% reaches 100 metres and only 2% reaches 300 metres. But we know we are not talking of distilled crystal clear water but some water with one ion of an heterogeneous kind for each 50 water molecules. Where is the information about how different wavelengths do in filtered sea water? Besides, does somebody remember having sailed far from the shore an having seen clearly the silhouette of other ships' hulls underwater. Sea water is pretty cloudy as it's full with life and every kind of particles. So almost nothing of blue light reaches 100 metres, nor UV-A does, what begs the question, Berényi Péter, what are you up to? Why are you telling us "this kind of radiation can penetrate into the ocean (down to several hundred meters) and deposits its energy there as heat"? Don't you realize most of the energy got converted to heat in a few dozen of meters and almost nothing goes deeper that 100 metres? Why do you talk as if a mermaid go several hundred metres down and lay an egg, and egg containing a secret? Why are you saying that a thousandth of the energy of a band that accounts for 2% of total radiation is a better measurement of what? Didn't you realize that your penultimate graphic tells that 60% of the radiation in your precious UV-A band doesn't even reach the surface?
    0 0
  27. For Dana1981 - who likes “simple calculations”. The Sun - current solar “hockey stick” - what does this mean for the present warming? We know already - with my comment above (63) and Berenyi Péter (75), that the The sun - to change its activity - it works on the climate of delay - “lag”. Thus, TSI decline after 1985 is no argument that this “is not The sun”. Well, but for example, Lockwood - indeed - cites: “... the current grand maximum has already lasted for an unusually long time ...”. Despite this adds: “However, the popular idea (at least on the Internet and in some parts of the media) that solar changes are some kind of alternative to GHG forcing in explaining the rise in surface temperatures has no credibility with almost all climate scientists.” Why? “In other words, the feedback must essentially double the GHG forcing if they are the cause of the GMAST rise. On the other hand, our best estimate of the first term on the right-hand side of equation (10.1) is 0.23 W m−2 (ΔITS=1.3 W m−2). If the analysis of Scafetta (2009) were correct and 65 per cent of the observed warming were due to solar effects, then the first term on the right-hand side of equation (10.1) plus the feedback would need to supply 0.65×5.15=3.35 W m−2. In this case, the feedback must supply 3.35−0.23=3.12 W m−2, which means that they need to explain an amplification of the solar input by a factor of 13.5.” Full agreement. However, as it was before? The like changes in temperature - as now - most probably, we observed in the Holocene (especially the middle Holocene), the above-defined variability of the Sun. At least once in the Holocene (perhaps several times), comparable to the "... solar input by a factor of 13.5. ... "certainly has been achieved! Connection - allegedly our GHG - and react to changes in the TSI for temperature changes in the Holocene, gives absurd results. professor Shaviv: “According to the IPCC (AR4), the solar irradiance is responsible for a net radiative forcing increase between the Maunder Minimum and today of 0.12 W/m 2 (0.06 to 0.60 at 90% confidence). We know however that the Maunder minimum was about 1°C colder ...”, “This requires a global sensitivity of 1.0/0.12°C/(W/m 2 ). Since doubling the CO 2 is thought to induce a 3.8 W/m 2 change in the radiative forcing, irradiance/climate correlations require a CO 2 doubling temperature of ΔT x2 ~ 31°C !!” Well, unless we accept the data - changes in TSI - from this analysis: Jeffrey A. Glassman, PhD, However, the balance of feedback for a doubling of CO2 would be only slightly positive or even negative. It is true that a simple calculation? Of course, the only alternative is a combination of solar and GHG (as one of the effects of second-order) to explain the change in temperature in the mid-Holocene or MCA / LIA. Frank et al., 2010.: “ ... a 50-year CO2 response lag—such timing is consistent with modelled CO2 response to a temperature step change. [for pre-industrial 1050–1800 period]” The temperature is delayed to the sun - an increase in TSI. Changes p.CO2 delayed against temperature. According to ice cores, however, changes in CO2 in this period were small (c. 10 ppmv). Nevertheless, the effect of Sun + CO2 (+ other "second-order effects") - similar to today! How? Something does “not fit” in these "simple calculations" ... The concentration of CO2 in the atmosphere - especially his change - had to be bigger than it used to show the cores. I would suggest to "throw away" data by ice core CO2 (and those by cores from the bottom of the ocean - as well). I propose to also adopt the proposed by me - many times here - the deep ocean CO2 + higher sensitivity of soil (respiration) on temperature ... I recall the most recent reference is apropos of the latter: Suseela et al., 2010.: “Soil respiration is the largest flux of carbon dioxide to the atmosphere, releasing more [several times - 98 +/- 12 PgC / 8-9 Pg C ] carbon than fossil fuel combustion.” “... even a small warming-induced increase in carbon dioxide emission from soils could act as a positive feedback to climate change.” Karhu et al. 2010.: “Compared to the method used for current global estimates (temperature sensitivity of all SOC equal to that of the total heterotrophic soil respiration), the soils studied will lose 30-45% more carbon in response to climate warming ...” Dorrepaal et al., 2009.: “Climate warming therefore accelerates respiration of the extensive, subsurface carbon reservoirs in peatlands to a much larger extent than was previously thought ...” The steady increase in "strength "of the sun for a long time = constant small increase in temperature = increase in soil respiration + deep ocean - for example by upwelling = 80-90% current rise in CO2 + other effects of second order = continued increase in the temperature ... The stronger the sun is the increase in volcanic activity - a decrease of ozone in the stratosphere - the reduction in marine algae (possibly caused also by warming) - the increase in frequency of El Nino - another feedback causing a natural increase in CO2 ...
    0 0
  28. The issue, as I see it, isn't whether the solar activity variation is high or low over the MWP/LIA period but rather whether that observation fits well with how we understand the 'control knobs' of the climate. There's an interesting series of papers in PAGES Newsletter March 2011. I don't know what PAGES is, suspect this work isn't peer-reviewed but it does appear to be showing work from some important scientists who work on this problem. I was struck by the conclusions in the modelling paper (starting page 7). I'll just reproduce the conclusion in full and leave it to yourself to decide just how much confidence we should have in our present understanding of the science. I think it's worth reading the rest of these papers. "Conclusions The results presented here highlight major discrepancies between millennium simulations and reconstructions. If proxybased reconstructions were considered reliable and changes in radiative forcing factors were responsible for the MCA–LIA reconstructed temperature signal, these results would have implications on our understanding of the MCA–LIA transition. These discrepancies suggest that either the MCA–LIA changes arose from internal variability only, or transient simulations with state-of-the-art AOGCMs fail to correctly reproduce some mechanisms of response to external forcing: for instance, changes in the tropics like the enhancement of the zonal gradient in the tropical Pacific is not well simulated, with implications for related teleconnections elsewhere. Most models have used relatively high TSI variations from the MCA to the LIA and their pattern of response is typically a uniform warming in the earlier period. In spite of this, there are considerable differences among the simulations that highlight a feasible influence of initial conditions and internal variability. Furthermore, if reduced levels of past TSI are given more credit, as in the MPI-ESM-E1 ensemble, the temperature response for the MCA–LIA is less uniform in sign and visibly more influenced by internal variability. Therefore, under both high and low TSI change scenarios, it is possible that the MCA–LIA reconstructed anomalies would have been largely influenced by internal variability."
    0 0
  29. The last image in comment #75 is now at http://www.lsbu.ac.uk/water/vibrat.html under "The visible and UV spectra of liquid water".
    0 0

Prev  1  2  

You need to be logged in to post a comment. Login via the left margin or if you're new, register here.


The Consensus Project Website

THE ESCALATOR

(free to republish)


© Copyright 2024 John Cook
Home | Translations | About Us | Privacy | Contact Us