Climate Science Glossary

Term Lookup

Enter a term in the search box to find its definition.

Settings

Use the controls in the far right panel to increase or decrease the number of terms automatically displayed (or to completely turn that feature off).

Term Lookup

Settings


All IPCC definitions taken from Climate Change 2007: The Physical Science Basis. Working Group I Contribution to the Fourth Assessment Report of the Intergovernmental Panel on Climate Change, Annex I, Glossary, pp. 941-954. Cambridge University Press.

Home Arguments Software Resources Comments The Consensus Project Translations About Support

Bluesky Facebook LinkedIn Mastodon MeWe

Twitter YouTube RSS Posts RSS Comments Email Subscribe


Climate's changed before
It's the sun
It's not bad
There is no consensus
It's cooling
Models are unreliable
Temp record is unreliable
Animals and plants can adapt
It hasn't warmed since 1998
Antarctica is gaining ice
View All Arguments...


Username
Password
New? Register here
Forgot your password?

Latest Posts

Archives

The albedo effect

Posted on 5 November 2009 by John Cook

Change to the Earth's albedo is a powerful driver of climate. When the planet's albedo or reflectivity increases, more incoming sunlight is reflected back into space. This has a cooling effect on global temperatures. Conversely, a drop in albedo warms the planet. A change of just 1% to the Earth's albedo has a radiative effect of 3.4 Wm-2, comparable to the forcing from a doubling of CO2. So is it unreasonable to wonder if albedo might have something to do with this global warming caper?

Albedo trends before 2000

There are various factors that affect the Earth's albedo. Snow and ice are highly reflective so when they melt, albedo drops. Forests have a lower albedo than open land so deforestation increases albedo (but for the record, no, chopping down all our forests is not the solution to global warming). Aerosols have a direct and indirect effect on albedo. The direct effect is by reflecting sunlight back into space, cooling the Earth. The indirect effect is when aerosol particles act as a cloud condensation nucleus, affecting the formation and lifetime of clouds. Clouds in turn influence global temperatures in various ways. They cool the climate by reflecting incoming sunlight but can also warm the climate by trapping outgoing infrared radiation from the surface.

All these factors are considered when adding up the various radiative forcings that drive climate. Changes in land use are calculated from historical reconstructions of cropland and pastureland changes. Combinations of satellite and surface-based observations allow us to determine trends in aerosol levels as well as cloud albedo effect.
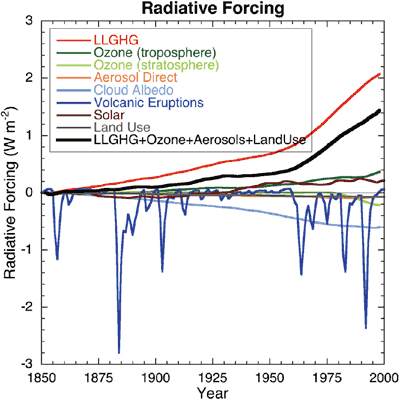

Figure 1: Globally and annually averaged radiative forcing (Chapter 2 of the IPCC AR4).

What we observe is that of the various albedo forcings, cloud albedo is the most dominant effect. The long term trend is that of cooling with a radiative forcing from 1850 to 2000 of -0.7 Wm-2.

Albedo trends since 2000

One method to determine the Earth's albedo is to measure earthshine. This is sunlight reflected from the Earth and then reflected from the Moon back to the nighttime Earth. Earthshine has been measured at the Big Bear Solar Observatory since November 1998 (with some measurements in 1994 and 1995). Figure 2 shows changes in albedo calculated in Palle 2004 from reconstructed satellite data (black line) and Earthshine measurements (blue line).
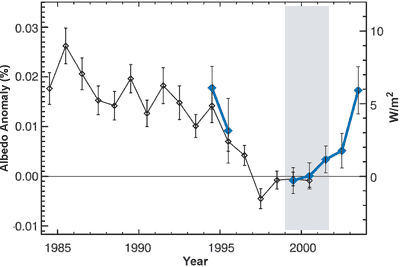

Figure 2: Albedo anomalies reconstructed from ISCCP satellite data (black) and Earthshine-observed albedo anomalies (blue). The right hand vertical scale shows negative radiative forcing (eg - cooling) (Palle 2004).

The data in Figure 2 is problematic. The black line, reconstructed from ISCCP satellite data, "is a purely statistical parameter that has little physical meaning as it does not account for the non-linear relations between cloud and surface properties and planetary albedo and does not include aerosol related albedo changes such as associated with Mt. Pinatubo, or human emissions of sulfates for instance" (Real Climate).

Even more problematic is the spike in albedo around 2003, shown by the blue earthshine line. This is in sharp contrast to satellite measurements which showed little to no trend over the same period. To put this in perspective, consider the Pinutabo volcanic eruption in 1991 which spewed aerosols into the atmosphere. These aerosols reflected incoming sunlight, causing a negative radiative forcing of 2.5 Wm-2. This led to a dramatic drop in global temperatures. The earthshine data indicated a radiative forcing of nearly -6 Wm-2 which should've caused a precipitous drop in global temperatures. No such drop occured (Wielicki 2007).

In 2008, the reason for the discrepancy was discovered. The Big Bear Solar Observatory installed a new telescope in 2004 to measure earthshine. With the new and improved data, they recalibrated their old data and updated their earthshine albedo results (Palle 2008). Figure 3 shows the old albedo data (black) and the updated albedo (blue). The anomalous 2003 spike disappears. Nevertheless, a trend of increasing albedo remains from 1999 to 2003.
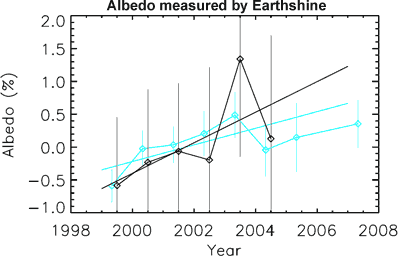

Figure 3: Earth albedo anomalies as measured by earthshine. In black are the albedo anomalies published in 2004 (Palle 2004). In blue are the updated albedo anomalies after improved data analysis, which also include more years of data (Palle 2008).

How accurate is the earthshine method in determining global albedo? For starters, the method doesn't give a global albedo estimate. It covers about one third of the Earth at each observation occasion and certain areas can never be ‘‘seen’’ from the measurement site. Furthermore the measurements are sparsely sampled in time, and only made in a narrow wavelength band of 0.4 to 0.7 µm (Bender 2006).

In contrast, satellite data such as CERES is a truly global measure of the Earth’s reflected shortwave radiation, including the effects of all atmospheric and surface properties. It covers a broader spectrum than earthshine (0.3–5.0 µm). Loeb 2007a compares 4 independent sets of satellite data: CERES, MODIS, MISR and SeaWiFS. Albedo as measured by CERES shows no long term trend from March 2000 to June 2005. They also find "remarkable consistency" between the 4 satellite results.
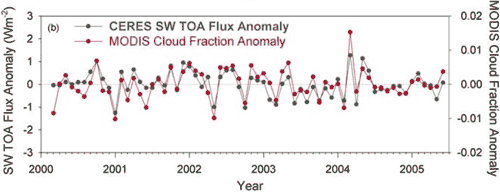

Figure 4: Monthly anomalies in global mean CERES SW TOA flux and MODIS cloud fraction (Loeb 2007b).

So albedo has had an effect on global temperatures - mostly a cooling effect on long term trends. As for recent albedo trends, earthshine data shows increasing albedo from 1999 to 2003 but little to no trend from 2003. Satellites show little to no trend since 2000. The radiative forcing from albedo changes in recent years appears to be minimal.

For more info, see Papers on the albedo of the Earth by AGW Observer.

0 0

Printable Version  |  Link to this page

Comments

1  2  Next

Comments 1 to 50 out of 74:

  1. Hi John, I get the overall message, but I was tripped up at Fig 2. First, the anomaly axis can't be in %, can it, if a change in 1% = 3.4 W/m2 (the figure shows a change of .01% = 3.4 W/m2)? More semantically, shouldn't the W/m2 axis be reversed, such that higher albedo represents a negative forcing? Finally, in your description of the figure, you mention Pinatubo's large effect in 1991, but I can't see it in either data set shown in your Figure 2. Am I misinterpreting the figure?
    0 0
    Response: Which way the Y-axis should go is really a po-tay-to/po-tah-to issue. But yes, it might have been less confusing if they put negative numbers on the W/m2 axis. I will update the caption of Figure 2 and 3 to clarify this.

    In Figure 2, the albedo calculated from ISCCP satellite data is not without its own problems. A Real Climate analysis sums it up thus: "The earthshine-trained ISCCP reconstruction of the albedo is a purely statistical parameter that has little physical meaning as it does not account for the non-linear relations between cloud and surface properties and planetary albedo and does not include aerosol related albedo changes such as associated with Mt. Pinatubo, or human emissions of sulfates for instance."

    I mainly displayed Figure 2 because this is the graph that seems to pop up everywhere - it seemed important to show that it is now defunct. Unfortunately, it may have sown more confusion than clarified.
  2. Hi John The first paragraph below "albedo trends since 2000" refers to figure 1 but should refer to figure 2. The % shown in Figure 2 and 3 do not appear to match. Anyway, like Steve L. I'm a little confused. Thanks Tony
    0 0
    Response: Apologies for the Figure 1/2 confusion - I was shuffling things around while drafting this post and failed to update that reference. Now fixed.

    The % shown in Figure 2 and 3 are the same. In Figure 2, Palle uses fractions. In Figure 3, he uses percentages. Eg - 0.01 = 1%.
  3. re #1: Steve, the confusion lies largely in the papers of Palle et al from which the figures above are taken. For example, Palle et al (2004) are simply not clear about the anomaly values in their Figure 3 (Figure 2 above). I can't see from their paper what the reference albedo is from which the values (0.02 etc.) are anomalies with respect to. Yes the W/m2 axis should really be reversed as you suggest (Palle et al (2004)'s mistake!). On Pinatubo: There doesn't seem to be much of an effect on albedo. Palle et al (2004) suggest this isn't surprising:
    The albedos for the years after the eruption of Mt. Pinatubo (1991–1992) are among the largest; however, the increase is just comparable with interannual variability. The lack of a sharp rise is not unexpected, however, because Pinatubo's increased contribution of stratospheric aerosols is not accounted for by any of the ISCCP parameters used.
    Presumably the ISCCP data is optimised for characterising clouds from which albedo effect are determined. I wonder whether an essential difference between the properties of volcanic aerosols (scatter incident light) and clouds (reflect incident light) might be responsible for the apparent absence of Pinatubo on apparent albedo???
    0 0
  4. Article begins with... "A change of just 1% to the Earth's albedo has a radiative effect of 3.4 Wm-2, comparable to the forcing from a doubling of CO2." Is it conceivably possible to discuss a subject without including some reference to CO2? Hasnt enough controversy around this subject indicated that it isnt the most convenient standard for comparison? 1) First because as we have seen in previous comments, for some, the greenhouse effect might be a complete myth. 2) Even if it is real, your own articles indicate quite a bit of variability for how much forcing could be associated with a doubling of CO2. 3) Even though you are dealing here with "albedo" as an independent variable, it is dependent on atmospheric radiative absorption. You even explain this here, and yet it is then used as one more independent forcing factor. Conceptually, it would seem that "albedo" per se is not a forcing in its own right, but only a measurement. For instance, the reflective properities of objects on the earth's surface determine radiative forcing. The color of paint for instance is the object of forcing, not the measurement obtained.
    0 0
    Response: The term 'doubling of CO2' is a convention - we could just as easily say 3.7 Wm-2 but it just doesn't roll off the tongue as smoothly. To answer the possibility of greenhouse effect being a myth, the enhanced greenhouse effect has been confirmed by multiple independent lines of empirical observations. If you're genuinely interested in the science of global warming, I strongly recommend you read the following papers:
    • Philipona 2004 (surface measurements confirming increased downward longwave radiation)
    • Evans 2006 - analyses high resolution spectral data, quantitatively attributed the increase in downward radiation at specific wavelengths to each of several anthropogenic gases.
    • Harries 2001Griggs 2004Chen 2007 all compare satellite measurements of outgoing infrared radiation to find less radiation escaping at CO2 absorption wavelengths.
    If you don't have access to any of those papers, I'll be happy to email any to you.
  5. "This is sunlight reflected from the Earth and then reflected from the Moon back to the nighttime Earth." When the Moon is "new" in our sky, the Earth is shining its brightest on the Moon. When the Moon is "full", in the Moons "sky", the Earth is very dark except for maybe a detectable glow of urban sprawl. Light coming from the Moon is reflecting from the Sun. What is meant here by the "nighttime" Earth?
    0 0
  6. re #4 RSVP: (i) Note that there isn't much uncertainty over the radiative forcing resulting from doubling of atmospheric CO2. The uncertainty lies in the climate response to this forcing, and this uncertainty applies to any source of forcing. So it is entirely appropriate to compare the forcing of any given phenomenon (e.g. albedo), to the pertinent and rather well characterised forcing arising from doubling atmospheric CO2. And remember that the generation of "controversy" is not necesssarily a representation of scientific understanding based on evidence, and we should really seek light on these subjects rather than heat.... ....and so, the fact that some people believe the greenhouse effect is a "myth", is no reason to wallow in ignorance ourselves! (iii) Yes a change in albedo can be considered a forcing, since it represents a change in solar radiation that "participates" in the energy balance that defines a particular climate (temperature) state. Of course it may also be a feedback (sea and land ice response to forcings), but it is convenient to consider it's contribution as a forcing (in the manner that Palle et al do), when considering the temporal variation in energy balance (i.e a "lumped" forcing). However!...note that we have to very careful with albedo, since the source of the albedo change complicates a direct assignment of a forcing (as Palle et al. 2008 discuss [*]). So an albedo change resulting from a change in cloud coverage, doesn't necesarily equate to a negative forcing, since clouds also reduce the radiative dissipation of thermal energy to space. [*] E. Pallé et al (2006) Can Earth's Albedo and Surface Temperatures Increase Together? Eos Trans. AGU, 87(4), doi:10.1029/2006EO040002
    0 0
  7. re #5: RSVP, "nighttime Earth" means nighttime on Earth!. Click on the convenient link to Palle 2004 that John very thoughtfully added to the legend to Figure 2 in his summary. You'll find that Earthshine, the "ghostly glow of the dark portion of the lunar disk", is measured from the Big Bear Solar Observatory in Big Bear City in California during four hours of darkness at night. The paper contains a simple description of the measurement of Earthshine by comparing the brightness of the earth-lit Moon to that of the sun-lit Moon...
    0 0
  8. So albedo has had an effect on global temperatures - mostly a cooling effect on long term trends
    But, after showing Pallé 2004 (Fig. 2), I don't see any new long term trend; only recent trends (since 2000). The update in Palle 2008 (fig. 2a, p. 32) still shows an overall decreasing long-term trend in albedo (and therefore a warming effect), isn't it? In fact, Pallé 2005 compared earthshine with other data sets and says that 1985-2000 trend would range "from 2–3 W/m2 [Wielicki et al., 2002; Pinker et al., 2005] to 6–7 W/m2 [Palle´ et al., 2004; Wild et al., 2005]" (paragraph [20]). *I've also seen that Pallé replied to the comment by Bender suggesting that the earthshine could be considered global (paragraph [3]).
    0 0
  9. "In the common period, earthshine, CERES along with ISCCP-FD data show a trendless albedo. However, preceding CERES, earthshine and ISCCP-FD reflectances show a significant increase before flattening and holding the increase. This implies a reduction in the net sunlight reaching Earth. In the context of the recent climate change, it is important to point out that the physical causes behind these large decadal variations in albedo are still unknown, and that we just don't know yet whether we should expect the albedo changes observed during the modern period to persist into the future." (Palle 2008) Project Earthshine includes the observatory at Mt Teide (Gran Canarias)not just BBSO and they reckon to have almost global coverage. In addition they have another observatory in partial use in Crimea. A further proposal to set up an earthshine project in Antartica ( which would give 6 days of un-interrupted data)was put forward in 2004 but seems to have died a death. If you access the original graph the time series goes back to 1985 and shows a distinct drop in albedo in 1998 - a very hot year. Yes, the current data shows little change in albedo (from 2000..so what?) but that long term trend of -0.7W is still there and just happens to balance the +0.7W heat being added to the oceans.....
    0 0
  10. Which "original graph" are you talking about Mizimi? Why not link to, or cite, the data you refer to??? If you look at Palle (2008) [published as Palle et al. (2009) J. Geophys. Res. 114, D003D03], the albedo doesn't "show a distinct drop in albedo in 1998". In fact the albedo in 1999 is lower than 1998 (see Figure 2, top). Please clarify. Note that Palle et al. 2006 [*] point out that one can't translate a change in albedo to a forcing in the manner that you suggest (your "0.7 W" comment) without considering the source of the albedo change. If it's due to a cloud response, an increase in albedo doesn't necessarily mean a negative forcing since any increased cloud response also has an element of suppressed radiative dissipation of thermal energy (see post #6 above). In any case if heat is being added to the oceans, then heat is being added to the oceans! Your putative "happens to balance" obviously isn't balancing at all. [*] E. Pallé et al (2006) Can Earth's Albedo and Surface Temperatures Increase Together? Eos Trans. AGU, 87(4), doi:10.1029/2006EO040002
    0 0
  11. Did anyone read the conclusion of Palle et al 2008? "In the common period, earthshine, CERES along with ISCCP-FD data show a trendless albedo. However, preceding CERES, earthshine and ISCCP-FD reflectances show a significant increase before flattening and holding the increase. This implies a reduction in the net sunlight reaching earth...it is important to point out that the physical causes behind these decadal variations in albedo are still unknown, and that we just don't know yet whether we should expect the albedo changes observed during the modern period to persist into the future.." end quote. I am pretty sure that the increase will hold because it is most probably due to a) an increase in CO2 b) an increase in ozone (due to elimination of CFC's) and c)greater shallow water reservoir surface areas due to human activities. These three components in gasform cause most of earth's reflection. You can look this up in your own quoted papers that show the common solar radiation spectrum. (I remember it refused to speak about or admit that CO2 also causes cooling and it seemed deliberately confusing). Obviously as the weather was getting warmer more clouds are formed, which also helps to reflect more sunlight to space. The reflected sunlight is what makes earth cooler. Anyways, does anyone have any figures about ozone and the ozonehole? I have not heard much about it lately, so this may mean that it must be closing and that means less sunlight (the "bulky" part of the spectrum ) is getting through. This is what the report is saying. I have not yet seen a study that assesses the cooling properties of CO2 (when it is hit by sunlight) and compare them with warming properties of CO2 (when it is hit by earth's radiation). My gut feeling tells me that the nett effect will be close to zero. I am not sure what you people are going to do or say in Copenhagen. I am more and more convinced CO2 is not the problem.
    0 0
  12. Henry Pool, following Palle 2008, the albedo increased while the earth was warming, instead. This should make clear that there's not a simple and direct relation between the observed albedo changes and the earth surface temperature trends. As for the future trend, I'm glad that you are "pretty sure" about one thing that scientists working in the field admit they don't know. Definitely you should tell them.
    0 0
  13. I thought global warming has been stalling for quite a number of years now, I think the fact the earth has been brightening would be a reasonable explanation for this? It makes sense that it will take a few seasons after the brightening of earth that some noticable cooling will take effect.. Did anyone find a graph plotting ozone concentrations per annum? Surely that must be possible to find that data? I am not the man who claims to be the expert - I am just checking whether the science is there. I think it is not. I still donot where that 1.7 for CO2 came from. I said it is probably based on the assumption that CO2 is the problem . You then promised to show me the calculations how that was arrived at. As far as CO2 is concerned, no one from your site (side) came to me with comprehensible experiments that took the cooling of CO2 into account and that resulted in convincing figures..
    0 0
    Response: Global warming hasn't stalled - satellite measurements find the planet is still in positive energy imbalance and ocean heat measurements find the planet is still accumulating heat.
  14. Henry Pool, not sure this is what you were looking for, but here you find the annual minimum concentration time serie while here are the monthly values. I'm going to ignore your last complain given the effort we put to point at the relevant physics you probably didn't look at.
    0 0
  15. Question: From the discussions so far, I get the impression that albedo refers to the visible portion of the electromagnetic spectrum, but I didnt see this explained anywhere. Is there a defined band or cutoff frequency?
    0 0
    Response: Albedo refers to reflected sunlight, which includes UV light, visible light and wavelengths above the visible spectrum. This covers radiation from around 0.3 microns to 1.2 microns. Visible light is part of this spectrum: roughly 0.4 microns to 0.7 microns.
  16. RSVP, there's no definition of a wavelength range. In general the albedo varies with wavelegth but is usually measured over wide range. As stated in this post, the earthshine measurements cover 0.4-0.7 microns while CERES data cover 0.3-5.0 microns. They both cover the visible spectrum, where the sun radiation mainly is.
    0 0
  17. Chris: the original 2004 graph is here: http://science.larc.nasa.gov/ceres/STM/2005-05/loeb_earthshine.pdf which contests the accuracy of earthshine data. Palle's graph shows a distinct drop in albedo in 1997 which was followed by a hot 1998.
    0 0
  18. 17#..sorry should have mentioned it is on page 13.
    0 0
  19. re #17, so Palle's graph in 2004 shows a drop in albedo in 1997. Palle's graph in 2009, doesn't show a drop in albedo in 1997 [see Figure 2 (top) of Palle et al (2009) [*]; the pre-publication manuscript can be read by clicking on John Cook's "Palle 2008" link in the top summary)]. Palle's graph in 2004 shows a large rise in albedo in 2003. Palle's graph in 2009 doesn't show a large rise in albedo in 2003. My conclusion would be that Palle's determination of albedo measures isn't particularly robust (or at least wasn't in 2004), and the suggestion that there was a drop in albedo in 1997 coupled with an insinuation that this might have something to do with the very warm 1998, is flawed. After all if Palle has reinterpreted earler work that suggested a "distinct drop in albedo in 1997", to conclude in later work that there wasn't a "distinct drop in albedo in 1997", I don't see the point of pretending that the data still suggests a drop in albedo in 1997. Or do you have a good reason to reject Palle's own reinterpretation of his earlier work? [*] Palle et al. (2009) Inter-annual variations in Earth's reflectance, 1999-2007 J. Geophys. Res. 114, D00D03
    0 0
  20. if I look carefully at our World Climate Widget, (watts up with that) it looks to me that since about 2001 we have a slight decline in global warming, or shall we say: global cooling has started. This seems to coincide with the increase in earth’s albedo, http://wattsupwiththat.com/2007/10/17/earths-albedo-tells-a-interesting-story/ although I think this graph may need some updating (look Palle et al 2008) As I suspected, I found that at the same time ozone has begun increasing. http://atmoz.org/blog/2007/09/05/ozone-hole-update/ I also note that CO2 is increasing (it seems there is no doubt about that). CO2 also reflects sunlight. We also note that water vapor is increasing, due to human activities, mostly shallow water (dams for consumption and irrigation). So all in all, I think the increase in earth’s albedo will hold, and it wipes out the effect normally attributed greenhouse gases
    0 0
    Response: This theory is invalidated by the fact that our climate is still accumulating heat. It's still in positive energy imbalance. From 2003 to 2008, the world's oceans have been absorbing heat at a rate of 0.77Wm-2.
  21. re #20 That simply doesn't accord with the evidence Henry. Analysis of earth surface temperature data indicates that apart from the hugely transiently amplified 1998 temperature (largest El Nino of the last century), surface temperatures maxed around 2005. All of the years of the current decade are warmer (by around 0.2 oC on average) than all of the years of the 1990's apart from the anomalous 1998: NASA GISS: http://data.giss.nasa.gov/gistemp/tabledata/GLB.Ts+dSST.txt UK HADCRUT: http://www.cru.uea.ac.uk/cru/data/temperature/hadcrut3vgl.txt One could say that temperatures haven't risen since around 2005, but you simply can't make that sort of interpretation from a few years worth of data that incorporates large interannual variability. What do we expect the earth's surface temperature to have done during the last several years? We know categorically that the sun has dropped from the top to the bottom of its solar cycle from around 2002 to now (it's just starting on its upturn). There's pretty good evidence that the solar cycle contribution is around 0.1 oC of cooling, max to min (and obviously 0.1 oC of warming min to max). So we expect all of the greenhouse warming contribution since around 2003 (~ 0.15-0.2 oC per decade) to be negated by the small solar cycle cooling between around 2003 and now. It's therefore not surprising that surface temperatures haven't yet gone above the 2005 levels in the last few years. That's pretty much what we expect. This leads to a serious problem with those attempts to assign a cooling trend (for which there isn't any evidence in the surface temperature records) to albedo, or ocean regimes, or amplified solar effects or whatever, namely that these effects should have caused the earths surface to cool significantly during the last decade if they existed. Either that or the earth's surface temperature is much more sensitive to greenhouse warming that the science indicates. I suspect we'll find (as Palle et al. 2009 state quite explicitly), that there hasn't been a significant increase in albedo since 2000, and in any case (as Palle et al, 2006 state quite explicitly), an albedo change due to secular cloud variation doesn't necessarily inply a surface temperature response since clouds have warming ("heat trapping") as well as cooling (albedo) effects. E. Pallé et al (2006) Can Earth's Albedo and Surface Temperatures Increase Together? Eos Trans. AGU, 87(4), doi:10.1029/2006EO040002 Palle et al. (2009) Inter-annual variations in Earth's reflectance, 1999-2007 J. Geophys. Res. 114, D00D03
    0 0
  22. At the risk of encouraging nonsense, Henry Pool (#20) -- where do you find CO2 reflecting a lot of sunlight? My understanding is that it is mostly invisible to visible light but opaque to infra-red.
    0 0
  23. Steve, maybe you must attempt to answer the question I asked in 127 of "How do we know CO2 is causing warming?" You can also check any good solar radiation spectrum graph. It will tell you that ozone, water vapor and CO2 cause reflection of sunlight. It seems pretty obvious to me that that nobody did the right testing that would prove that CO2 causes warming, i.e. how much warming (by trapping earth's radiation) and how much cooling (by reflecting sunlight) is caused by CO2, i.e. what is the net effect? http://www.telegraph.co.uk/earth/earthnews/6553592/Climate-change-scep. Look at my comment at 3:43 pm on 13/11/09. I am (still) not convinced that CO2 causes global warming. But if you have the proof from actual measurements made during actual tests I am (still) willing to be convinced. (I am a believer turned skeptic - I am not saying global warming is not happening, I am saying that I do not know if CO2 is the cause). In any case, it looks to me now that ozone is increasing and if this trend continues this will/could wipe out a lot of the sun's energy coming to earth.
    0 0
  24. Steve L, you might have given up on that long prior discussion with Henry Pool before I threw in my two cents about his CO2 reflection assertion. I don't know how else to explain it to him.
    0 0
  25. Hi Henry, So, quantitatively, you're saying that the prevention of solar energy from reaching the Earth's surface is as great as (or greater than) the amount that is kept in by greenhouse gases. I would like to see a scientific citation of that. Later on, I'll dig into what you've said about this elsewhere, but for now it seems to me that you're ignoring a few things. First, visible light makes up a lot of incoming solar radiation and hits the Earth, but a lot of it is converted to longwave radiation (so outgoing longwave radiation can be more important than incoming for temperature implications). Atmosphere_Transmission_Blackbody_Only.png Second, with increasing greenhouse gases we're seeing less of the pertinent wavelengths leaving the Earth and hitting satellites (so GHGs don't reflect the incoming infra-red effectively). Third, more of those same pertinent wavelengths are hitting sensors on the ground (your idea would suggest that less reaches the Earth). Support for the last two items can be found on Skeptical Science, here: http://www.skepticalscience.com/empirical-evidence-for-global-warming.htm Look for the heading "The Planet is Accumulating Heat" and then read the prior 4 paragraphs, and the citations therein. When I have a moment later I'll try to look further to make sure I'm not misunderstanding you.
    0 0
  26. This post is about albedo, not CO2. I am not sure if we can carry on with this here. Dear Steve, the problem is that nobody did the right kind of tests. We know where CO2 absorbs and those studying Albedo have identified CO2 as one of the ingredients as to why Albedo has increased. We even know that CO2 absorbs in the uv range (thus also reflect UV light). With these particular wavelengths they can see if there is CO2 on other planets. It does not matter in what wavelengths the light is reflected because if it does not land on earth than surely it cannot bounce back in the IR range, i.e. it cannot cause warming. To say that we need less CO2 is perhaps just as non-sensical as to say that we need less ozone.Ozone also traps earth radiation. Luckily for us, ozone is now increasing. I am sure the balance is that ozone reflects more radiation than what it traps from earth. The argument with CO2 is likewise, unless you have done the relevant testing that would show me that the warming effect is greater than the cooling effect.
    0 0
  27. Henry: "those studying albedo have identified CO2 as one of the ingredients as to why Albedo has increased". Citations please. "I am sure the balance is that ozone reflects more radiation than what it traps from earth." Why are you sure? Citations please. Other facts (regarding wavelengths detected at the surface and in space) contradict your assertions about albedo. We won't get very far if you ignore them. The link you provided to the Telegraph (of all places) did not work.
    0 0
  28. Steve, to answer your questions: 1) The Astrophysical Journal, 629:1175–1182, 2005 August 20: quote from abstract: Water vapor and molecular oxygen signals in the visible earthshine, and carbon dioxide and methane in the near-infrared, are more likely to be powerful probes. 2) You can study carefully the sun's solar radiation spectrum and the earth's upgoing radiation spectrum and the atmospheric absorption bands. Put them on top of each other. It will show you that ozone reflects a lot of the sun's radiation where the area below the sun's curve is the biggest. Nevertheless, ozone also traps some radiation of earth at exactly 10 um. My gut feeling from these graphs is that the net effect of ozone is cooling. So the more ozone, the cooler it will get. The same argument goes for CO2 although here my feeling is that it is pretty much evens. There is reflection at 1.4, 1.8; 2.3 um and even at 4 (because the sun is still emitting there). Recent discoveries also show that CO2 absorbs in the UV. Some entrapment of earth radiation of CO2 can be seen at 14 um but water also absorbs here. I think you cannot really say for sure what the net effect is of the cooling and warming properties unless unless you have done some actual testing 3) http://www.telegraph.co.uk/earth/earthnews/6553592/Climate-change-sceptic-Ian-Plimer-argues-CO2-is-not-causing-global-warming.html
    0 0
  29. Henry Pool, i'm not going to open again the discussion on the presumed "reflectivity" effect of CO2, but the first reference you quote has nothing to do with it. Indeed, the very same sentence you copied here refer to the absorption properties of CO2 in the IR, hardly a breaking news.
    0 0
  30. Henry, your #1 is about measurements from a single night and in no way supports your assertion that "those studying albedo have identified CO2 as one of the ingredients as to why Albedo has increased". Your #2 is about your "gut-feeling", some confusion between reflection and absorption I think, and ignoring visible light being turned into infra-red after it hits the Earth. I don't have to do the actual testing -- it has been done and is integrated into the IPCC's forcing chart (see here, for example: http://skepticalscience.com/CO2-is-not-the-only-driver-of-climate.html ). If you disagree with the IPCC's summary of the science, I think it's up to you to show why. You'll need to do more than assess what your gut thinks. #3. Plimer is wrong. Your comment Nov 13 there is just repitition of what you've said, except you cite WUWT. #4. Measurements contradict your assertions. Sorry Henry, but I don't think our discussion is going anywhere.
    0 0
  31. 1) you just don't want to understand. the atmospheric absorption bands (that shows the difference between the radiation measured on top of the atmosphere and the radiation that is measured at sea level) clearly shows you that oxygen/ozone and water vapor and carbon dioxide cause reflection of light (back to outer space!). 2) it is not I that is confused about what happens when a few photons are absorbed by the molecule. I notice you did not answer the question I raised on 127! Light has to keep moving. "absorption" is the word that confuses people because they donot understand that once the max. amount of photons are absorbed, the molecule becomes like a mirror at that wavelength band where it absorbs and has to reflect the light back in the band where is absorbs. The position of the molecule is random so you can expect at least 50% of the light in that wavelength band to be sent back to space. I am asking: what is the net effect of the cooling and warming properties of CO2 especially in the CO2 range of 0.01 -0.05%. Where are the test results? the 1.7 assigned by IPCC to CO2 is from the idea: let us have a planet, let us add some CO2, see if the temp. goes up, it did, so that must be it. And some viking who lived 100 years ago and whose calculations have been proven wrong. If he was right, earth should have been a lot warmer. There is no proof that CO2 causes warming. 3) Plimer might be right. Most volcanic activity takes place underneath the seabeds. CO2 comes from volcanic activities (which also produces heat to the water). the point is: you cannot go on the assumption that CO2 is the problem, because what else can it be? You have to provide me with scientific evidence. 4) one day you will find out you are wrong...
    0 0
  32. Hi I'm looking for an explanation. I don't really get radiative forcing. Take this abstract on the nett radiative forcing effect of an Alaskan forest fire. The negative affect was 8 W/m2 while the positive affact was 21 W/m2. This seems a lot when "change of just 1% to the Earth's albedo has a radiative effect of 3.4 Wm-2" Is the abstract describing the nett radiative forcing for the area of the forest fire (7200hectares) while the 1% albedo figure is for the whole surface of the earth?
    0 0
    Response: I haven't read the paper but I'm guessing the forest fire radiative forcing would be just for that region, not the whole globe. It would also be temporary. A global radiative forcing of 13 Wm-2 would be huge and have an immediate, sharp effect on global temperatures.

    The radiative forcing from a large volcanic eruption is quite large, particularly if it's located in the tropics so the aerosols from the eruption can spread through both hemispheres. For example, as discussed above, the global radiative forcing from Mt Pinutabo was  2.5 Wm-2. This is approximately equivalent to the radiative forcing of all human CO2 emissions since pre-industrial times. Global temperatures immediately responded to the negative forcing with global cooling happening. However, the effect was temporary - the aerosols washed out of the atmosphere and global temperatures bounced back after a few years.
  33. In the abstract it is explictly stated that they are comparing two nearby regions, one intact and the other after the fire. Other people made the observation that boreal forests reduces albedo and that cutting them down have a cooling effect. True, in the short term; and indeed the calculations in the extended abstract are done for one year only. But what is not considered in this kind of analysis is the time it takes to absorb again the emitted CO2. Indeed, in relatively few years, the regrowth of vegetation will bring the albedo back to the original value while the emitted CO2 will be in the air for many more years. If the forest was on average 100 years old it will take the same 100 years to bring the CO2 balance to equilibrium. In the meanwhile the excess CO2 will continue to have a warming effect and the older the forest the worst the impact.
    0 0
  34. Henry, Integrate the incoming and outgoing radiation distributions for Earth over the actual absorption spectra and atmospheric concentrations, taking into account re-radiation etc. See what version of the radiation "discussion" is supported. Then compare with actual measurements, to see where consistencies and inconsistencies are to be found. It might also be illuminating for you to take a look at what the IPCC actually has to say, in scientific terms, when you are able to write such things as "the 1.7 assigned by IPCC to CO2 is from the idea: let us have a planet, let us add some CO2, see if the temp. goes up, it did, so that must be it." And the IPCC is of course open to new factors explaining the observed phenomena, if they can be rigourously established. But because we are always (Occam's razor) looking for the simplest models able to explain the phenomena, scientists may seem more arrogant towards new factors then they really are - it's just that is is the business of the proponents of new theories to furnish the evidence, not the opponents. This also makes science in a sense very conservative: When repeated attempts at falsifying a new theory fail, and it is both theoretically and observationally consistent with the existing body of knowledge, it will usually be incorporated in that body. Thereafter, it will be the business of opponents to point out errors, inconsistencies or wrong predictions. When you write "..the point is: you cannot go on the assumption that CO2 is the problem, because what else can it be? You have to provide me with scientific evidence," you seem to have overlooked these facts about how the scientific process works. The evidence is there, and the references cited on this blog is, I think, a great place to start. It's great if you can come up with even better explanations, but don't expect the proponents of an established theory to be very interested in working out your ideas, as long as they seem to work fruitfully within their paradigm.
    0 0
  35. I have frequently asked the question as to where the 1.7 comes from, and did not get an answer. I read the IPCC report but did not get much the wiser other than to think (but I donot know) that it is a weighted figure. They look at the conc. of gases in 1750 and then do a weighting to 2005. Of course you can only do a weighting (=calculate proportional blame)if you are 100% sure what the cause is of a problem. If you donot have proof that CO2 is the problem (e.g. some stupid scientist like myself could not find it) you could be making a big mistake. At this stage I am not even sure if greenhouse gases are the cause of global warming.It seems to me no one did the right kind of testing. As to the integration problem: I was never any good at it, but should someone not have done a whole investigation into this and come up with a relationship that shows the net effect of the cooling and warming of CO2 at 0.01-.05%? The conc. is also important as relationships may change in certain concentration ranges. I think that is where ol Svante went into the mist. Also I think you cannot compare the radiation of the sun with earth, surely it cannot possibly on the same scale? Apart from the radiation trapped and reflected by CO2 we also sit with the problem that cooling may occur higher up the atmosphere (CO2 freezes at -40 degrees C I think?). Obviously where it freezes it must reflect a lot more sunshine. (compare water vapor with water droplets - I am sure the droplet reflect more sunshine.
    0 0
    Response: The radiative forcing from CO2 is calculated using line-by-line models in two papers:

    Collins, W.D., et al., 2006: Radiative forcing by well-mixed greenhouse gases: Estimates from climate models in the IPCC AR4. J. Geophys. Res., 111, D14317, doi:10.1029/2005JD006713

    Forster, P.M.F., and K.E. Taylor, 2006: Climate forcings and climate sensitivities diagnosed from coupled climate model integrations. J. Clim., 19, 6181–6194.

    Of all the forcings considered to drive climate, CO2 forcing is one with a higher level of understanding. As for the evidence that CO2 is causing warming, this has been observationally confirmed both by satellites and surface measurements of downward longwave radiation.
  36. Are these papers freely available to the public? Or are they hidden somewhere?? In any case why is it so difficult for anyone to show me the calculation as to how they came to that value of 1.7? You cannot do only measurements of downward longwave radiation because as I have clearly shown you, over and over again I should say, CO2 also causes reflection of sunshine. So you have to look at both.....and than you must report the net effect of the cooling and warming, if possible with measurements at various CO2 concentrations. Without the results of proper investigations into this, to say that we must reduce CO2 might be just as non-sensical as saying we must reduce water vapor or ozone (which are also greenhouse gases).
    0 0
  37. Henry Pool, you wrote "as I have clearly shown you, over and over again I should say, CO2 also causes reflection of sunshine." That is incorrect, as several people repeatedly have told you," and even have referenced peer-reviewed scientific papers that you, yourself, can read. "Reflection" is a specific physical phenomenon that is qualitatively different from absorption-followed-by-emission.
    0 0
  38. To be clear, CO2 does reflect radiation at some wavelengths, but reflection is inconsequential for the Earth's current situation of global warming.
    0 0
  39. Re 36, Henry: how can longwave radiation of the wavelength relevant to CO2 increase at the Earth's surface if CO2 is reflecting that out to space before it gets to Earth? I'm not going to go to much effort with you unless you're willing to think about this. In my opinion, you're not being taken entirely seriously here for the following reasons: 1. You make comments based on your own vague interpretations, 2. When asked for citations you make it hard for people to see what you mean and/or you cite things that don't make the point you pretend they do (both exemplified by the Astrophysical Journal abstract you quote in #28), 3. You seem to think that other people have to do things for you -- as SNRatio says, the burden is on you to be convincing, especially given all the evidence that there is an enhanced greenhouse effect (Venus is a good example of a high albedo but hot planet that you would have to explain). I think you can be more effective if you try to adjust your approach.
    0 0
  40. Henry Pool wrote "Apart from the radiation trapped and reflected by CO2 we also sit with the problem that cooling may occur higher up the atmosphere (CO2 freezes at -40 degrees C I think?). Obviously where it freezes it must reflect a lot more sunshine. (compare water vapor with water droplets - I am sure the droplet reflect more sunshine." No, CO2 does not freeze in the Earth's atmosphere. It does not even form liquid droplets. The partial pressure of CO2 in the Earth's atmosphere is far too low. "Partial pressure" is the pressure of CO2 if it were the only gas in the atmosphere. Since the total pressure of the Earth's atmosphere is (by definition) 1 atmosphere, and CO2 is on average 0.038% of the atmosphere, CO2's partial pressure in the Earth's atmosphere is on average 0.00038 atmospheres. At the higher levels of the atmosphere where the temperature gets low, the partial pressure is drastically lower even than that. You can see from CO2's phase diagram that it cannot possibly change from gas to liquid or solid at those pressures--not even at the Earth's surface, let alone high in the atmosphere.
    0 0
  41. Henry@Tom 37/38 e.g. I have shown in my quote used in #28 (this is the one Steve is complaining about) that oxygen/ozone, water vapor and carbon dioxide are the ones that seem to cause the bulk of earth's albedo. If earth's albedo has increased (as has been shown by Palle et al 2008: see in the conclusion) then it is is logical to assume that this must be due to increases in carbon dioxide and ozone and water vapor. I have proven to you that these gas concentrations have indeed increased. The good news is: they will keep increasing. Now Tom admits: "To be clear, CO2 does reflect radiation at some wavelengths, but (this?) reflection is inconsequential for the Earth's current situation of global warming." At least we are making some progress here. The question now is: how do you know that the reflection of carbon dioxide is inconsequential unless you have done some testing?
    0 0
  42. Henry@Tom at #40 thanks very much for that explanation, that has always puzzled me a bit. If you are correct then there is no CO2 freezing up at the poles either? How could they have done core ice analysis and find CO2?
    0 0
  43. Terrestrial albedo is not determined by the atmosphere but mainly by the planet surface (oceans, lands, ice, forest, etc.) and clouds. As for the atmosphere, reflectivity in the true meaning is zero because the index of refraction is 1, apart from the forth or fifth decimal place. What matters, instead, is Rayleigh scattering by molecules. It depends, among other things, on concentration (hence mainly N2 and O2 give some, although small, contribution) and on the inverse of the fourth power of the wavelength (hence contributing in the blue-UV part of the spectrum). Any supposed effect on earth albedo must consider this good old (and yet undisproved) 19th century physics.
    0 0
  44. Henry, many people have told you repeatedly that testing has been done. Just one example is a scientific paper I pointed you to, that you can read for yourself and so not have to take my word for it. I even told you where in that paper to look, so you don't have to read the whole thing. Yet you continue to write as if no one has pointed you to any sources.
    0 0
  45. Henry, when water snow falls it traps air in between the snowflakes. Accumulating weight of the snow on top compresses the flakes but does not squeeze out all the air. So the ice cores contain lots of trapped air, including CO2.
    0 0
  46. @Tom on 44, I did try to look at that paper but it is something to do with testing in high pressures and high CO2 concentrations which cannot be related to what we are talking about here. I think Riccardo is wrong, he does not understand what the gases are doing in the atmosphere when you see the sun's radiation on top of earth (before the atmosphere) and at sea level (below the atmosphere). This has been measured many times. Look at your own doc. Surely that difference (the radiation reflected), is what makes the bulk of earth's albedo? If you look at the sun's solar radiation spectrum then you can see that a bulk of UV is cut off, especially where the sun's curve is the biggest.
    0 0
  47. Henry, you wrote "I did try to look at that paper but it is something to do with testing in high pressures and high CO2 concentrations which cannot be related to what we are talking about here." Henry, you need to actually read the posts, not just skim them. I pointed you to not just that article, but I went to the trouble to tell you specifically which figure to look at in that article, and I explained specifically how it relates to "what we are talking about here." CO2's Raleigh scattering is inconsequentially small at its partial pressure in Earth's atmosphere, and more importantly any increases in its partial pressure (concentration) in the range of even the most horribly tremendous human-or-natural-caused releases would leave its Raleigh scattering still inconsequential. Look at that figure in that article.
    0 0
  48. Henry Pool, it's not me that's eventually wrong, it's two hundreds years of physics of radiation. Instead, for you it's correct that the radiation missing at the earth surface does not show up in the reflected spectrum and it's not absorbed (absorption, for you, is the word that confuses people). Then not even energy is conserved in the process ...
    0 0
  49. Really, we are going around in circles. Why not first answer me on 127? If I look at those graphs then there is really only a very small corner of earth radiation cut off by the CO2 at 14 um. It is not the surface area of the absorptions that is important, it is the width in um of the waveband lengths where absorption takes place (even the slightest absorption). This is where reflection (or scattering) takes place. Anyway; I have thought of the following simple experiment to settle this matter. Do you think it would work? If not, why not? Experiment 1 We have a glass vessel, about 1000 liters, flushed and filled with 80% nitrogen and 20% oxygen, representing the earth and its atmosphere at the beginning. We have a probe on the side, in the middle, connected to a thermocouple and a temperature recorder. We have a large heating element in the middle of the vessel. The vessel is closed from the outside. The outside temperature and humidity is kept constant, at all times. A measured amount of energy is released into the vessel. The resulting increase of the temperature in the vessel is recorded until it falls back to the base line. The area below the curve is measured. The measurements are repeated until a constant result can be reported. (A) We now double the amount of energy released into the vessel, this increase representing the doubling of energy released by human activity on earth from 3.5 billion people in 1960 to 7 billion people in 2009. The area below the curve is measured. The measurements are repeated until a constant result can be reported. (B) In the case of this first experiment, the result is predictable i.e. if you double the amount of energy released in a vessel you should find close to a doubling of the area under your graph. This already proves that Henry’s theory rather than a 25% increase in carbon dioxide may have some bearing on global warming. (For the time being Henry’s theory is still that global warming is caused by people releasing energy when flying, moving, cooking or just wanting to stay warm or cold) Experiment 2 Experiment 2 is exactly the same as experiment 1, but now the vessel is filled with air, which includes all 350 ppm or so carbon dioxide currently available in 2009 air. The results are C en D. What would be interesting for me to know is the difference between A and C and between B and D – in other words: if we release similar amounts of energy into the vessel, what effects, if any, does the carbon dioxide and the other gases present in air have on temperature retention inside the vessel?
    0 0
  50. Tyndall in 1859 did this kind of eeperiment for the first time. Since then it has been reproduced by many other. If each time we have to repeate two centuries of science, we'd be stuck at Galielo and Newton or maybe even Archimedes.
    0 0

1  2  Next

You need to be logged in to post a comment. Login via the left margin or if you're new, register here.


The Consensus Project Website

THE ESCALATOR

(free to republish)


© Copyright 2024 John Cook
Home | Translations | About Us | Privacy | Contact Us