Climate Science Glossary

Term Lookup

Enter a term in the search box to find its definition.

Settings

Use the controls in the far right panel to increase or decrease the number of terms automatically displayed (or to completely turn that feature off).

Term Lookup

Settings


All IPCC definitions taken from Climate Change 2007: The Physical Science Basis. Working Group I Contribution to the Fourth Assessment Report of the Intergovernmental Panel on Climate Change, Annex I, Glossary, pp. 941-954. Cambridge University Press.

Home Arguments Software Resources Comments The Consensus Project Translations About Support

Bluesky Facebook LinkedIn Mastodon MeWe

Twitter YouTube RSS Posts RSS Comments Email Subscribe


Climate's changed before
It's the sun
It's not bad
There is no consensus
It's cooling
Models are unreliable
Temp record is unreliable
Animals and plants can adapt
It hasn't warmed since 1998
Antarctica is gaining ice
View All Arguments...


Username
Password
New? Register here
Forgot your password?

Latest Posts

Archives

An underwater hockey stick

Posted on 1 October 2010 by John Cook

A new paper adds another piece of the puzzle to our understanding of past climate change. This one is Twentieth century warming in deep waters of the Gulf of St. Lawrence: A unique feature of the last millennium (Thibodeau et al 2010).  In this paper, the authors reconstruct North Atlantic water temperature over the last millennium using oxygen isotopes from ocean sediment cores on the Canadian east coast. What they found is the warming over the 20th Century has had no equivalent over the last thousand years.
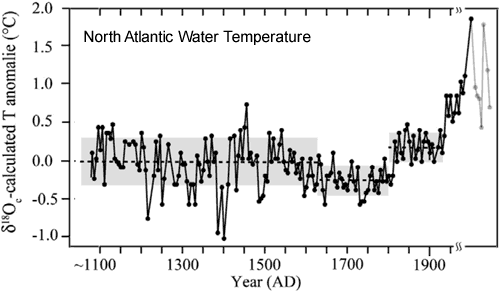

Figure 1: Temperature anomaly calculated from oxygen isotope composition. The grey lines to the right of the graph are shaded as that part of the core was disturbed by the coring process.

As the temperature record only represents one particular region, they also plot two reconstructions of Northern Hemisphere temperature which I've reproduced below (I use a colour version of the Moberg reconstruction with the instrumental record included).
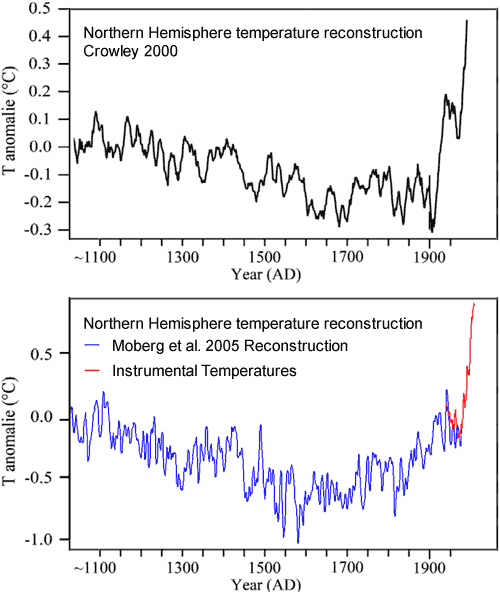

Figure 2: Two reconstructions of Northern Hemisphere temperature from 1100 to present (Crowley 2000, Moberg et al 2005).

The growing body of evidence is strengthening the view that current warming is unprecedented over the past 1000 years, as confirmed by a number of temperature reconstructions.

0 0

Printable Version  |  Link to this page

Comments

1  2  Next

Comments 1 to 50 out of 83:

  1. I can't keep up with all the posts on this site. Slow down! (not).
    0 0
  2. The Ville, John Cook is trying to show what overwhelming evidence means ;)
    0 0
  3. Nice post, John. Also, I like the use of the francophone spelling in the Y-axis of the graphs.
    0 0
  4. The Ville, Yes, slow down!! But, maybe not. I keep leaving aside interesting posts to read later, but never get to them because another post just as interesting comes up!!! Congratulations, John, this side is easily the best climate science resource on the web.
    0 0
  5. Moberg not Mobert haha
    0 0
    Response: It's been a long week :-( I fixed that error and while I was in there, I anti-aliased the text (it really bothered me that I'd missed that) and added some descriptive text to Figure 1 in case someone copies and pastes it out of context onto some other website.
  6. Yay! Thanks for this paper based post (I enjoy all of them, but do appreciate a diet rich in peer-reviewed science!)
    0 0
  7. Well.... considering the BIG jump in 1900... and the relative increase in radiative forcing then... This paper brings up quite a few BIG questions...
    0 0
  8. Im going to point out the obvious... You are seeing a much larger anomaly in ocean temps... leading atmospheric temps, this would be consistent with shortwave warming... not long wave. Overlaying the graphs(Moberg vrs NAWT), also shows ocean temps leading atmospheric in the modern era... There needs to be more reconstructions to really say anything definitive, oceans being oceans, this could be a coincidental current shift... but the ocean anomalies should NOT be leading, or greater than atmospheric anomalies. What are the local atmospheric temperature anomalies at the location in question?
    0 0
  9. Im speechless... this purported anomaly represents an utterly mind blowing amount o energy in the space o 50 years! This must be a local thing! It cant possibly be representative o the North Atlantic water temperature!
    0 0
  10. Fascinating find, John. Full text of this paper is available here (pdf). Joe, be sure to check out section 2, "Regional Context," which suggests your intuitions about inhomogeneity seem to have some factual underpinning.
    0 0
  11. This a thought coming directly out of my mind which I can't support in any sound way. We are used to think of the oceans as a slow responding system but more and more studies report relatively fast responses. It looks like we're missing something important on ocean dynamic. Is it just me or is it really surprising how fast the oceans appear to respond?
    0 0
  12. Surprising how fast the oceans respond? I don't know about fast. But I am a bit concerned about our current inability to determine if or when another 1998 style el Nino could come roaring out of the oceans. Another jolt to remind us to get on with the job of measuring just how much energy can accumulate down there. I'm not terribly keen on seeing another spike like that.
    0 0
  13. Thank you Doug for the link to the paper. Riccardo, this paper has found a direct correlation, to the deep water T's at the gulf of st lawrence vrs northern hemisphere atmospheric T's... i think it is a very interesting paper! It is a little complex though, in that it is the result of the mixing of several currents. For the oceans to show a much greater anomaly than atmospheric T's, would be a physical impossibility for it to be driven by LW forcing. But this is showing a change in current strengths, driving warming of deep waters... Whats caused it? Why isnt it lagging? It raises a lot o questions to my mind...
    0 0
  14. Joe, don't take my word as worth anything but the first thing that comes to mind for me when looking at fig. 1 of the paper is the confined area; I'm left wondering if the connection to the rest of the abyss is such that we're looking at what is effectively a semi-isolated pool of water, able to warm more quickly.
    0 0
  15. doug_bostrom I think that would be highly unlikely, assuming currents at the golf have remained consistent, as it would require negative entropy through the system. It will more likely be the result of changes in one or more of the currents feeding into the gulf. Either way, it does corroborate that the warming starting at the end of the 19th century, is unmatched during the last 1000 years. But this could be showing a strengthening of the THC at that time. All sorts o possibilities, but not enough info at this time to draw any concrete conclusions from it.
    0 0
  16. adelady #12 Enjoy the wettest September in Australia in 100 years and the current La Nina, the most water in outback in 20 years and the breaking of the drought. Of course the worst drought in 100 years was brought to us by - climate change driven by AGW. And of course the breaking of the drought was brought to us by - you guessed it - climate change driven by AGW!
    0 0
  17. For an update on the actual situation with regards to rain in Australia (in contrast to Ken's spin) read the following measured article from the ABC based on what the Bureau of Meteorology says - Record rain not enough to end drought In a summary: * If you consider the average rainfall across all of Australia, including the tropical north, the deserts and the temperate south, then the past year's rainfall is the wettest since the beginning of the drought. * But South-western Australia has had it's driest year on record by a substantial margin, getting less than 50% of the long term average. * And the south-east has received near it's average. * Dr Trewin says it is a false impression to think the long-term drought is over. "Partly the impression that people are getting is because this year has been closer to normal so it really stands out compared to the very dry conditions of the last four years," he said. The long term climate trends observed in Australia are presented in by the Bureau of meteorology in the following report: - State of the Climate report 2009 (6 pages, 300kn) So, in a nutshell: * Australia has had a wet[ish] year (depend on where you are exactly) superimposed on a long term drying and warming trend. * long term trends are that - the north is getting wetter, - and the south is getting drier. * Extremes are getting more extreme. * It fits with what climatologists predict will happen under AGW. * And Ken Lambert has cherry-picked September 2010 to make a lame assertion.
    0 0
  18. KL #16 It's not possible to draw strong conclusions from individual weather events. I'm sure that you know this, but why are you trying to misrepresent these data points?
    0 0
  19. Craig Allen at 13:04 PM, given the current strong La-Nina is forecast to remain in place until 2012, and that it is what happens in the Indian Ocean that has has as much, if not more influence over droughts in Australia generally, then the prospect of a longer rather than shorter period of above average rains looks most likely. As for regions that may be in drought, almost without exception, Australia being the size it is, located where it is, there is almost always somewhere under drought conditions. Whilst weather records officially only go back to the late 1800's, records exist that precede them which indicate that perhaps the 1800's were the most drought prone period since first settlement. During the Federation drought opinion were expressed at the time, that as bad as the Federation drought was then, it had been worse in the mid 1800's, and indeed the worst fire in Victoria's history, by far in terms of area burnt, occurred in 1851.
    0 0
  20. johnd #19 My point precisely johnd. kdkd and I debated this about 12 months ago and I quoted a paper in Australasian Science by a leading expert in evaporation and rainfall (will look for it). The conclusion for the Australian continent under warmer conditions was - wetter in the north and 'don't know about the MDB - could be wetter or drier' I recently saw a photo of the wharves at Bourke on the Darling taken in 1902 after 8 years of drought. There was a couple of puddles in the dry bed of the mighty Darling. Sturt described it in 1845 as 'coffee coloured and about 100 yards wide'. When I saw it recently, it was coffee coloured and about 90 metres wide below the weir.
    0 0
  21. Ken and JohnD may find this of interest: Shifting Storms (UNSW faculty discuss relationship of latitude and climate change in Australia).
    0 0
  22. I see your hockey stick and raise you a wavy line. The first reconstruction I found from a search I did on Web of Science. A NEW RECONSTRUCTION OF TEMPERATURE VARIABILITY IN THE EXTRA-TROPICAL NORTHERN HEMISPHERE DURING THE LAST TWO MILLENNIA Ljungqvist FC GEOGRAFISKA ANNALER SERIES A-PHYSICAL GEOGRAPHY Volume: 92A Issue: 3 Pages: 339-351 From the data and methods section "The new reconstruction presented in this paper consists of 30 temperature sensitive proxy records from the extra-tropical Northern Hemisphere (90–30°N), all of which reach back to at least AD 1000 and 16 all the way back to AD 1." From the abstract "The highest average temperatures in the reconstruction are encountered in the mid to late tenth century and the lowest in the late seventeenth century. Decadal mean temperatures seem to have reached or exceeded the 1961–1990 mean temperature level during substantial parts of the Roman Warm Period and the Medieval Warm Period. The temperature of the last two decades, however, is possibly higher than during any previous time in the past two millennia, although this is only seen in the instrumental temperature data and not in the multi-proxy reconstruction itself." The money shot. http://i54.tinypic.com/11wd2r5.png John it worries me that lines such as "The growing body of evidence is strengthening the view that current warming is unprecedented over the past 1000 years" means that this has turned into a fight over a sound bite. I'm more curious about what the various reconstructions tell us about natural variability. I know the conclusions drawn from a Mann hockey stick are very supportive of AGW. Would something like the Ljungqvist wavy line say this approach to diagnosing AGW is less conclusive?
    0 0
  23. Ken Lambert at 00:02 AM, this may not be the paper you were think of, but may be be of interest anyway CHANGES IN AUSTRALIAN PAN EVAPORATION FROM 1970 TO 2002 One of the earliest things I remember learning about the Darling River at school was how the river boats that used to go up the Darling in the 1800's to carry the wool out, would get stranded for years at a time if they missed getting out before the water levels fell. Even the Murray River stopped flowing during some of those early droughts.
    0 0
  24. doug_bostrom at 00:08 AM, the UNSW video only reinforced my opinion about their climate expertise. Early last year they published an article "Indian Ocean causes Big Dry: drought mystery solved". Anyone reading the article would get the impression that "the surprising finding" had been done by the UNSW scientists alluding it was they who had discovered the Indian Ocean Dipole IOD and "detailed for the first time" the link to Australia's weather. I found it most disappointing that they created that impression as it had been discovered by Japanese researchers, but also it had been discovered a decade before which put them well behind everybody else, even private forecasters and researchers here in Australia. In the video one of the speakers mentioned how the negative dipole that is associated with increased rainfall had been absent for about 15 years and seemed to allude that this was due to a permanent change in circulation patterns. What he didn't say however was the the long absence was not something new, in fact in the late 1800's it was absent for at least 25 years (the chart I took that from only began in 1880), absent again from about 1917 - 1930 and absent again 1942 - 1958, apart from the smaller gaps, but overall it seemed to be present more frequently from the 1970's to 1990's than any other period since the 1800's. All in all I wasn't impressed by the video presentation.
    0 0
  25. I just overlayed the two graphs. Seems to be a good argument against AGW. I'll have to read the paper.
    0 0
  26. So sorry, johnd, I forgot: you've got more knowledge stuffed between your ears than entire faculties of multiple universities. In future I'll remember not to bother trying to offer you anything that might be of interest to us ordinary mortals.
    0 0
  27. @TOP: which two graphs have you overlaid, and how is this a good argument against AGW?
    0 0
  28. doug_bostrom at 06:19 AM, are you saying that the just because you referenced a link to a UNSW video that they know more than researchers anywhere else? Just check the facts, check for yourself and see if the publication regarding their "discovery" is still available on their website. It had been authored by Bob Beale early 2009. Check the data on the Indian Ocean dipole and see if what was said in the video correlates with the recorded data. You may have your sources that support your views, most researchers have their own views, I look at a range and find some are more credible than others.
    0 0
  29. No, johnd, in point of fact you're claiming you know more, apparently: the UNSW video only reinforced my opinion about their climate expertise. I made the mistake of imagining you might have noticed the nuance conveyed by the UNSW researchers, how what they say comports w/your and Ken's remarks about moisture distribution. Nope, apparently you're focused on the things with which you disagree. You've reminded me of the futility of discussion in certain circumstances. Thanks for saving me another hunk of time.
    0 0
  30. I just overlayed the two graphs. I'll have to read the paper. Given the very low albedo of the oceans it is hard to believe this is driven by CO2. More like the atmosperic temps are being driven by the ocean.
    0 0
  31. doug_bostrom at 07:57 AM, the importance of the Indian Ocean to Australia's weather has yet to be fully appreciated by the likes of the UNSW, and even BOM and CSIRO. I have closely followed any research involving the Indian Ocean since the 1990's as I was interested in the apparent connection between weather patterns in SE Asia and SE Australia, two places that I had personal experience in. I had approached BOM scientists on two separate occasions and was told any connection was coincidental. Then I found the work of the Japanese researchers who actually identified the IOD in 1998, and an Australian forecaster/researcher who had also made the link and incorporated Indian Ocean data into his modeling at about the same time, leading to very accurate forecasts, which the Japanese also became able to provide. Australia's BOM has only in the last couple of years began to even refer to the IOD, and have not fully incorporated it into their modeling, I think they are waiting on new computers and say even then, reliable forecasts are probably still up to 7 years away. Fortunately reliable forecasts have been available for the last decade from other sources. It was against that background that I was astounded to read last year that the UNSW had just made a "discovery" linking the Indian Ocean to Australian weather. I'll take the work of the Japanese researchers any day over that of the UNSW, even BOM and CSIRO.
    0 0
  32. The Australian Bureau of Meteorology is a unit of the University of New South Wales. Or is it the opposite? Southwest Western Australian winter rainfall and its association with Indian Ocean climate variability 29 DEC 2000 Potential predictability of winter rainfall over southern and eastern Australia using Indian Ocean sea-surface temperature anomalies 1993 - bom.gov.au Sea surface temperatures and Australian winter rainfall 1989 Etc. Indian Ocean + Australia: new to you, not so much to the people you're claiming are ignorant.
    0 0
  33. @TOP: you're not making any sense. What two graphs did you overlay? What do you think isn't "driven by CO2"?
    0 0
  34. I overlaid the OP's bottom water hockey stick onto the IPCC's hockey stick. It looks to me like the water temps are driving the air temps. Water has a low albedo, it doesn't reradiate much of the energy that strikes it back into space. The anomaly in the water temps is larger than that in the atmosphere. It is the driver.
    0 0
  35. doug_bostrom at 08:39 AM, I haven't got time to answer you fully now, I will come back later. However I think you will find that any BOM references to IO SST is unrelated to the areas where the IOD data is collected. Perhaps you can find something that indicates when they began incorporating IOD data into their modeling. BOM were critical of the Japanese researchers a couple of years ago, 2007?, when the Japanese alone correctly forecast that a La Nina that was virtually promised daily by BOM as being imminent, was overidden and failed to eventuate by unique conditions that developed, and had been seen developing in the Indian Ocean by the Japanese. It became quite a story in the Australian rural press the following year when it was revealed that the correct forecast was available but BOM chose to ignore the signals instead following their own outdated, and still outdated modeling. Legal action was being considered against BOM for losses incurred by those who followed BOM, whilst those who followed advice based on the IOD talked of being hundereds of thousands of $ in front.
    0 0
  36. archiesteel at 06:32 The thing with this reconstruction, is its showing MUCH larger anomalies of deepish water, (400m, and double the size in a straight T comparison... water has a vastly greater thermal capacity than air) than atmospheric anomalies, at all instances in the past up until the core was disturbed(Mid last century). Energy dosnt sink, or concentrate itself, entropy increases, chaos increases(or stays the same) It dosnt decrease. You would expect this reconstruction, if it was driven by atmospheric T's in its region, to be considerably smaller than the atmospheric anomalies, and to be lagging atmospheric T's. This isnt the case. What this reconstruction, seems to imply to me, is that there was a sudden increase o the transport o warmer water into the north Atlantic shortly after 1900, and the atmospheric temperature anomaly at that time, is probably a result of this, rather than the cause of this. Why the increase in the THC?(if thats what it was) http://journals.ametsoc.org/doi/abs/10.1175/JCLI3328.1 I dont know, but ill pretend i do, for arguments sake ;-)
    0 0
  37. TOP, For the sake of discussion, let's examine this hypothesis that the ocean is the source of heat. Where is that heat coming from? What other observations could be made to validate or refute this hypothesis?
    0 0
  38. Yeah, johnd, you're the expert, after all. Clearly you've a good grasp of the literature.
    0 0
  39. johnd, the UNSW are still claiming what you were astonished about : A team of Australian scientists has detailed for the first time how a phenomenon known as the Indian Ocean Dipole (IOD) - a variable and irregular cycle of warming and cooling of ocean water - dictates whether moisture-bearing winds are carried across the southern half of Australia. Have you been in touch with them to show them their error, or have you alerted the Japanese or Indians about their work being plagiarised/misused/whatever you think ?
    0 0
  40. Bibliovermis at 09:05 AM says "Where is that heat coming from?" From the tropics, the oceans are going to be a much more efficient transporter of energy than the atmosphere, if the THC is slow, more energy will be lost via radiation to space than if the same energy is transported via currents. So an increase in the THC will result in more energy being transported to higher latitudes than if it is slowed. "What other observations could be made to validate or refute this hypothesis?" Just more extensive sedimentary reconstructions in the north Atlantic... This study more pertains to the warming in the first part of last century, and may raise a few Q's about natural variability... and whether the initial cause of the "unprecedented" warming as seen in the paleo reconstructions is anthropogenic in origins... Or did anthropogenic influences cause the THC speed up(assuming this is what is being seen)... I doubt we did, we weren't really effecting radiative forcing all that significantly at that stage.... and the cores were disturbed for the later part o last century.
    0 0
  41. @TOP: why don't you show us your overlaid graphs so we can see for ourselves?
    0 0
  42. archiesteel at 10:27 You can just drag the NAWT one and overlay just in the article above... but not the otherway round because it rescales... the Y axis's o course are at different scales however... But this is the obvious thing wrong with this picture... unless the globe decided to ignore the laws o Thermodynamics at some stage, ocean Ts are driving atmospheric in these graphs.
    0 0
  43. @Joe Blog: apparently you overlaid them as well. Why don't TOP and you post your reconstructions so we can eyeball them as well? Also, what do you mean by "THC"?
    0 0
  44. > > Where is that heat coming from? > > From the tropics. Allow me to rephrase the question. What is producing the heat? The thermohaline current doesn't produce heat, it transports it. Where is the origin of the additional heat? I was talking about instrumental readings, not reconstructions. The hypothesis that the Earth is warming from the inside out could be readily demonstrated.
    0 0
  45. archiesteel at 14:52 I shall attempt to... if this works this is just the top one dropped on top o the bottom one, not rescaled on the Y axis, for obvious reasons... The THC is thermohaline circulation. A major ocean current, that basically pumps energy from the equator to higher latitudes. montage Bibliovermis at 14:58 I think you will find, that, that giant fusion furnace in the sky is responsible for the VAST majority o the energy in the climate system, not the fission one under your feet. An obvious point, would be the lack of documented oceanic convection...
    0 0
  46. Bibliovermis, forgive me if I misunderstand your question. The heat being transported in THC is solar radiation warming tropical water and transporting it about the globe. The idea that heat is from the inside the earth can be readily dismissed. The bottom waters are dense and cold. We measure that. The heat flux from inside earth to surface is also measured from boreholes - routine part of petroleum basin evaluation these days (and part of my job). At around 40-80 milliwatts/m2, this is inconsequential compared to the 190 watts/m2 from sun.
    0 0
  47. When you overlay two graphs with dissimilar axes you have to rescale one or the other so they match. You also have to shift the zeros. Basic graph handling skills. Here it is. Pretty ugly but it gets the point across. Atmospheric "hockey stick" from IPCC as posted on wikipedia. Overlay The principals of heat transfer have been peer reviewed for hundreds of years. You have three choices:
    • Conduction slow not likely in liquids and gases
    • Convection rapid can transport vast amounts of heat very likely in gases and liquids not particularly dependent on the nature of the materials
    • Radiation speed of light very particular about the nature of the materials occurs at interface of two bodies separated by relatively free space, does not occur inside solid or liquid matter to as great a degree as in gases or vacuum
    • Phase Change As an adjunct to convection can transport orders of magnitude more energy than storage by temperature change alone. Transport of heat to the upper troposphere by phase change of water comes to mind.
    Since the water where these cores were taken were, as the paper points out, are relatively well insulated from surface effects (radiation, conduction from atmosphere) you have convection (which can be horizontal if by currents) and conduction from below. These water temperatures were also localized. We just don't have enough of these temperature measurement to make global statements. I believe we had some information about anomalies in the Southern Ocean Basin a few days ago. The same concerns apply there. What this paper opened up is the possibility that a ocean heat transport has melted the arctic ice from below. Remember, "science tends to be self correcting."
    0 0
  48. Scaddenp Do you evaluate basins like this? I would think that borehole data on really deep water is missing. Deep water is is 1 mile these days AFIAK and in fairly stable areas. Do you have data for deeper waters or waters in tectonically active areas? Are you aware of any papers? I agree with very cold, the paper stated that temps in the area in question was around 4C.
    0 0
  49. Top #33: "The anomaly in the water temps is larger than that in the atmosphere. It is the driver." Given that more than 90% of the enhanced greenhouse warming accumulates first in the oceans your statement above is obviously true... but your apparent conclusion that this means the oceans are somehow 'generating' the increased temperature is clearly illogical. If this were simple a matter of heat being transferred from the oceans to the atmosphere then we ought to be seeing ocean temperatures falling while atmospheric temperatures increase. Instead BOTH are increasing. That unquestionably indicates that some external factor, in this case an enhanced greenhouse effect, is causing warming to both. #46: "What this paper opened up is the possibility that a ocean heat transport has melted the arctic ice from below." We have known for some time now that most of the recent Arctic sea ice decline is due to increased ocean temperatures. Indeed, ocean warming is also believed to be responsible for much of the observed loss of land ice from Greenland and Antarctica. Again, this is due to the oceans absorbing additional radiation from the enhanced greenhouse effect... not some form of 'spontaneous ocean heating'.
    0 0
  50. TOP: Do you have data for deeper waters or waters in tectonically active areas? Are you aware of any papers? If you're constructing an alternative hypothesis about why the oceans are warming, it's incumbent on you to find information lending support to your hypothesis, not everybody else. It's odd, how frequently we have skeptics saying words roughly along the lines of "But this other thing might be happening, and you can't show otherwise until you've found the information I've not provided to support my hypothesis." TOP, there's scads of literature on heat flux at the bottom of the ocean. Go look at it, bring us the pleasant surprise we're all hoping for.
    0 0

1  2  Next

You need to be logged in to post a comment. Login via the left margin or if you're new, register here.


The Consensus Project Website

THE ESCALATOR

(free to republish)


© Copyright 2024 John Cook
Home | Translations | About Us | Privacy | Contact Us