


 Arguments


U.S. 2011: The Wet Get Wetter, the Dry Get Drier
Posted on 13 January 2012 by Tom Smerling
As the earth warms, “the rich get richer and the poor get poorer"--in rainfall.
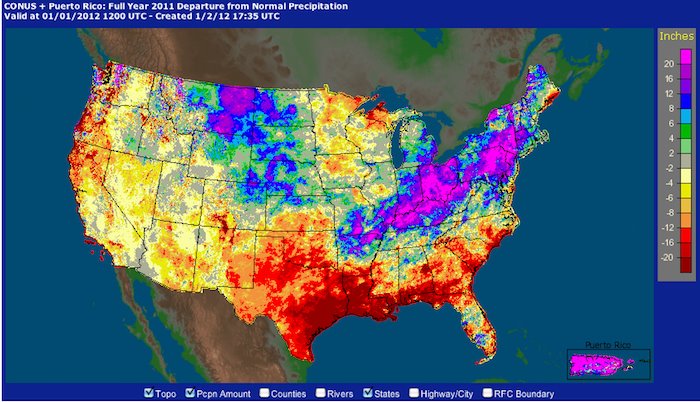
In 2011, over half the U.S. suffered either drought or deluge. Dr. Jeff Masters’ WunderBlog (12/12) summed it up:
“The combined fraction of the country experiencing either severe drought or extremely wet conditions was 56% averaged over the January–November period – the highest in a century of record keeping."
(Map courtesy of NOAA, via Jeff Masters and Heidi Cullen. Climate communicators: Note the artful use of color. The key information--orange drought areas and blue/fuschia wet spots--practically jumps off the screen.)
And the climate take-away?
"Climate change science predicts that if the Earth continues to warm as expected, wet areas will tend to get wetter, and dry areas will tend to get drier–so this year’s side-by-side extremes of very wet and very dry conditions should grow increasingly common in the coming decades.”
In a warming world, earth’s water cycle speeds up (See “Drought & deluge: It’s the Water, Stupid!“). Drought devastates agriculture; just ask Texas cattle ranchers.
After fast evaporation parches the South, prevailing winds blow the moisture-laden air northeastward. The result for Northeastern states: “When it rains, it pours.” Masters notes that 2011 was “the wettest year in nearly 200 years of record keeping in Philadelphia, Pennsylvania.” Weather.com adds that “at least 20 locations from the Ohio Valley to New England have set a new record wet year," shown in an interactive maps of towns that set new records for wet or dry conditions.
Masters concludes, “If you weren’t washing away in a flood, you were baking in a drought in 2011.”
Was 2011 a “sneak preview” of our climate future?
(Cross posted from ClimateBites, 1/4/12)


 Much like global temperature graphs, inventories of retreating/advancing glaciers, or global maps of extreme heat (the Hansen et al study), once you get beyond cherry-picked individual sites the bigger picture in every case clearly shows the trend.
 0
0  0
0


Comments