Climate Science Glossary

Term Lookup

Enter a term in the search box to find its definition.

Settings

Use the controls in the far right panel to increase or decrease the number of terms automatically displayed (or to completely turn that feature off).

Term Lookup

Settings


All IPCC definitions taken from Climate Change 2007: The Physical Science Basis. Working Group I Contribution to the Fourth Assessment Report of the Intergovernmental Panel on Climate Change, Annex I, Glossary, pp. 941-954. Cambridge University Press.

Home Arguments Software Resources Comments The Consensus Project Translations About Support

Twitter Facebook YouTube Mastodon MeWe

RSS Posts RSS Comments Email Subscribe


Climate's changed before
It's the sun
It's not bad
There is no consensus
It's cooling
Models are unreliable
Temp record is unreliable
Animals and plants can adapt
It hasn't warmed since 1998
Antarctica is gaining ice
View All Arguments...


Username
Password
New? Register here
Forgot your password?

Latest Posts

Archives

Is Pacific Decadal Oscillation the Smoking Gun?

Posted on 3 May 2008 by John Cross

The blogosphere is abuzz with the news that the Pacific Decadal Oscillation is reverting to a cool phase. Hot on the heels of this bombshell, a new climate model predicts a cooling North Atlantic Ocean will slow down global warming. This has led to speculation that man-made global warming is no match for natural cycles or even that Pacific Decadal Oscillation is responsible for most of the climate change over the past century including the warming since the mid-70's.

What is Pacific Decadal Oscillation?

The PDO is a climate phenomena found primarily in the North Pacific (as opposed to El Niño which affects mostly the tropical Pacific). It has two phases that it typically alternates between; usually staying in one phase for a significant period of time (as little as 10 and as much as 40 years). However, it's not uncommon for these long periods to be broken by intervals when it switches phases for anything between 1 and 5 years. The phases of the PDO have been called warm phases (positive values) or cool phases (negative values).
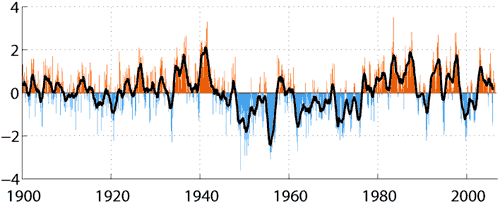

Figure 1: Monthly values for PDO index: 1900 to May 2006. Figure source: Climate Impacts Group

So the first lesson of PDOs is that while we talk about a 20 to 30 year period, it is not very clear cut at all. In fact, an analysis of the frequency of the events does not produce much in the way of a firm period. Incidentally back in 1999 it was predicted that we were entering a cool phase.

The second lesson of PDOs is that while we talk about warm phases and cool phases these are more names than physical descriptions. As seen in Figure 2, a cool phase PDO is associated with cool sea surface temperatures along the Pacific coast of North America, but the center of the North Pacific ocean is still quite warm. Consequently it would appear that there is nothing fundamental about a PDO that would cause significant changes to global temperatures.
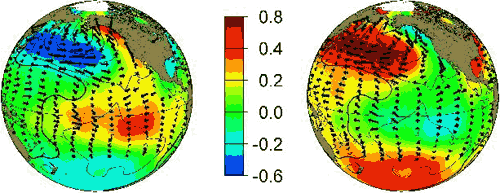

Figure 2: PDO warm phase (left) and cool phase (right). Image courtesy of JISAO.

Nevertheless, climate is always full of surprises and to be complete we should look at how the PDO's change of phase coincide with a change in climate trends? In 1905, PDO switched to a warm phase as global warming began. In 1946, PDO switched to a cool phase as temperatures cool mid-century. In 1977, PDO switched to a warm phase around the same time as the modern global warming period. Is PDO the smoking gun?
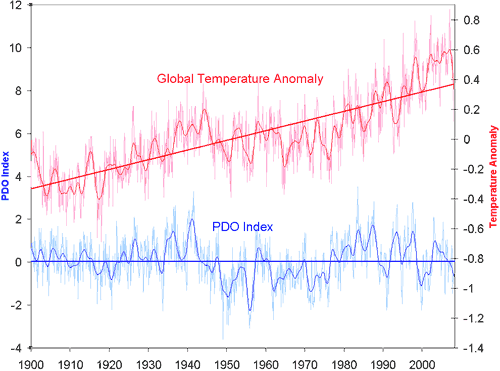

Figure 3: Monthly PDO index (blue) versus monthly global land ocean temperature anomanly (red). Smoothed data and trend lines are added.

While PDO does have some degree of correlation with short term variations in global temperature, the striking feature of Figure 3 is the contrast in trends between PDO and global temperature. Obviously the PDO as an oscillation between positive and negative values shows no long term trend. In contrast, temperature displays a long term warming trend. When the PDO last switched to a cool phase, global temperatures were about 0.4C cooler than currently.

The long term warming trend indicates the total energy in the Earth's climate system is increasing. This is due to an energy imbalance - more energy is coming in than is going out (Hansen 2005). Various factors affect the Earth's energy balance. A brightening sun increases inbound energy. Atmospheric aerosols reflect sunlight, decreasing inbound energy. Greenhouse gases absorb outgoing longwave radiation, reducing the amount of outgoing energy.

The total energy imbalance is expressed as net forcing, the sum of all the various forcings (eg - solar, aerosols, greenhouse gases, etc). Figure 4 compares net forcing to global temperature over the 20th century:
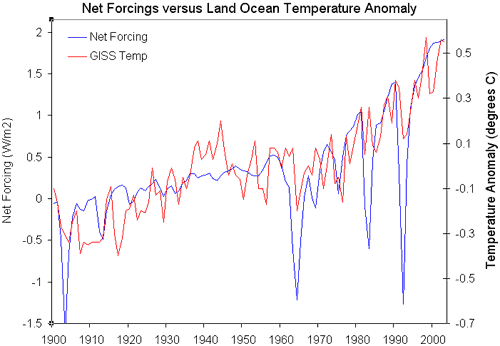

Figure 4: Net forcing (Blue - NASA GISS) versus global land ocean temperature anomaly (Red - GISS Temp).

When all forcings are included, net forcing shows good correlation with global temperatures. There is no single smoking gun. As our climate continues to absorb more energy than it emits, we can expect the long term warming trend to continue with short term fluctuations superimposed. This is the point of Keenlyside 2008 and is echoed by the Hadley Centre who predicted internal variability will partially offset the anthropogenic global warming signal for the next few years (Smith 2007).

Both predictions come from climate models seeking to incorporate ocean dynamics (I'm surprised noone has coined the term GCM 2.0 yet). These new models predict that while warming will slow over the next few years due to internal variability, the warming trend will resume in the long term.

This post was co-authored by John Cross and John Cook.

0 0

Printable Version  |  Link to this page

Comments

Prev  1  2  

Comments 51 to 53 out of 53:

  1. "The long term warming trend indicates the total energy in the Earth's climate system is increasing. This is due to an energy imbalance - more energy is coming in than is going out (Hansen 2005)." This may not be the case at all, although may not be obvious to everyone why not. And I am just throwing this out there to point out that we tend to accept what seem like obvious black-and-white preconceptions because we don't think of everything. It could be just a rearranging of the energy distribution. It could be that enough heat energy is sequestered in the deeper ocean (such as the Northern Pacific), and it only rises to the surface under certain conditions. Those conditions may be currents or wind patterns that change, for shorter or longer periods. ENSO is already understood to be a change in the wind currents (although the currents, too, might actually be an effect, not a cause). The heat signature (for satellites) of ENSO represents HUGE amounts of heat energy that does not appear to come from anywhere. It doesn't come from the Sun, so it must be heat coming up from the abyss. Perhaps the prevailing currents from Peru push the warmer water down (I know, that seems counter-intuitive.) But where does the heat come from, if not from the Sun? And if it does not come from the Sun, then it is not part of the albedo/energy In-Out balance. At least not in any way we currently know of. Back to the climate, as it applies to the PDO especially, the heat energy under the ocean may well up for periods, bringing more heat energy to interact with the atmosphere. This is all speculation. But I've been following the PDO since right around 2000, and wondered for quite a while when scientists were going to start to realize that climate theories and models that don't include the PDO simply cannot possibly be correct. The Pacific Ocean is the bull in the china shop, as far as climate goes. The Pacific is about 30.5% of the surface area of the planet - more than all the land area put together. It is fully FIFTEEN times as big as the United States. What happens out there, energy wise, in the Pacific dwarfs everything else. And then consider the 1/30th of 1% of CO2 in the atmosphere and the 5% or 2% of CO2 that humans create. How totally insignificant our activities are in comparison. The climate models upon which AGW were originally based were created in the early 1990s. This predated the discovery in 1997 of the PDO, so they could not have included the PDO. And if they don't, those models were (and are still, I believe) fundamentally wrong, because they were missing a huge factor, the PDO. One would have to think that it will be a decade or three of four before we adequately understand the PDO well enough to even approximate it in the models.
    0 0
  2. Feet2thefire, nice description of an important decadal variability contribution, second only to ENSO probably. You only did not mention that together with the warm phases there are negative phases and that's why it contributes to variability but not to the long term trend. Indeed, PDO has been in a neutral/negative phase during the last and warmest decade on record. As for the models, do you think that in 20 years nothing has changed? And, above all, models can not "include" PDO, the may show a PDO-like pattern of variability as some (not all) of them actually do.
    0 0
  3. Good blog, but go to Figure 3 and the caption Global Temperature Anomaly strike dead to the heart of AGW theory. Why is that temperature from 1900 an "anomaly". Why is the temperature of 1900, just out of the clutches of the Little Ice Age, the normal temperature for planet earth. Even a cursory study will show that there have even more dramatic changes in earths temperature during the past 1,000 years, and if we go back eons, then positively change is expected. http://en.wikipedia.org/wiki/Anomaly The word anomaly lies at the heart of the matter and is one of the reason that warmers can not be trusted. Figure 3 works real well on the public though!
    0 0

Prev  1  2  

You need to be logged in to post a comment. Login via the left margin or if you're new, register here.


The Consensus Project Website

THE ESCALATOR

(free to republish)


© Copyright 2024 John Cook
Home | Translations | About Us | Privacy | Contact Us