


 Arguments


A Buoy-Only Sea Surface Temperature Record Supports NOAA’s Adjustments
Posted on 27 November 2015 by Kevin C
This is an update of an update of an article which originally appeared at Climate Etc. The authors are grateful for the helpful comments which have informed the updates.
By Zeke Hausfather and Kevin Cowtan
Significant recent media and political attention has been focused on the new NOAA temperature record, which shows considerably more warming than their prior record during the period from 1998 to present. The main factor behind these changes is the correction in ocean temperatures to account for the transition from ship engine room intake measurement to buoy-based measurements and a calibration of differences across ships using nighttime marine air temperatures (NMAT). Here we seek to evaluate the changes to the NOAA ocean temperature record by constructing a new buoy-only sea surface temperature record. We find that a record using only buoys (and requiring no adjustments) is effectively identical in trend to the new NOAA record and significantly higher than the old one.
The changes to the prior NOAA global land/ocean temperature series are shown in Figure 1. There are some large changes in the 1930s that are interesting but have little impact on century-scale trends. The new NOAA record also increases temperatures in recent years, resulting a in a record where the period subsequent to 1998 has a trend identical to the period from 1950-1997 (and giving rise to the common claim that the paper was “busting” the recent slowdown in warming).
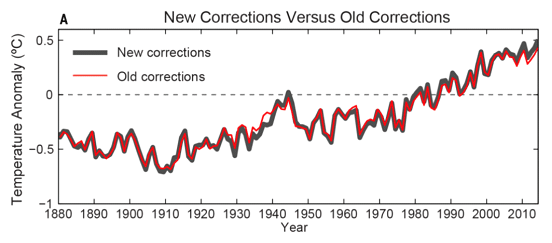
Figure 1: New and old homogenized global land/ocean records from Karl et al, 2015.
The paper that presented the revised record, Karl et al, didn’t actually do much that was new. Rather, they put together two previously published records: an update to the NOAA sea surface temperature record (called ERSST) from version 3 to version 4, and the incorporation of a new land record from the International Surface Temperature Initiative (ISTI) that makes use of around 32,000 land stations rather than the 7,000 or so GHCN-Monthly stations previously utilized. The new land record is quite similar to that produced by Berkeley Earth, though it has relatively little impact on the temperature trend vis-à-vis the old land record, particularly during the recent 1998-present period.
The slowdown-busting nature of the Karl et al paper relies almost entirely on the update from ERSST v3b to v4. During the post 1998 period, this is primarily due to a revised treatment of buoys and ship engine room intake (ERI) measurements and an improved calibration of differences across ships. During the past few decades the number of automated SST measurement buoys has expanded rapidly from effectively zero before 1980 to over 70 percent of all SST measurements today as shown in the figure below. Buoys are appealing measurement platforms, as they are not restricted to shipping routes and often have fully automated reporting via satellite uplink.
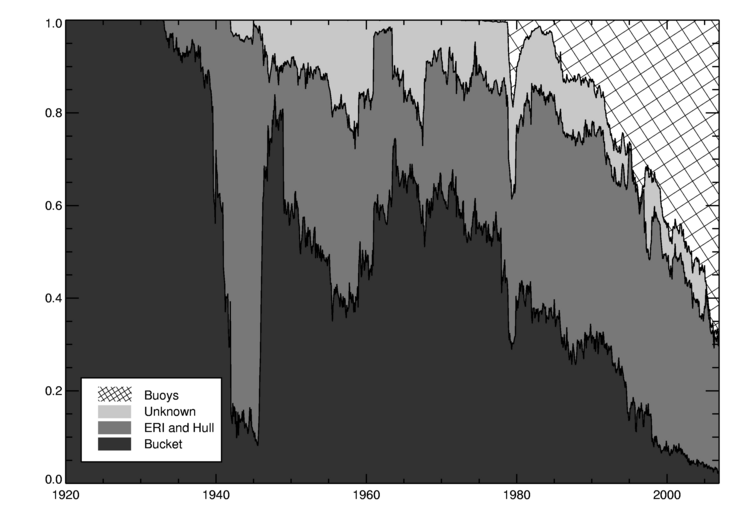 Figure 2: Share of SST observations by instrument type from Kennedy et al 2011. Note that this figure ends in 2006; since then buoys have continued to grow in observation share.
NOAA argues that the transition to buoys introduced a spurious cooling bias into the record. ERIs tend to warm the water a bit before measuring it (ship engine rooms being rather hot), whereas buoys do not. They identify a bias of around 0.1 C between buoys and ERIs and remove it by adjusting buoy records up to match ERI records in ERSST v4, as well as use NMAT readings to calibrate the differences across ships. These adjustments had not been done in the prior ERSST v3b. As an aside, the decision to adjust buoys up to ERIs or ERIs down to buoys should nominally be trend neutral. Indeed, in their work on HadSST3 Kennedy and colleagues explicitly tested this, and found “no appreciable difference” on trends.
However, there is a rather straightforward way for us to test if the adjustments done in ERSST v4 are proper or not: compare their adjusted record to a record made only from buoys. The buoy records are from purpose built instruments which are largely standardized, resulting in much more homogeneous record [details]. On the other hand, the buoy record is short, and has limited coverage in the early 90's.
The buoy-only record is prepared by calculating daily averages for each buoy. Buoys which show a large daily temperature variation are rejected: in deep water the daily temperature range is only a few tenths of a degree, but in very shallow water it can be substantial which presents problems when some data are missing. Next, the daily data are placed into 550 x550km equal area grid cells based on the location of the buoy for that day, and monthly averages are determined for each cell.
The resulting coverage is still limited and so produces a biased estimate of global sea surface temperature. To produce a useful comparison to ERSST, we therefore reduce the coverage of the ERSST datasets to match the buoy dataset (now using a fine 1 degree grid for all the data) and then calculate anomalies for all the datasets using a 2001-2010 baseline. The area weighted mean temperature is then calculated for each record. While this doesn't provide a very good estimate of global SST, it does allow a strict like-with-like comparison against ERSST over the regions where the buoys have coverage. The percent of global ocean covered by buoy measurements varies from around 40% in the mid 1990s to around 70% in recent years.
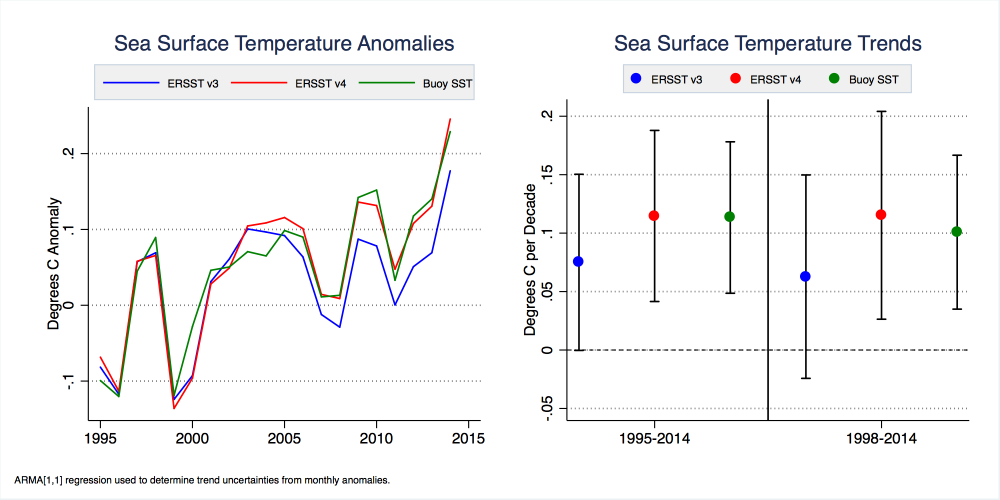
Figure 3: ERSST v3b, v4, and Buoy-Only SST anomalies and trends from 1995 through the end of 2014. The trend periods shown are the full record (1995-2014) and the “hiatus” period (1998-2014). 2015 is excluded as the year is incomplete, and the period prior to 1995 is excluded due to limited buoy coverage. The anomaly graph is baselined to 1995-2005 to show the time-evolution of differences.
As shown in Figure 3, a buoy-only record is quite similar to the ERSST v4 but shows statistically significantly more warming than ERSST v3b during the period from 1995 through the end of 2014 (p < 0.05 trend in the differences). This suggests that ERSST v3b suffered a cooling bias when blending buoy and ship records that is properly corrected in ERSST v4, at least for the areas where both ship and buoy records are available. Because the buoy record is relatively homogenous and requires no adjustments, it provides a good check in the validity of the combined ship-buoy series when normalized for spatial coverage.
In addition to the buoy-only dataset, we can also examine data from ARGO floats (which are not included in our buoy dataset). The ARGO floats have fairly good spatial coverage over the period since 2005. They are primarily intended to measure deep ocean temperatures, but also measure sea surface temperatures during their ascent from the depths to the surface. NOAA provides another sea surface dataset called OISST, which includes data from ships, buoys, and satellites. There are two versions of OISST: a daily version which is newer and includes adjustments to account for the transition from ships to buoys, and a weekly version which does not include this correction. Figure 4 shows how both the ARGO record and daily OISST record compare to ERSST v3b, v4, and our new buoy-only record when spatial coverage is normalized across all records.
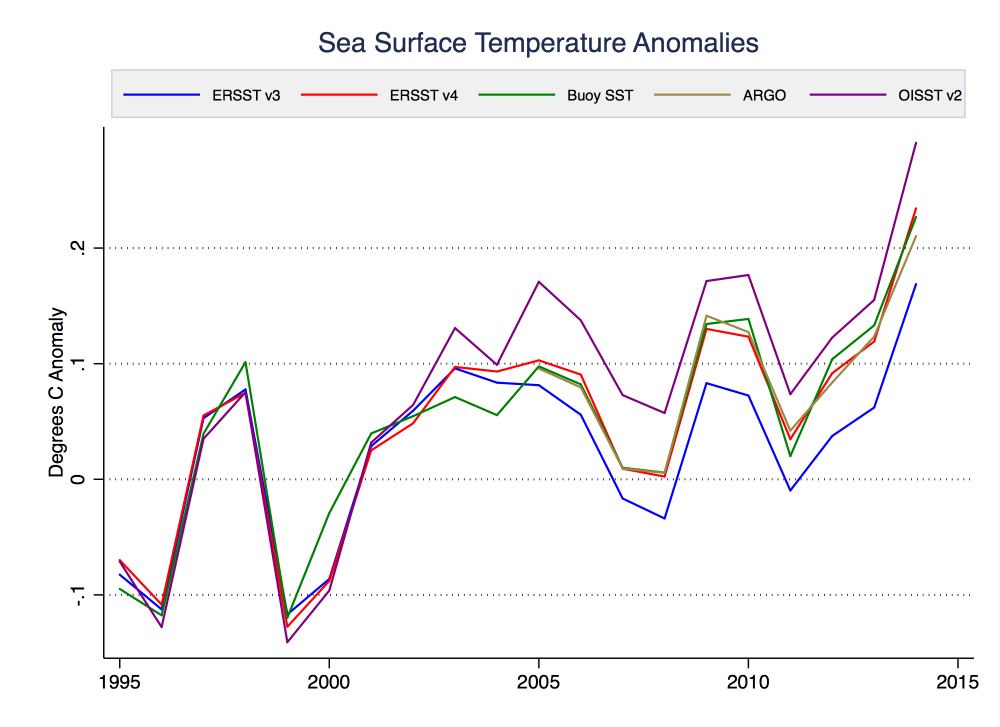
Figure 4: ERSST v3b, v4, and buoy-only, ARGO, and OISST SST anomalies from 1995 through the end of 2014. The anomalies shown are relative to a 1995-2005 period; the ARGO record is too short for this baseline and instead is matched to the buoy-only record during the period of overlap.
Over the period from 2005 to 2014, ARGO buoys show statistically significantly more warming than ERSST v3b (p < 0.05 using an ARMA[1,1] model), but indistinguishable from ERSST v4 or the buoy-only record. Similarly, OISST has the highest trend of all series over the 1995-2014 period. The trends of all series over these two periods are shown in Figure 5.
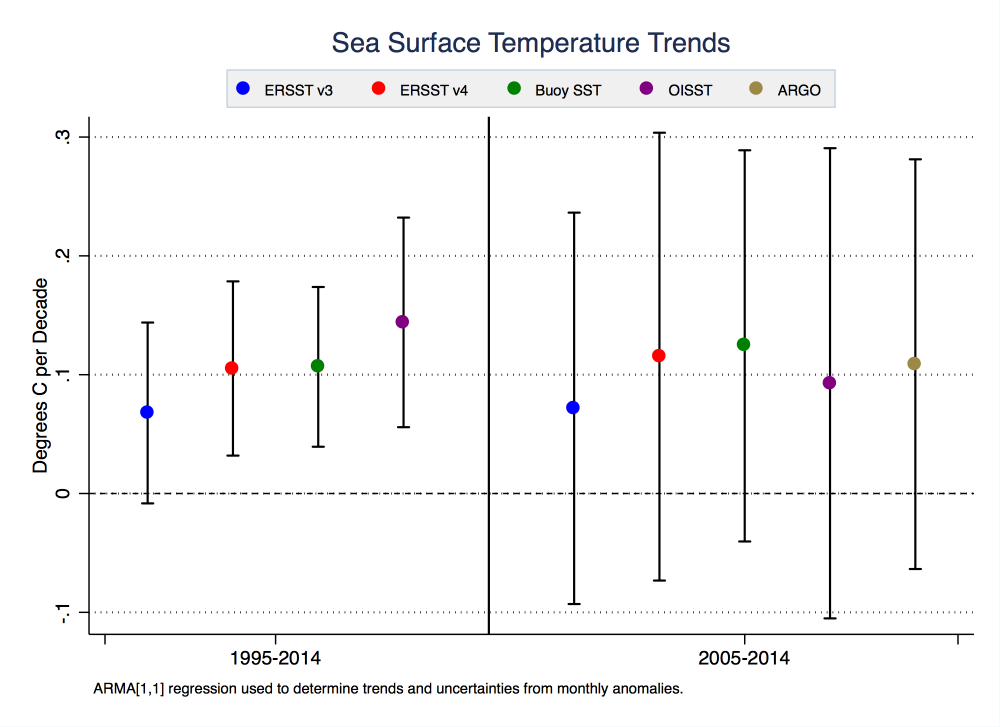
Figure 5: ERSST v3b, v4, and buoy-only, ARGO, and OISST SST trends from 1995-2014 and 2005-2014. The latter period is chosen to compare ARGO to other records, as the ARGO record does not have sufficient coverage prior to 2005. Confidence intervals are calculated using an ARMA[1,1] model to account for autocorrelation. Note: the confidence intervals indicate the uncertainty in the trends, which is dominated by interannual variability. The uncertainty in the trend in the differences is much lower, leading to a statistically significant difference between the buoys and ERSSTv3b.
The ship records are important because they form the foundation for a long sea surface temperature record, but they require careful calibration. The differences between HadSST3 and ERSSTv4 suggest that the finer details of the ship record are not yet settled, and as a result care is required especially when considering short term trends. However the buoy data, ARGO floats, and daily OISST record all support the NOAA claim that ERSSTv3b suffered a significant cool bias over recent years arising from inhomogeneities in the ship record and the increasing use of buoys.
Code for downloading and processing the data for this analysis is available here: http://www.ysbl.york.ac.uk/~cowtan/data/buoy.zip. While the code and data are only 18 MB, the (optional) raw buoy data are approximately 44 GB. Gridded 1x1 files are also provided for buoy, ERSSTv3b, and ERSSTv4 data.


dazed - "Before I do a lot of investigation, can someone fill me in on this? Am I misreading it? Is there some good reason it was done this way? Has ERSST4 made this question irrelevant?"
I think you should do much more reading on the peer-reviewed scientific literature. If you come up with some way of improving the sea surface temperature record then look at getting it published. But be aware that interminable rambling without actually performing some form of statiscal analysis won't get you anywhere.
@ Rob Painting
#51
You expect continued correlation when the circumstances dictate correlation between the ship and buoy data will grow worse in time. Not sure what you're amazed about.
You've hit on the heart of this matter!
I do expect continued correlation. The ship data was adjusted by Karl so that the adjusted ship data tracks in time with the buoy data (see the supplemental materials), which was the whole point of the adjustments.
I was responding to KR. He wasn't saying that the two shouldn't correlate, but he was arguing that the graph showed correlation. Perhaps it does. Graphs are useful, but it doesn't take the place of a statistical test of fit. On this topic, all I've ever said is that these statistics should be included, and without them, you can't claim correlation.
What I am "amazed" about is that they didn't include the stats I have come to expect when trying to make this kind of claim. Obviously others aren't as amazed.
You haven't done any work. Where are your calculations?
Excellant question. I haven't made any claims about whether the data correlates or not. What calculation would I do to prove that? The OPs have made a claim. Where are their calculations that prove that? They are not there.
If they want to show that the ERSST4 trend was significantly similar to the buoy trend, I think they have made that case, with the calculation to prove it.
@Rob Painting
The last post should have said #50. The comments broke across pages, and I got confused.
Now, #51
But be aware that interminable rambling without actually performing some form of statiscal analysis won't get you anywhere.
You've said this before. I listed claims I've made, and asked you what statistical analysis I could have done, since it didn't seem approriate to me. I also asked you if there was any other claim I've made that should be backed up by statistical analysis.
You haven't given me any. I can't fix a problem I don't see.
In fairness, could you not say this again without giving me some example?
I think you should do much more reading on the peer-reviewed scientific literature.
I can only read so fast. Do you have any recommendations on what I should read next? Is there a place on this site (or any other) where peer reviewed literature is discussed?
You quoted my question, but you didn't answer it. I don't know what to make of that.
dazed - Several points:
The issue discussed re: ERSSTv4 is not addressing colinearity of trends, but rather correcting for the biases of different measurements of the same values, the SSTs. Once the buoys and ship readings are comparable as apples/apples, only then can you look at the overall trends of the regional and global data. Again, correcting for instrument biases and how they differ.
There is no reason whatsoever to expect exact colinearity from different sampling techniques - random noise, differing sample points/times, and SST heterogeneity will cause trends to differ slightly, albeit in what may be a statistically insignificant amount.
Finally, you appear to not understand some very fundamental points, the differential weighting of buoys and ships, as well as the handling of anomalies where there is insufficient sampling: Your comments seem to assume that these are driven solely by temporal filtering, when both issues are in regards to both temporal and spatial extrapolation - how to treat uneven sampling with different noise levels when forming a global SST estimate. Buoys are given more weight when interpolated over space as well as time due to their lower noise, and where spatial-temporal sampling in the record is insufficient (particularly given high noise levels in the early data) anomalies are damped towards zero so that sparse and noisy data doesn't induce false trends. This is a very basic, and quite conservative approach.
---
As you noted above, you haven't dug into how the very issues you are raising are approached in the literature prior to complaining about them - and that's clear when you demonstrate you fundamentally don't understand how the data was formulated and merged in the first place. Until you actually understand the methodologies employed in ERSST and Karl et al, I cannot consider any of your concerns in that regard meaningful.
dazed and xonfused @52/53.
I note you are getting replies down this thread which may require better explanation. That is because these replies are too polite to make plain what they are having to contend with from you.
You say of Rob Painting @51 "You quoted my question, but you didn't answer it. I don't know what to make of that." Indeed so! Throughout this thread, your questioning is that poorly framed. I'm not sure anybody would "know what to make of that." That is the essense of it.
You engage here with the oddest of style that does little but suit your chosen eponymy. Thus @52 you tell us:
Yet there you leave it, full stop, end of subject, like someone dazed & confused. If I had "come to expect" the inclusion of "stats" within papers of this form and found them here absent withn Karl et al (2015) to the point of being amazed while all others seem oblivious, how should I react? Would I not strengthen my position by further demonstrating why all should be amazed? Would I not point to exemplars that do include these "stats" and set the challenge which would demonstrate how exceptional this omission truly is? Surely I would justify my amazement saying "Laurel & Hardy (2013), Jekyll & Hyde (2014), Skywalker et al (2015). All such papers have the "stats". Only in Karl et al (2015) are they absent!!!" So when you stop in full flow without such an addition and continue on a different point, you leave the whole world dazed & confused. Especially as that other point then presents the same thing but now says:
What calculations? Surely the ones in Laurel & Hardy (2013), Jekyll & Hyde (2014), Skywalker et al (2015). Oh but they are the fictional exemplars of my contrivance.
Now, @41 you tell us you are about this issue because a denialist friend:
So what are these amazing conclusions you on about?
Helpfully, @41 you list "the claims I made." Great! Except we are back to missing "stats" (1 & 2), a methodological claim (3) for which your parting comment is " If you're in doubt, I suppose I could hunt down a source.", and finally (un-numbered) a garbled account of a discission-in-progress involving apparently "attempts to do what is claimed to be impossible." It is all as clear as mud.
Here is a question for you. If the (1) (2) & (3) presented by you back @2 were exchanged for the (1), (2) & (3) presented by you @41, would it make the slightest difference to #2 or #41? If not, does that bring into question what if anything has been accomplished by the 10,000 words of comment you present between #2 & #41?
Despite your strong trollish accent, the commenters here have addressed you comments with respect. But nothing is being gained. Whether this is because you are unwilling to develop you position or unable, I couldn't possibly know, but this is why you are being urged @51 & @54 to put up or shut up, and I concur wholeheartedly with that urging.
@KR
The issue discussed re: ERSSTv4 is not addressing colinearity of trends, but rather correcting for the biases of different measurements of the same values, the SSTs. Once the buoys and ship readings are comparable as apples/apples, only then can you look at the overall trends of the regional and global data.
Couldn't agree with this statement more. It's what I've been saying all along.
That's my beef with ERSST3. It knowingly published data where this wasn't true, leading more or less directly to the hiatus issue. If they needed to publish a data set before they could make this adjustment, they should have choosen either the apple or the orange. Since the buoys don't go back very far, they should have used only ship data until this was corrected.
It's also my beef with NOAA for not correcting this ASAP.
Do you agree? I don't see how you couldn't, given your statement above. If you don't, please explain.
--------------
Colinearity is not the goal per se, as you say; the apple to apple thing is the goal. However, the only way to accomplish the apple to apple thing is to make the trends co-linear.
As you say, you need to convert apples & oranges to apples & apples. You do whatever adjustments you think are necessary to turn the oranges into apples. How do you know if you've done a good job? The ideal would be that when you processed your data, the apples and the neo-apples would end up producing the same exact results. Of course, that's never going to happen.
It would be useful to know how close to this ideal goal you are. For one thing, if the apples and neo-apples don't trend together, you don't really have apples to apples. That's why Karl checked this very issue and found them to be parallel to a tolerance of .002 C/decade. Is that good enough? Karl thinks so, but as you know, there is a statistical test (a Welsh t-test would probably be the preferred choice) to tell you whether this difference could be most likely do to noise (good) or not (bad). I do not know if Karl did this type of test, but I haven't seen it. Given how noisy the data is, I'd guess it would pass, but I don't like to guess.
So the trends must at least be parallel. If they are parallel but not colinear, it means that the neo-apples are giving you different temperature readings than apples at every time in the series. So even with parallel trend lines, you're not looking at apples to apples. When Karl adds in the buoy adjustment, he made them nearly parallel, but not exactly (I won't explain why I think this again unless you want me to). I'm saying, why not make a slightly different adjustment that makes them exactly parallel?
Co-linearity of the trends still doesn't mean you've achieved apple to appleness. You'd also want to make sure that the covariance is high (they zig and zag together). Especially you'd want to make sure that the covariance improved after your adjustments, or it would be hard to justify them. After all, if your adjustments made the zig-zag thing worse, they probably don't reflect reality very well, since both should strongly correlate with the actual AWT and so with each other.
I'm not saying that this isn't the case with the NOAA adjustments, I'm saying I don't know, and apparently, no one else does either, other than by eyeballing a graph. This is why I was dissappointed about the OP, based on the title. If you're confirming adjustments, this is the kind of analysis I'd expect.
[DB] As KR notes, you are simply resorting to sloganeering now and are wasting people's time here.
Please note that posting comments here at SkS is a privilege, not a right. This privilege can and will be rescinded if the posting individual continues to treat adherence to the Comments Policy as optional, rather than the mandatory condition of participating in this online forum.
Moderating this site is a tiresome chore, particularly when commentators repeatedly submit offensive, off-topic or repetitive posts oft debunked. We really appreciate people's cooperation in abiding by the Comments Policy, which is largely responsible for the quality of this site.
Finally, please understand that moderation policies are not open for discussion. If you find yourself incapable of abiding by these common set of rules that everyone else observes, then a change of venues is in the offing.
Please take the time to again review the policy and ensure future comments are in full compliance with it. Thanks for your understanding and compliance in this matter.
Repetitive and sloganeering stricken.
dazed - "It's what I've been saying [not colinearity] all along" Bzzzzt. You've erroneously harped on the ERSST adjustments being about colinearity and parallel trends in more than half your comments. And you continue to do so in your last one.
You continue to go around in circles, implying and suggesting failures of methodolgy, promptness, etc., while not doing any work yourself, demonstrating that there are actually issues, referencing papers that might, or for that matter - fully reading or understainding the work you are criticizing. You are simply wasting peoples time. Quite frankly, you are IMO just trolling. Accordingly, I'm not going to waste further breath on your unsubstantiated complaints.
MA Rodger @55 , and KR @57 , your comments are appropriate, though a tad harsh perhaps.
Yes, even from post #2 of this thread, there have been strong whiffs of the denialist tribe of fairytale sub-pontine dwellers.
Nevertheless, there has been a degree of entertainment value in the dazed ramblings ( ?circlings? ). It is almost as if the "Quill" (prose-generating) software has been married to a Monckton-simulating algorithm.
If true, that marriage represents a "marvellous" technological development : and adds a whole new dimension to the Turing Test ~ in that we readers must now seek to discriminate between human psychopathology vs. intellectually-vacuous software.
I'm sorry for wasting your time. I will stop posting for the time being, as to not clog your airwaves.
I'd appreciate it if you didn't kick me. If per chance anyone has a question for me, I'd still like to be able to respond.
My goal all along has been to talk about the mathematics with someone who understands them. That hasn't happened. Perhaps that's my fault.
If the mod felt the need to censor me on #56, I appreciate that the mod at least left it readable instead of deleting it.
I believe #56 (part b) reflects the very basics of time series analysis. I thought I was stating the obvious. If I could indulge you one last time, show that single post to someone who knows about that stuff, and see if they think I am wrong in any way. Please let me know what they say.
There seems to have been a lot of suspicions about my motives. That's understandable, as you're at defcon 5 when it comes to contrarians.
I know you have no reason to believe me, but for the record I don't have any secret agenda. I absolutely love science, and to that end I'd like to see the science be the best possible in any area. I think it's obvious there is global warming, just look at the buoy data. At this point, I don't have an informed opinion about much else. I will continue to explore the issues surrounding global warming, sadly without your help.
@eclectic - I never gave you the response I promised. My apologies for that, but it doesn't seem likely at this point. Perhaps you are happier for that.
Thank you for the priveledge allowing me to post at SkS!
[DB] You are welcome to post reasoned comments supported by credible evidence and substantive analysis. But when responses are given, it is incumbent to both understand the given response and to then revise one's position as appropriate. Merely ignoring the response and repeating yourself is not effective communication nor enhancing the discussion.
Inflammatory, argumentative and moderation complaints snipped.
[JH] Excessive repetition is also expressly prohibited by the SkS Comments Policy.
You're welcome, Dazed & con. [ @59 ] .
You needn't respond to me : for I can make a fair extrapolation to your likely responses.
* If you are indeed a "real boy", then I must beg you to step back and look at the bigger AGW picture. Science does not exist in order to produce beautiful numbers. (IMO) the ultimate aim of science is twofold : to produce real understanding of the cosmos, and to produce effective means of making beneficial alterations therein. ( Which, and whose benefits, is of course a separate question! )
* If you are a software, then you are a damn fine piece of work. Though I must caution your creators not to indulge in quite so many spelling errors ~ stuff like privilege with a "D" , and collinear with one "L" . . . are not at all convincing (of verisimilitude) to the cynical reader.
But to the real boy Dazed : it was a pleasure to read (some of) your contribution to the thread. Best of luck for the New Year of 2016. I hope you will delve "deeper and wider" into climate science, and will also sensitize youself to the (often unstated) background "culture" of climate science discussion ~ and as you proceed, you will note how it is almost exclusively the Denialists who commit the cherry-picking / the fallacious logic / the fallacious comparisons (e.g. Galileo's case) / the continual repetition of previously-debunked ideas & graphs etc. (And not to mention the insane Conspiracy Theories.)
In view of the many Canards put about by the science-deniers . . . it is best if learn to clear your throat in a way that doesn't sound anywhere near a quack. [ excuse puns! ]
Cheers !