Climate Science Glossary

Term Lookup

Enter a term in the search box to find its definition.

Settings

Use the controls in the far right panel to increase or decrease the number of terms automatically displayed (or to completely turn that feature off).

Term Lookup

Settings


All IPCC definitions taken from Climate Change 2007: The Physical Science Basis. Working Group I Contribution to the Fourth Assessment Report of the Intergovernmental Panel on Climate Change, Annex I, Glossary, pp. 941-954. Cambridge University Press.

Home Arguments Software Resources Comments The Consensus Project Translations About Support

Twitter Facebook YouTube Mastodon MeWe

RSS Posts RSS Comments Email Subscribe


Climate's changed before
It's the sun
It's not bad
There is no consensus
It's cooling
Models are unreliable
Temp record is unreliable
Animals and plants can adapt
It hasn't warmed since 1998
Antarctica is gaining ice
View All Arguments...


Username
Password
New? Register here
Forgot your password?

Latest Posts

Archives

Ocean Heat Content And The Importance Of The Deep Ocean

Posted on 24 September 2011 by Rob Painting

Most of the heat from global warming is going into the oceans. Covering some 70% of the Earth's surface and having a heat capacity a thousand times more than the atmosphere, it's easy to understand why the oceans are the main heat sink.
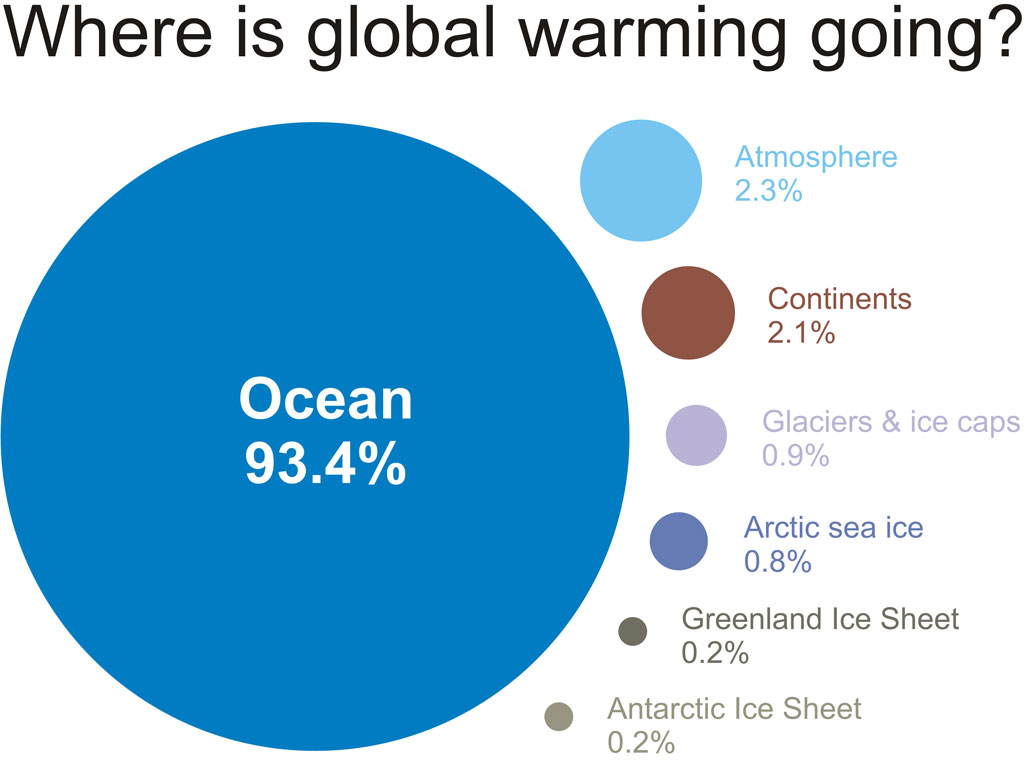
Multiple studies measuring from the ocean surface down to 700 metres show very little warming, or even cooling, over multiple years in the last decade. This is surprising given that some studies estimate that the imbalance at the-top-of-the-atmosphere (TOA), the difference between energy entering and leaving Earth's atmosphere over that time, has actually grown. So we might have expected the 700 metre sea surface layer to show increased warming. However the average depth of the ocean is around 4300 metres, and in a recent SkS post, we saw that when measurements were extended down to 1500 metres, the oceans were found to still be warming, indicating that heat is somehow finding a way down to the deep ocean.

SkS has recently looked at Asian aerosols as a contributor to the 'slowdown' in warming, but a recent climate modeling study, Palmer (2011), suggests another possible cause - that heat is able to be buried into deeper ocean layers, something the observations seem to support. The study found that there are mechanisms operating in the climate models, over decadal timeframes, which are able to distribute heat to all depths of the ocean. So only measuring down to 700 metres doesn't give an accurate indication of the total amount of heat being absorbed by the oceans.

TOA and OHC 

To examine the relationship between the top-of-the-atmosphere (TOA) and ocean heat, Palmer (2011) used three generations of Hadley Centre climate models and ran multi-century simulations in which the TOA was imbalanced. Three different values for this TOA imbalance arose out the processes inherent in each model - in other words the natural variability in the models.

The authors found that it was necessary to integrate OHC from all ocean layers, to understand what was going on at TOA. See Figure 1. 
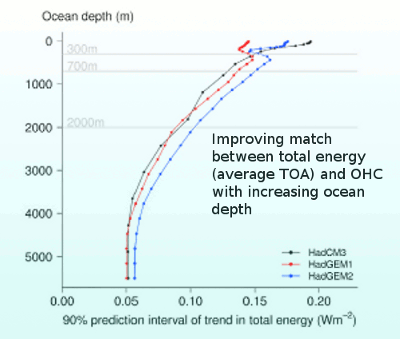
Figure 1- The 90% prediction interval for decadal trend in total energy (average TOA in the models) associated with OHC from the surface to deeper ocean layers. As deeper layers of the ocean are included in measurements, the average TOA and OHC show closer agreement. See Palmer (2011) for details.

The 3 coloured lines represent the 3 climate models used. The vertical axis is the ocean depth and the horizontal axis represents the ability of the decadal ocean heat content trend to predict the decadal TOA imbalance trend on 9 out of 10 occasions (90%). By including successively deeper layers of the ocean the difference between the value of TOA and OHC grows smaller.   

Statistical regression analysis of the results found a weak relationship between sea surface temperature (SST) and TOA in the climate models (Figure 2a), due to internal variability. Only when the full depth OHC trend was included in the analysis was there found to be a strong relationship between OHC and TOA (figure 2b). In other words, to account for the heat sequestered in the ocean, we have to measure right to the bottom.
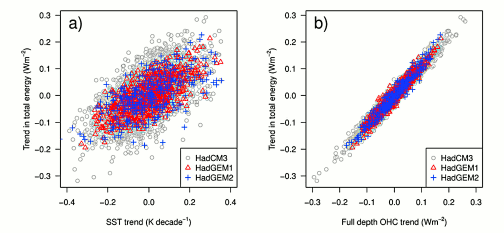
Figure 2 - Plot of linear decadal trends in total energy regressed against a) decadal trends in globally averaged sea surface temperature; b) decadal trends in full-depth ocean heat content. Note that total energy is equivalent to to the average TOA over the same period. From Palmer 2011.

The ocean is not a bathtub

A common misconception about the oceans seems to be the idea that heat can only travel directly downwards into deeper ocean layers, as if the oceans were only one-dimensional models, or perhaps a bathtub. Clearly this isn't the case, a vast amount of heat is moved around the world's ocean via the Thermohaline Circulation, and science is steadily coming to terms with the many ocean processes which mix heat down into the depths. La Nina is a classic example of how quickly heat from surface layers can be mixed down to the deep, and this is something I'll cover in my next post.

So to sum up:

  • Mechanisms exist within climate models, which are capable of mixing heat down to the deep ocean on decadal timeframes.
  • Current observations of the 700 metre surface layer have shown little warming, or even cooling, in the last 8 years; but the surface layer down to 1500 metres has shown significant warming, which seems to support the modeling    
  • Climate modeling and observations indicate that to fully understand the global enery budget (where all the heat is going) we need to include measurements of the deep oceans. The surface layers, even down to 700 metres, are not robust indicators of total OHC.

Related SkS posts: Deep ocean warming solves the sea level puzzleBillions of Blow Dryers: Some Missing Heat Returns to Haunt Us, Ocean Cooling Corrected, Again, and The Deep Ocean Warms When Global Surface Temperatures Stall

0 0

Printable Version  |  Link to this page

Comments

Prev  1  2  

Comments 51 to 62 out of 62:

  1. Rob Painting @50 I will look forward to your post and the latest information on OHC and how well it is measured.
    0 0
  2. Rob, You talked about doing a post on La Nina. Could you also do a post (if the information is there) discussing all of the mechanisms, known or proposed, that are responsible for getting the heat deeper into the ocean? Has anyone made any effort to quantify this into an expected rate-of-warming?
    0 0
  3. Critical Mass @51 - Thanks. Sphaerica - I'm not so sure about all the mechanisms of ocean heat transport because some are only very minor players, and many have yet to be quantified in any meaningful way. As for OHC uptake and transient climate sensitivity. I'm reading through some papers at the moment. I'll get around to discussing that too.
    0 0
  4. Rob, a question (thanks!): How is it that the oceans have apparently only warmed about 0.1 C over the past 57 years but the atmosphere has warmed by about 0.8 C since 1979? I find it hard to understand, as the oceans are the major heat sink and I'd have thought the water cycle would rapidly equilibrated such a discrepancy.
    0 0
  5. Markx - the oceans have around a thousand times the thermal capacity of the atmosphere.In other words they can absorb a great deal more energy, than the atmosphere, before this causes a change in temperature. This is due to the greater mass of the ocean - there are simply more molecules in the ocean to 'divvy up" energy to. The actual process of ocean warming is very complex, but we fully expect the oceans to warm much more slowly than the atmosphere.
    0 0
  6. BC, note the "related SkS posts" links at the bottom of the article above.
    0 0
  7. DSL. Thanks for the links. I'll do some browsing, which may take me a while. I've read much of the first link in your blog on the 2 May post, and the rest look good too. What I'm interested in reconciling for myself are these two facts 1. the large ocean flows can move heat quite effectively on decadal timeframes, as explained in this post 2. CO2 doesn't get mixed quickly in the oceans, despite these flows, and CO2 absorption only happens at century and thousands of years timescales - "mixing of shallow and deep oceanic waters takes place over hundreds to thousands of years" - SKS post 2 May,-"Two centuries of Climate Science". So the oceans don't absorb as much as was expected in the past; hence the atmospheric build up that is occurring
    0 0
  8. BC @57, mixing of the deep ocean takes hundreds of years, in part because of the very slow exchange between deep ocean and surface except in the North Atlantic, and Antarctic Ocean; and in part because of the much greater volume of the deep ocean compared to the surface, with the deep ocean having approximately 5 times the volume of surface layers. After the deep ocean and surface reach equilibrium for CO2 concentration, CO2 concentrations will continue to reduce due to the weathering of rocks and the deposition of carbon rich skeletal remains in sediment at the bottom of the ocean. This process takes thousands of years. In this image, showing the results of various models, the initial rapid reduction is due to equilibriation in the ocean, while the long slow reduction that follows is due to geochemical sequestration.
    0 0
  9. Tom @58, thanks. That explains the CO2 side quite well. Is a 1000Pg pulse = a trillion gigatonnes (=10**(12+9+6)=10**27g)? I'm pretty sure that this was a target mentioned by Julia Guillard (Australian Prime Minister) last year that the world needs to stay below. The La Nina occurs when there is a flow across the Pacific from east to west with the ocean up-welling colder water near Peru (this is my understanding anyhow). So I'm guessing from your not mentioning it that this doesn't involve the deep ocean, just the upper levels?
    0 0
  10. Actually maybe it was a trillion Kg = 10**15?
    0 0
  11. I've just looked it up. The limit was that emissions must be less than 1 trillion tonnes = 10**18. Sorry about the confusion.
    0 0
  12. BC @59, as you seem to have realized, 1000 Petagram = 1 trillion tonnes, and yes, to have a better than 50% chance of avoiding rises in Global Mean Surface Temperatures below 2 degrees C, we need to keep total CO2 equivalent emissions below 1 trillion tonnes. It is generally accepted that rises of GMST or more than 2 degrees C will have major, net harmful effects, and a considerable body of opinion thinks the relevant limit is 1.5 degree C, to avoid which we need to keep CO2 levels below 350 ppmv, or as we have already passed that, quickly bring CO2 levels back down. With regard to the ENSO effects, changes in ENSO state have been shown to significantly effect the accumulation of Ocean Heat Content from 0-750 meters, with the "missing" heat turning up in the 750-2000 meter range. That is certainly much deeper than the mixed layer, but whether you would call it the upper levels? I don't know. What is more, I known no more about it than that, so I cannot comment on the specific movements of heat involved.
    0 0

Prev  1  2  

You need to be logged in to post a comment. Login via the left margin or if you're new, register here.


The Consensus Project Website

THE ESCALATOR

(free to republish)


© Copyright 2024 John Cook
Home | Translations | About Us | Privacy | Contact Us