Climate Science Glossary

Term Lookup

Enter a term in the search box to find its definition.

Settings

Use the controls in the far right panel to increase or decrease the number of terms automatically displayed (or to completely turn that feature off).

Term Lookup

Settings


All IPCC definitions taken from Climate Change 2007: The Physical Science Basis. Working Group I Contribution to the Fourth Assessment Report of the Intergovernmental Panel on Climate Change, Annex I, Glossary, pp. 941-954. Cambridge University Press.

Home Arguments Software Resources Comments The Consensus Project Translations About Support

Twitter Facebook YouTube Mastodon MeWe

RSS Posts RSS Comments Email Subscribe


Climate's changed before
It's the sun
It's not bad
There is no consensus
It's cooling
Models are unreliable
Temp record is unreliable
Animals and plants can adapt
It hasn't warmed since 1998
Antarctica is gaining ice
View All Arguments...


Username
Password
New? Register here
Forgot your password?

Latest Posts

Archives

The role of stratospheric water vapor in global warming

Posted on 1 February 2010 by John Cook

There's been a number of queries regarding a new paper examining the role of stratospheric water vapor in global warming. The paper is Contributions of Stratospheric Water Vapor to Decadal Changes in the Rate of Global Warming (Solomon 2010). There are a few overly excited interpretations of the paper's results circulating around the blogosphere. This is presumably from readings of media clippings, not the actual paper. To accurately determine the significance of Solomon 2010, the best course is to see what the paper actually says.

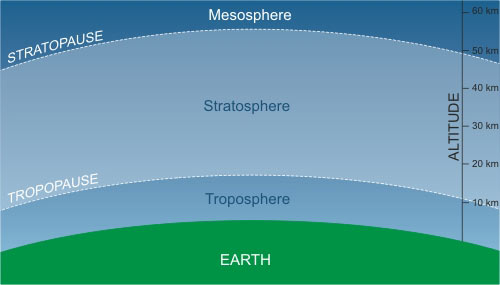
The atmosphere is divided into several layers. The troposphere is the lowest part of the atmosphere. It contains most of the atmosphere's water vapor, predominantly supplied by evaporation from the ocean surface. Through the troposphere, temperature falls as altitude rises. The boundary between the troposphere and stratosphere is called the tropopause. This is known as the "cold point", the coldest point in the lower atmosphere. In the stratosphere, temperature actually rises with altitude. It warms as you get higher - the opposite of the troposphere.
Atmospheric layers: Troposphere, Stratosphere and Mesosphere
Figure 1: Atmospheric layers: Troposphere, Stratosphere and Mesosphere

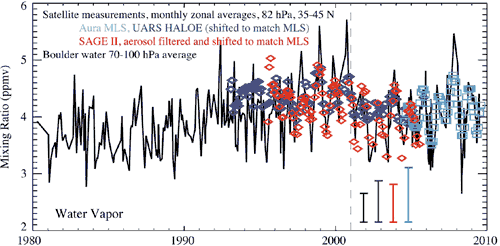
Solomon 2010 looks at the trend of water vapor in the stratosphere. Before 1993, the only observations of stratospheric water vapor were made by weather balloons above Boulder, Colorado (black line in Figure 2). They observed a slight increase from 1980. After 1993, several different satellites also took measurements (coloured circles, squares and diamonds in Figure 2). The various observations all found a significant drop in stratospheric water vapor around 2000. Most of the change in water vapor occurs in the lower stratosphere, just above the tropopause. The greatest changes also occur in the tropics and subtropics.
Water Vapor in stratosphere
Figure 2: Observed changes in stratospheric water vapor. Black line: balloon measurements of water vapor, taken near Boulder Colorado. Blue diamonds: UARS HALOE satellite measurements. Red diamonds: SAGE II instruments. Turquoise squares: Aura MLS satellite measurements. Uncertainties given by colored bars (Solomon 2010).

What effect would this have on climate? Figure 3 shows the change in radiative forcing imposed by changes in stratospheric water vapor. The dotted line is the radiative forcing without the effect of stratospheric water vapor changes. The grey shaded region shows the possible range of contribution from changing stratospheric water vapor. As it's a greenhouse gas, increasing water vapor has a warming effect. Consequently, the steady rise from 1980 to 2000 added some warming to the existing warming from greenhouse gases. The drop in water vapor after 2000 had a cooling effect.
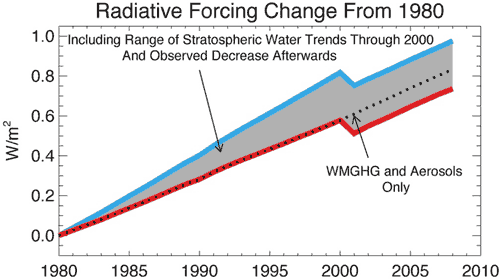
 
Figure 3: Impact of changes in stratospheric water vapor on radiative forcing since 1980 due to well-mixed greenhouse gases (WMGHG), aerosols, and stratospheric water vapor. The shaded region shows the stratospheric water contribution (Solomon 2010).

What caused these changes? Water vapor in the stratosphere has two main sources. One is transport of water vapor from the troposphere which occurs mainly as air rises in the tropics. The other is the oxidation of methane which occurs mostly in the upper stratosphere. Most of the change in water vapor occurs in the lower stratosphere in the vicinity of regions affected by the El Nino Southern Oscillation. This seems to point towards convection and internal variability driving the changes. A comparison between stratospheric water vapor and tropical sea surface temperatures show good correlation which corroborates a link with El Nino. However, the correlation breaks down in some periods suggesting other processes may also be important. Consequently, the authors are cautious in coming to a firm conclusion on the cause.

There seem to be two major misconceptions arising from this paper. The first is that this paper demonstrates that water vapor is the major driver of global temperatures. In fact, what this paper shows is the effect from stratospheric water vapor contributes a fraction of the temperature change imposed from man-made greenhouse gases. While the stratospheric water vapor is not insignificant, it's hardly the dominant driver of climate being portrayed by some blogs.

The other misinterpretation is that this paper proves negative feedback that cancels out global warming. As we've just seen, the magnitude of the effect is small compared to the overall global warming trend. The paper doesn't draw any conclusions regarding cause, stating that it's not clear whether the water vapor changes are caused by a climate feedback or decadal variability (eg - linked to El Nino Southern Oscillation). The radiative forcing changes (Figure 3 above) indicate that the overall effect from stratospheric water vapor is that of warming. The cooling period consists of a stepwise drop around 2000 followed by a resumption of the warming effect. This seems to speak against the possibility of a negative feedback.

0 0

Printable Version  |  Link to this page

Comments

Prev  1  2  

Comments 51 to 79 out of 79:

  1. Marcus: "First off there has been *no cooling* for the last 10 years, just a slower rate of warming than what we saw between 1980-1999." And it's great that Solomon's paper advances a possible explanation for this. Beyond Solomon, there is no identified mechanism to explain why the Earth should appear to have undergone cooling during the past decade. More, for that matter there is not even a means to explain a slowdown in warming of the size we've seen, not one on which anybody's prepared to stake their reputation. Solomon explains perhaps 25% of the budget problem, leaving a hole that while not a complete mystery is not actually attributable on a quantified basis to any of several possible candidates. Consider for a moment that the first 3 meters of the ocean contains as much heat energy as the entire atmosphere, that the ocean has an average depth of some 3,800 meters, with the vast bulk of that water exchanging heat with the atmosphere as well as directly absorbing much larger amounts from insolation at greater or lesser rates. The upper 90m of ocean alone introduces potentially years of delay for measurable surface temperature changes in response to forcings. Now remember that our ability to measure ocean heat content is patchy while our understanding of the movement of heat into the oceans particularly as water and heat goes deeper via thermohaline circulation is by no means perfect. We can't say on an annual basis or even over a number of years how much energy the ocean will suck up in a way that keeps the ever-so-wispy atmosphere cooler than it would be without the ocean sink. We obsess about surface temperatures while in point of fact a miniscule fraction of the energy imbalance predicted by climate science is actually available for measurement at the surface. Most of the energy is going into the ocean, at greater or less rates over time, where it may be hidden for greater or lesser periods of time. I don't think anybody with common sense and a scientific reputation to protect will make a firm prediction about the ocean heat sponge vis-a-vis the past decade in the absence of more actual data. I have neither common sense nor a reputation, so I'll say that in years to come we'll likely find there was little total change in the radiative budget during the past decade and that instead this heat has been temporarily "lost" in the ocean. More on ocean: http://www.oco.noaa.gov/index.jsp?show_page=page_roc.jsp&nav=universal
    0 0
  2. Marcus I wrote... "For this reason, it is unlikely for a non skeptic to look for such a correlation, and that any detectible change would have to be coming from natural forcings" then you wrote... "this slower warming rate occurred against a backdrop of a significant drop in Total Solar Irradiance-to levels unseen in over a century" And I cant prove it, but I also KNEW somebody would reply with something like that about China & India. You cant have it both ways. Either it helps to cut back on fossil fuel consumption or it doesnt. The world is never going to get there if everyone is thinking, "well I cant stop this because someone in China is now polluting in my stead", or visa versa. Similarly, it is counterproductive in terms of global morale to be concerned with what the Sun is doing. I cant believe me the skeptic is saying this, but maybe the science behind all this will need to be censored in order to achieve the desired goals.
    0 0
  3. to doug_bostrom "I have neither common sense nor a reputation" ...give yourself more credit. Your reasoning is superb. One of the nice things about having anonymity, as on this site, is that ideas can be shared without fear of damage to reputations. Personally, for a question as large as global survival, its hard to understand how that can even be a priority. At any rate, I believe the truth ultimately "speaks for itself" and will lead humanity in the right direction. But then again, a lot of opportunists will be found along the way.
    0 0
  4. guys, could you show me a single serious application of the so called "Standard Normal Homogeneity Test" (SNHT) outside climate science? Anyone?
    0 0
  5. Ber�nyi P�ter at 07:16 AM on 5 February, 2010 "could you show me a single serious application of the so called "Standard Normal Homogeneity Test" No. Now, let me ask you a question: Can you show me an example of a cylinder compression test used outside of internal combustion engine maintenance? No? Why not? Because it's a technique used for a specific, narrow range of inquiry. Does that mean it has no value? No, again. Lots of "no" here. Learn more about the "Standard Normal Homogeneity Test" here: http://scholar.google.com/scholar?start=60&q=%22Standard+Normal+Homogeneity+Test%22&hl=en&as_sdt=100000000000000
    0 0
  6. RSVP, I was merely saying that a fall in industrial output is *not* the reason for the slower rate of climate change over the last decade, because I've seen no evidence that industrial output *has* fallen. The drop in SWV & TSI are far more likely explanations for the slower rate of warming. Trust me, I am *not* one of those people that goes around saying "we shouldn't do anything about pollution because is just going to fill the gap". Indeed, I really *hate* these people as the cop-outs they are. In truth, China & India are already doing significantly more to reduce their pollution levels-per capita-than what most Western Nations are (with the possible exception of Northern Europe). Hope that clears things up!
    0 0
  7. doug_bostrom at 07:35 AM on 5 February, 2010 'Lots of "no" here' I know what SNHT is supposed to be, even if I've never heard of a Standard Cylinder Compression Test. However, if there is such a thing, it makes sense to test any kind of cylinder the same way which should endure high pressure, not just those in combustion engines, e.g. hydraulic cylinders come to mind. If SNHT is a valid statistical procedure, it should make sense to apply it to time series analysis in general, not just climate data. The definition itself is rather formal, never mentioning climate. It is a plain a mathematical procedure. Could you kindly explain why one should not apply it to mortality data? Of course it would be rather easy to get rid of plagues this way, but that's exactly the point.
    0 0
  8. Berényi Péter at 09:38 AM on 5 February, 2010 "I know what SNHT is supposed to be, even if I've never heard of a Standard Cylinder Compression Test. However, if there is such a thing, it makes sense to test any kind of cylinder the same way which should endure high pressure, not just those in combustion engines, e.g. hydraulic cylinders come to mind." Hah! The second I hit "submit" I knew I'd been insufficiently specific. The point I was trying so foolishly to make is that certain tests are going to be confined in utility to narrow ranges and types of inquiry and that by itself should not and does not mean they are invalid. The specific test I was referring to was one where an IC engine crank and camshaft are rotated such that valves are closed and the cylinder under test is at top of travel. All cylinders in that state should yield reasonably similar pressure readings and should hold that pressure for similar periods of time, all those readings should be within a specification range. This test is an excellent diagnostic for IC engine cylinder wear, would be inapplicable to most other machinery but is nonetheless very valuable as well as uncontroversial. The test you were referring to is used to process not only temperature but also other meteorological readings such as precipitation gathered from multiple sites. It's going to be of no utility in many other fields. It also does not appear to be controversial. I'm not an expert, obviously. Was there some specific issue with that treatment that bothers you?
    0 0
  9. doug_bostrom at 18:09 PM on 5 February, 2010: "Was there some specific issue with that treatment that bothers you?" Yes, definitely. Just google for "sandpile avalanche dynamics". Highly nonlinear, self-organized sytems (like climate/weather) often show this kind of intermittent behavior. The sloppy phrase used by mainstream climate science to identify phenomena like this is "natural variability". Now. Take a simple sandpile model, generate pile weight time series, apply SNHT and you are left with an ever growing sandpile. The Solomon event is likely just a major "avalanche" among many others, happening all the time on all scales.
    0 0
  10. Ber�nyi P�ter at 20:43 PM on 5 February, 2010 "The Solomon event is likely just a major "avalanche" among many others, happening all the time on all scales." To make a case for that you need to show it with details. Simply saying "look, this test is only used in this field, therefore I'm suspicious of its validity" is not a case, it's sheer speculation. I know from other things you've written here that you can do better.
    0 0
  11. @ doug_bostrom, 51 I really appreciate that you raise those questions, and I think you give important elements of possible answers. I'll try to expand a little, very speculatively, as I'm a merry amateur in this field. First, the ENSO events aren't just simple breathing in and out of ocean heat. Surely, lots of the heat released during an ElNino was stored during LaNina conditions, but LaNina will often be associated with "impaired" radiation balance, cloud conditions effectively increasing albedo etc. Therefore, the energy uptake can be much smaller than average during strong LaNinas - you can get an indication of this if you look at sea level rise during the last years - it has continued at constant or somewhat falling surface temperatures, but more slowly. Indicating continous ocean heat uptake, but at a reduced rate. On the other hand, in ElNinos, it seems that radiation imbalance may actually increase, in spite of hotter conditions. That may lead to a temperature increase beyond what is "supported" by the normal conditions, and temperatures fall after the episode. Not because of negative radiative balance, heat still accumulates these days, but - I think we may formulate it this way - because of _less positive feedback_. In addition to ENSO events, Mojib Latif has pointed to a ca 60 yr cycle in the NH, and the rapid temperature increase 1980-2000 may in part come from this, maybe 0.05-0.1 degC/decade. And we have the solar cycles accounting for maybe 0.1 degC. Putting all this together, I think we may have a reasonably good explanation of the events of the last 10-15 years. Maybe more deterministically inclined people dislike the variability in feedbacks - but this I think is a fact of life in climate. I interpret the changes in stratospheric water vapor content discussed here as an important example of such variable feedbacks. It has been observed once, and I can't understand why it should not happen, over and over again. And with increased energy content of the troposphere, we might expect more of it, as it seems mainly to be an effect of that, to a lesser extent of CH4 degradation.
    0 0
  12. SNRatio at 09:02 AM on 6 February, 2010 Thanks! I've only been looking seriously at this whole topic (climate change) for a few months but have already been spiraling toward the ocean because it's -so- bulky, so loaded with thermal inertia yet ineluctably a big influence on us air breathers and our climate. The energy quantities in the ocean are just staggeringly large, compared to the atmosphere. Over on RC a favorite skeptic and I were comparing notes on the amount of additional energy flowing into the Arctic ocean due to the ice anomaly there. His figure was more realistic than mine, I think, a "mere" 40TW of additional juice pouring into the ocean on a typical summer day. I think the actual power level would be a bit larger than that if the the numbers were done rigorously, but all the same we found ourselves agreeing on how these numbers are so large they entirely exceed our intuitive grasp. And the ocean sucks up this energy without batting an eye, at least over the short term. Remarkable. I'm curious to know what'll happen over the long term in the Arctic; thermohaline circulation is obviously dependent on Arctic ocean temperature. Meanwhile, just like everything else in nature there's likely little or no "overengineering" in the way the present circulation works, it's more something that's converged on some sort of quasi-stable behavior. A little sneeze from the ocean can mean a lot up here.
    0 0
  13. doug_bostrom at 04:26 AM on 6 February, 2010 "To make a case for that you need to show it with details" OK. Self Organized Criticality (SOC) describes the Climate/Weather system's state well. It is a non equilibrium thermodynamic system with a huge input stream of exergy. Sandpile Avalanche Dynamics is a simple (understandable) conceptual model of such systems. There is a table on a digital scale which records the weight as a time series. A container above, with a tiny hole on the bottom is full of dry sand. The sand slowly piles up on the table. As soon as the pile gets too steep, some sand shifts down to the bottom in an avalanche. Sooner or later the table gets "saturated", avalances go over the edge, sand sprays to the floor. It is swept up and put back to the container. The sytem gets into a "steady state", the weight fluctuates around an equilibrium value. However, the statistics of the time series is far from trivial. One has avalanches of all sizes, small and large, the magnitude distribution following a power law. Epochs of gradual increase are followed by sudden drops of variable size. If you apply "Standard Normal Homogeneity Test" (SNTH), identify discontinuities, adjust time series accordingly, you are left with an ever increasing sandpile on the table, defying common sense. The reason is that dynamics is not symmetric to time reversal. In this respect it is same as climate. Detailed enough?
    0 0
  14. Berényi Péter at 03:45 AM on 9 February, 2010 That's a fascinating experiment and one I think would be fun to do with my son. Changing some of the properties and watching what happens to the distribution would be pretty interesting. But the system you describe is in equilibrium; the aperture the sand is passing through is constant, the gravitation is constant, the granule size is constant. How does it apply to the case under discussion here? I don't follow the analogy but it could be I'm just dense.
    0 0
  15. Solomon et al state: "However, the trend in global surface temperature has been nearly flat since the late 1990's despite continuing increases in the forcing due to the sum of the well-mixed greenhouse gases (CO2, CH4, halocarbons, and N2O), raising questions regarding the understanding of forced climate change." The mean temperature increments (relative to the reference level) were: +0.46 deg C for '95-99 +0.57 deg C for '00-04 +0.68 deg C for '05-09 The rate of change was not "nearly flat".
    0 0
  16. doug_bostrom at 04:37 AM on 9 February, 2010: "How does it apply to the case under discussion here?" Basically the climate system is also in a kind of equilibrium. It is not the same as thermodynamic equilibrium though, it requires exergy stream to be maintained (like sandstream in case of SAD). Equilibria like this are called steady state. With no sun, atmospheric temperature would drop below -230°C, collapsing it into a 10 m thick frozen layer. No climate at all. Systems like the sandpile are inclined to accumulate energy slowly, then release it in sudden bursts of varying magnitude. Kind of negative feedback, not the usual way, nonlocality in phase space. Bubbles in boiling water behave the same way. Abrupt energy concentration followed by gradual release seldom occur. Statistics of state variables lack time reversal symmetry, time series have skewed fractal structure. Energy release connected to topological reconfiguration. "Natural variability" In absence of metadata, actual jumps can be misidentified as instrumental slithers, by data homogenization spurious trend is introduced. Solomon event likely one major slip, global troposphere fold perhaps, many more can occur on all spatio-temporal scales. Sandpile Avalanche Dynamics with local positive feedback, i.e. the larger the pile gets the wider the slit on container opens, makes time series more even, counterintuitively. Multiscale dynamics is poorly captured by analytic models with fixed grid resolution. Ad hoc parametrization does not make it sound.
    0 0
  17. Berényi Péter at 08:59 AM on 9 February, 2010 Ok, I think I see what you're saying, key: 'Statistics of state variables lack time reversal symmetry, time series have skewed fractal structure. Energy release connected to topological reconfiguration. "Natural variability"' So just to clarify, are you saying that all of the temperature signal displayed by the collective global measurement system is being affected by residing in the mid-domain of a single overarching slip event?
    0 0
  18. doug_bostrom at 09:08 AM on 9 February, 2010: "all of the temperature signal displayed by the collective global measurement system is being affected by residing in the mid-domain of a single overarching slip event?" No. It is not just about surface temperatures, but all state variables of climate system, upper tropospheric specific humidity included. And not a single slip, but slips of a wide variety of magnitude distributed over all spatio-temporal scales. Present data homogenization techniques tend to identify some of these as results of undocumented instrumental changes and remove them from the record by adjusting data on either side of the "discontinuity", while in fact they are real jumps, parts of a climate feedback loop. Since the underlying dynamics is not time-symmetric, this procedure necessarily introduces a spurious trend. This is why time series "homogenized" by time symmetric statistical operators cannot be trusted. Of course there may be _some_ actual undocumented changes in instrumentation, so raw data should also be handled with care. But if the great majority of adjustments are in one direction (as it happens all the time with mainstram data torture), it is most probably due to this conceptual bias.
    0 0
  19. Berényi Péter, you representation of how undocumented jumps are corrected for is inaccurate, they do not just trivially get rid of them by shifting the data on one side of the jump whenever one shows up at a single station. You should also be aware that the corrections made to the raw readings can be up or down, globally they average to zero.
    0 0
  20. Looking at figure 3, it seems to me that the slight dip in forcing due to changes in stratospheric water vapor may explain the perceived lack of global temperature rise just after 2000. In the case such an explanation is viable, it would actually strengthen the case for antropogenic global warming. (but in reality I guess it's more complex than that.)
    0 0
  21. Berényi Péter at 21:33 PM on 9 February, 2010 I don't find your argument persuasive, though as always you've provided me some enlightenment on things I might never have known. Thank you.
    0 0
  22. Riccardo at 22:59 PM on 9 February, 2010: "corrections made to the raw readings can be up or down, globally they average to zero" No, they are not. At least in case of surface station temperatures and upper troposphere radiosonde humidity there are considerably more upward adjustments than downward ones.
    0 0
  23. Berenyi Peter, here is the graph or you may like to read the whole procedure
    0 0
  24. Berényi Péter at 09:28 AM on 10 February, 2010 "At least in case of surface station temperatures and upper troposphere radiosonde humidity there are considerably more upward adjustments than downward ones." Assuming your assertion about the distribution of individual adjustments is correct, that begs a another question: are more recent records adjusted upward more than older measurements, and as we approach the present do upward adjustments grow still more than all earlier ones? If not, or that is to say unless the adjustments can be shown to produce the trend we believe we see, looking to adjustments of measurements(temperature, tide, whatever) does not have explanatory power for upward trends. To put it another way, if all records through time are adjusted upward by a similar amount, no false upward trend will result. The modern,climate specific term for this pitfall might be termed "Watts' Fallacy".
    0 0
  25. BP, your last statement seems to imply that you're refering to a scientific, detailed analysis of the adjustments, can you give us the reference(s)?
    0 0
  26. #73. Riccardo at 09:47 AM on 10 February, 2010 "here is the graph" Wow. I still have to look into the details. Any idea why the number of surface stations in GHCN dropped so dramatically from its 1970 peak value of 9403 to a feeble 1137 in this year? Looks like 88% of the stations are lost. This is the smallest number in the last 120 years. $ wget http://www1.ncdc.noaa.gov/pub/data/ghcn/v2/v2.mean.Z $ gunzip -c v2.mean.Z | cut -c13-16 | sort | uniq -c
    0 0
  27. Berényi Péter at 02:19 AM on 11 February, 2010 Here's a paper with a fairly comprehensive description of modern methods: Improvements to NOAA’s Historical Merged Land-Ocean Surface Temperature Analysis (1880-2006) Older but with some digestive aids: An Overview of the Global Historical Climatology Network Temperature Database
    0 0
  28. Berényi Péter, check your maximum number of stations, it's different from the list of stations of the v2 dataset.
    0 0
  29. The oxidation of methane occurs mostly in the troposphere with a lifetime of ~ 5 years. However, this is not complete, and some leaks into the stratosphere. Methane in the stratosphere is the source of much of the water vapor there, since little can get through the cold trap at the tropopause. It is correct to say that methane oxidation in the stratosphere is the source of the additional water vapor there. It is not correct to say that methane oxidation occurs mostly in the stratosphere
    0 0

Prev  1  2  

You need to be logged in to post a comment. Login via the left margin or if you're new, register here.


The Consensus Project Website

THE ESCALATOR

(free to republish)


© Copyright 2024 John Cook
Home | Translations | About Us | Privacy | Contact Us