Climate Science Glossary

Term Lookup

Enter a term in the search box to find its definition.

Settings

Use the controls in the far right panel to increase or decrease the number of terms automatically displayed (or to completely turn that feature off).

Term Lookup

Settings


All IPCC definitions taken from Climate Change 2007: The Physical Science Basis. Working Group I Contribution to the Fourth Assessment Report of the Intergovernmental Panel on Climate Change, Annex I, Glossary, pp. 941-954. Cambridge University Press.

Home Arguments Software Resources Comments The Consensus Project Translations About Support

Twitter Facebook YouTube Mastodon MeWe

RSS Posts RSS Comments Email Subscribe


Climate's changed before
It's the sun
It's not bad
There is no consensus
It's cooling
Models are unreliable
Temp record is unreliable
Animals and plants can adapt
It hasn't warmed since 1998
Antarctica is gaining ice
View All Arguments...


Username
Password
New? Register here
Forgot your password?

Latest Posts

Archives

Is the airborne fraction of anthropogenic CO2 emissions increasing?

Posted on 31 December 2009 by John Cook

The 'airborne fraction' refers to the amount of human CO2 emissions remaining in the atmosphere. Approximately 43% of our CO2 emissions stay in the atmosphere with the rest being absorbed by carbon sinks. But is the airborne fraction increasing? A paper published in November 2009 found no statistically significant trend (Knorr 2009). Anthony Watts labeled this result the "Bombshell from Bristol" - A potentially devastating result for anthropogenic global warming. Was it such a shock? The 2007 IPCC verdict on the airborne fraction was "There is yet no statistically significant trend in the CO2 growth rate since 1958 .... This 'airborne fraction' has shown little variation over this period." (IPCC AR4) I'm not sure the move from "not much happening" "to "still not much happening" warrants the label "bombshell".

The airborne fraction is calculated from the rate of human CO2 emissions and changes in atmospheric CO2 concentration. The global increase in atmospheric CO2 has been directly measured since 1959 and can be calculated from ice cores for earlier periods. Primarily, CO2 emissions come from fossil fuel combustion with a lesser contribution from land use changes. Fossil fuel combustion is calculated from international energy statistics. CO2 emissions from land-use changes are more difficult to estimate and come with greater uncertainty. Land use emissions are estimated using deforestation and other land-use data, fire observations from space and carbon cycle modeling.

There have been several recent studies determining the airborne fraction. Trends in the sources and sinks of carbon dioxide (Le Quere 2009) examines the airborne fraction from 1959 to 2008. This period was chosen as we have directly measured atmospheric CO2 levels over this time. Fossil fuel emissions rose steadily in recent decades, contributing 8.7 ± 0.5 gigatonnes of carbon in 2008. This is 41% greater than fossil fuel emissions in 1990. CO2 emissions from land use was estimated at 1.2 ± 0.4 gigatonnes of carbon in 2008. Note the proportionally higher uncertainty compared to fossil fuel emissions.

Over this period, an average of 43% of each year's CO2 emissions remained in the atmosphere although there is much year-to-year variability. The noise in the airborne fraction was reduced by removing the variability associated with El Nino Southern Oscillation (ENSO) and volcanic activity. They found the airborne fraction increased by 3 ± 2% per decade. This is a slightly increasing trend although only barely statistically significant .

Knorr 2009 extends this analysis back to 1850 by combining direct CO2 measurements from Mauna Loa and the South Pole with CO2 data derived from Antarctic ice cores. This enabled Knorr to compare CO2 emissions to atmospheric CO2 levels for the past 150 years.


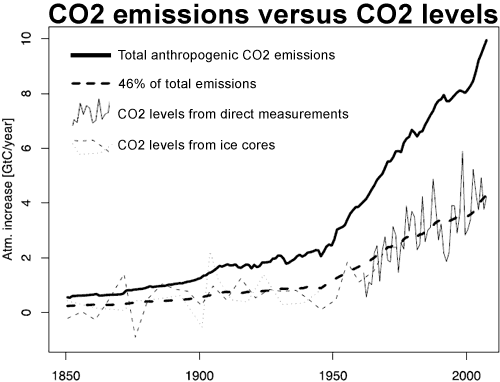
Figure 1: Observed increase atmospheric CO2 derived from direct measurements, taking the average of Mauna Loa (Hawaii) and the South Pole (thin solid line) and two ice cores: Law Dome (dashed thin line) and Siple (thin dotted line). This is compared to total anthropogenic emissions (thick solid line) and 46% of total emissions (thick dashed line). (Knorr 2009)

Knorr finds that since 1850, the airborne fraction has eemained relatively constant. When CO2emissions were low, the amount of CO2absorbed by natural carbon sinks was correspondingly low. As human CO2 emissions sharply increased in the 20th Century, the amount absorbed by nature increased correspondingly. The airborne fraction remained level at around 43%. The trend since 1850 is found to be 0.7 ± 1.4% per decade.

There are several differences in methodology between Knorr 2009 and Le Quere 2009. Knorr's result does not include the filtering for ENSO and volcanic activity employed by Le Quéré. However, when Knorr does include this filtering in his analysis, he finds a trend of 1.2 ± 0.9% per decade. This is smaller than Le Quere's result but is statistically significant.

Knorr also finds the 150 year trend while Le Quéré looks at the last 50 years. This may be significant. If the airborne fraction is increasing, it is possibly a recent phenomenon due to natural carbon sinks losing their absorption ability after becoming saturated. Several studies have found recent drops in the uptake of CO2 by oceans (Le Quere 2007, Schuster 2007, Park 2008). However, with such a noisy signal, this is one question that will require more data before being more fully resolved.

Lastly, some perspective. There are still areas of uncertainty associated with the carbon cycle. Because of this uncertainty, scientists are currently debating whether the airborne fraction is steady at 43% or slightly Increasing from 43%. Unfortunately, some skeptics use this uncertainty to hold the position that the airborne fraction is closer to 0%.

0 0

Printable Version  |  Link to this page

Comments

Prev  1  2  

Comments 51 to 85 out of 85:

  1. TerryG, do not make the mistake made by ralphiegm, not any kind of pollutant, molecule or particulate behave the same. It is well known that the global circulation tends to separate the two emispheres, but it changes with season and it's not "perfect". If you have a very stable (chemically inactive) and long lived specie it will first mix vertically through the whole troposphere (and beyond) and then mixes globally in the atmosphere. You may also notice that the seasonal cycle is much less pronounced in the southern emisphere; this is because there's much less land (vegetation) and there's no enough time for the northern emisphere CO2 to mix. So it's just a matter of giving the CO2 time to mix and it will.
    0 0
  2. ralphiegm, you have local and global mesurements; you also have the physics and simulations that match the experimental data locally and globally (by the way, not all natural systems are too complicated to be described quantitatively). Putting completely arbitrary minimum requirements to belive in the data indicates that you simply (and dogmatically) do not want to. It's ok for me, your choice. But do not pretend to judge thousands of (irresponsible ..) scientists (and many more common people) on this basis.
    0 0
  3. Riccardo -I think that CO2 ranges from 250 to 425 ppm globally based on the literature. So it is amazing that (some) climate scientists are in a panic over this issue.
    0 0
  4. Ralpiegem, can you please explain where the CO2 comes from so that its concentration doubles in the very short periods of time shown in Beck's paper. Also, please tell me where it suddenly disappears to after it reaches its high points. The paper you are using is nothing but garbage, and what is worse, if you are an engineer as you have stated, you probably know it is garbage but will use it to support your denier claims.
    0 0
  5. Ian - I am using numbers taken from a variety of sources. I have no wish to support or diminish this Beck fellow. Jeez - Is the only purpose for this site to squeeze out verbal revenge against skeptics? As to the content of my post which is really the only point I care about - atmospheric CO2 appears to range from 250 to 425 ppm. Is that data wrong too? Where does the CO2 go you ask? - it blows away in the wind - which, sadly, I have yet to see a climate model account for (wind that is).
    0 0
  6. RE# ralphiegm You stated earlier (post 31) that you didn't trust that satellites actually measured CO2. Well they do. GOSAT is a Japanese one launched recently that has amongst other things a Fourier Transform Spectrograph. And if you don't trust the validity/accuracy of spectroscopy, then you can throw out most of atomic physics, astrophysics for the last 50 years or so. Look at the references here for more info on the satellite's specs: http://en.wikipedia.org/wiki/Greenhouse_Gases_Observing_Satellite My Japanese isnt too good but in the brochure it lists the satellite with the ability to measure over 56,000 data points. Not quite the zillion that you expect the poor scientists to deliver but if you can't accept that this is good enough then you are wasting everyone's time. GOSAT: Greenhouse Gases Observing Satellite "IBUKI" http://www.jaxa.jp/pr/brochure/pdf/04/sat02.pdf Also, preliminary results have already been released that show CO2 is within the range of 360 to 390 ppm. Initial Analysis of Observation Data from GOSAT http://www.gosat.nies.go.jp/eng/result/download/GOSAT_L2_20090528_en.pdf When scientists talk about considerable variation in the atmosphere it is on the order of 3ppm not the crazy numbers you seem to be claiming. Aircraft observation of carbon dioxide at 8–13 km altitude over the western Pacific from 1993 to 1999 http://www3.interscience.wiley.com/journal/118916481/abstract?CRETRY=1&SRETRY=0
    0 0
  7. ralphiegm: "I am using numbers taken from a variety of sources". Care to share those "sources" with us so we can see how reliable they are? You cannot have the variation of a well mixed gas (100% miscible, yes gases are all 100% miscible) with those kind of variations. Of course, if your sources are taking samples from the top of a chimney then they will show higher results than the global average. However, that would not be considered science.
    0 0
  8. "Where does the CO2 go you ask? - it blows away in the wind - which, sadly, I have yet to see a climate model account for (wind that is)." I'll bite, Ralph. How many model sources have you read (I know you haven't read the Hadley Centre's, theirs is proprietary ...) My guess is you haven't seen a climate model account for anything because you've not studied a single climate model.
    0 0
  9. Yocta - As you may know satellites do not measure CO2. They try to measure CO2 but must be calibrated from - you guessed it - ground stations. And there is no "global" data back from those satellites yet. So how can you use that argument against my position? You make it seem as though all these climate scientists have accurate satellite data on CO2 for years. But the satellites were launched just a year or so ago and are barely working even today. And the American satellite crashed after launch. So what are they climate scientists using for CO2 data?
    0 0
  10. dhogaza - I am not aware of a model that accounts for wind but maybe there is one out there. I have never seen wind, clouds or air turbulence mentioned in any of the many papers I have read on climate studies. I could be wrong but if you can point out to me that someone, somewhere has considered wind in their model I would happily read about such a model and report back to you - if you can find one. Good luck trying - I gave up looking. And the reason why wind is not considered is the same reason why clouds are not considered in climate models - it's beyond human ability to model the world. Its just too complicated.
    0 0
  11. In keeping with the site’s ethos I’ll make sure to keep to the science in my comments. RE:# Ralphiegm commment 59 ralphiegm: And there is no "global" data back from those satellites yet. So how can you use that argument against my position? I am bringing to your attention that there are satellites launched with the primary purpose to measure and map CO2 more effectively, and, as a bonus, the measurements it has performed are consistent with what is known of the atmosphere. ralphiegm: You make it seem as though all these climate scientists have accurate satellite data on CO2 for years. NASAs Aqua satellite launched in 2002 has an Atmospheric Infrared Sensor onboard. This is one of 6 instruments on board the satellite but given it is a highly accurate infrared spectrograph it makes a very handy tool for measuring CO2 concentrations in the atmosphere, and I believe across different altitudes. Just because the satellite wasn’t primarily designed to measure CO2 concentrations (like GOSAT and the unfortunate NASA one that crashed) doesn’t make it ineffective at all or mean that climate scientists have never had satellite data to use. AIRS http://airs.jpl.nasa.gov/AIRS_CO2_Data/About_AIRS_CO2_Data/ See John’s post on how the earlier IRIS satellite from 1970 and the Japanese IMG Satellite in 1996 was used in comparison with AIRS. There is also a good paper that discusses the results (Harries 2001). http://www.skepticalscience.com/empirical-evidence-for-global-warming.htm ralphiegm : As you may know satellites do not measure CO2. They try to measure CO2 but must be calibrated from - you guessed it - ground stations. This is where I am confused by what you mean. AIRS has a spectrograph on board. It measures the spectrum of CO2 directly and hence the concentration. It was calibrated prior to its flight through the National Institute of Standards and Technology (NIST) which in metrology is the appropriate thing to do. Prelaunch and in-flight radiometric calibration of the Atmospheric Infrared Sounder (AIRS) http://ieeexplore.ieee.org/xpls/abs_all.jsp?arnumber=1196044&tag=1 I am assuming when you say ground stations you mean ones that are used already to measure atmospheric CO2. Please tell me (with links perhaps) as to why you believe the Satellite data is calibrated from ground stations?
    0 0
  12. "What AIRS does is measure the infrared light emitted by carbon dioxide molecules. Carbon dioxide in the air absorbs infrared emitted by the surface, and then re-radiates it at a slightly lower energy level (which is why it acts as a greenhouse gas). The exact frequency that gets emitted depends on temperature. So Chahine can take the infrared data AIRS sends back to Earth and use a mathematical inversion process to turn it into temperatures." I think the above quote from the NASA website http://airs.jpl.nasa.gov/story_archive/Measuring_CO2_from_Space/Measurement_to_Science/ explains my concern. This device is not measuring CO2 - it is measuring infrared light and "calibrating" it in the lab back on earth, which I assume, is a ground station (what else could it be?) In fact, NASA is trying to send more satellites up to see if they can measure CO2 - if the AIRS was so good why do we need another one? My guess because it is not so good. You imply the device is a spectrograph but it sounds like something else - but whatever it is - it would take some fancy calibrating to assure me that it is reading accurately the CO2 variations in the air column or reading the total weight of CO2 in the air column.
    0 0
  13. Ralphiegm said:
    This device is not measuring CO2 - it is measuring infrared light and "calibrating" it in the lab back on earth.
    So you don't believe in liquid in glass thermometers since they don't measure "temperature" but measure changes in volume of a liquid which are then "calibrated in the lab"? You have obviously never worked in, or have knowledge of what goes on in an analytical lab. Nothing actually measures what they are reporting but measure some proxy which is then, through calibration and running of standards, converted to actual measurement of the material in question.
    0 0
  14. Ii don't understand how 200 or 300 stations are not enough to show whether CO2 is evenly mixed. If that many stations, located around the world, show consistency over time, what is the likelihood that another station, or another million stations, will show mixing, or any kind of inconsistent distribution? Furthermore, if you want me to accept clouds as an appropriate comparison, you will have to explain to me how the stationary stations do not show significant variation over any time period. You know,the way my eyes measure the presence of clouds in the morning, and their absence in the afternoon, although i have hardly changed my position? Soory, if there was any significant mixing, and wind effect, even a single station could reveal that.
    0 0
  15. Ian - if you check how a satellite measures CO2 you will begin to see the pitfalls: Clouds, ground reflections, wind, water vapor, atmospheric pressure, strata, turbulence, aerosols. It is not perfected by any stretch. And since the clouds appear more frequently over the southern hemi and the ocean the CO2 from those areas are not as well represented. I think the current data is too weak to make sweeping judgments about the fate of the planet. And Gordon - the 200 ground stations actually represent 1 million square miles of area per ground station. And that is just one strata. That may be enough data for you but NASA thinks we need a lot more CO2 data and so do I (they are trying to get a new satellite up there that works - and new data coming soon anticipates that the atmosphere is not well mixed at all - as I have said). Some folks wanna jump the gun on CO2 - I'd rather wait until there was real data synched with temperature and land use. What's the hurry? Gordon -
    0 0
  16. Ian - as to your thermometer analogy - try reading the thing 830 miles away with an infrared detector.
    0 0
  17. RE: ralphiegm post 62 The same historical article you referenced continues to chart the need for future satellites to complement and add to the existing data away from the middle troposphere not because AIRS is no good. ralphiegm:...This device is not measuring CO2 - it is measuring infrared light and "calibrating" it in the lab back on earth... By “ground station” I am to understand that you just mean it as a place to process the raw data downloaded from the satellite. The AIRS people are not calibrating the data with anything. The mixing ratio of trace gases in the atmosphere is directly calculated from the data from the AIRS data (Chahine et al 2006 page 921) . This is then checked against other independent detection systems including a ground based FTR and aircraft flask measurements. This paper also links to the details of how the mixing ratios are calculated from specta, and links to others (i’m hoping you have access?) Chahine et al 2006 http://trs-new.jpl.nasa.gov/dspace/bitstream/2014/40298/1/05-0324.pdf ralphiegm:...You imply the device is a spectrograph...fancy calibrating. It is a spectrograph and it happens to be sensitive to IR radiation. It doesn’t matter if it is 830 miles away as long as it has a lens capable of resolving it at that distance (think Hubble or other IR astronomical devices that can measure spectra from interplanetary bodies). It has been pre-calibrated on earth by NIST, which is about as fancy as you can get. Then the accuracy and sensitivity was tested again to better than 1 part in 105 and is tested regularly for drift and long term stability whilst in flight. The only calibration is done on the equipment before flight. Chahine et al 2006 continue to state: The radiometric accuracy and stability of AIRS radiances has been confirmed by several fundamentally different types of comparisons, including 1) the results of the daily measurements of sea surface temperature (SST), 2) direct spectral radiance comparisons from aircraft observations, and 3) low temperature surface radiances from Antarctica. This paper is pretty good, it also deals with the cloud cover issue you were raising.
    0 0
  18. "Significant Findings from AIRS Data 'Carbon dioxide is not homogeneous in the mid-troposphere; previously it was thought to be well-mixed 'The distribution of carbon dioxide in the mid-troposphere is strongly influenced by large-scale circulations such as the mid-latitude jet streams and by synoptic weather systems, most notably in the summer hemisphere 'There are significant differences between simulated and observed CO2 abundance outside of the tropics, raising questions about the transport pathways between the lower and upper troposphere in current models 'Zonal transport in the southern hemisphere shows the complexity of its carbon cycle and needs further study" Yocta - I have been saying that CO2 is not well mixed in the atmosphere. I have been getting rebuked here for that position. But the AIRS scientists agree with me judging from their notes I pasted above. I expect that after many, many years of this remote sensing we may finally find get a handle on the global mass of CO2 and whether it is actually rising over time. I am happy to wait till the data is perfected.
    0 0
  19. I see what you are getting at...but what you are talking about doesn't discredit at all that atmospheric CO2 concentrations have been increasing in recent years or our ability to detect it. The NASA AIRS CO2 map which on the scale had it from about 364 to 382 ppm showed the distribution of the CO2 in the atmosphere at a particular date. I only just saw this but it is pretty amazing. The variation that got climate scientists so excited is only of the order of 1% in the "concentration of mid-tropospheric carbon dioxide". (I myself would have been frowning if it was on the order of 20% as long term trends would be difficult to compare,but it is not) Watch the video here over different months: http://svs.gsfc.nasa.gov/vis/a000000/a003500/a003562/index.html You are correct in asserting that CO2 is not as well mixed in the atmosphere as previously thought (1%variation) but I cannot see how you would infer that the satellite measurements are unreliable, or discredit the long term trends in atmospheric CO2 concentrations. Chahine et al 2008 has used the satellite derived CO2 data track weather patterns. Which is fantastic as we see an even better picture of how CO2 moves around the globe through sources and sinks and "mixes" as other people have been saying! Satellite remote sounding of mid-tropospheric CO2 Chahine et al 2008 http://www.ess.uci.edu/~jranders/Paperpdfs/2008GRLChahineetalAIRSCO2.pdf
    0 0
  20. I'm sure ralphiegm very well knows that almost all the instruments around the world need to be calibrated, just a few exception. As an engeneer he's also able to read a graph and understand the meaning of numbers and he also knows that almost all measurements are indirect throgh some physical effect. There's more in what he say that is contradictory but just this shows that he's trying to fool people. This site is to talk about science and there's no point to discuss with one with such an attitude; WUWT would be a better choice.
    0 0
  21. The network of in-situ CO2 measurement stations ( http://gaw.kishou.go.jp/wdcgg/ ) provides a good record of global and coarse-scale variation in atmospheric CO2 over time. Satellite measurements provide information on finer spatial scale (regional) variation in CO2 over time. There really is no question about any of the following three statements: (a) human activities (fossil fuels and land use) are adding CO2 to the atmosphere, (b) natural biogeochemical sinks are removing some but not all of that excess CO2 from the atmosphere, and (c) because only a fraction of the anthropogenic CO2 emissions are removed, the CO2 concentration in the atmosphere is increasing over time. All of this is very well understood, and not even remotely controversial. With all due respect, the comments made in this thread by ralphiegm give a quite misleading picture of uncertainty in an area where no such uncertainty exists. [If he/she has been relying on the work of EG Beck, that is quite understandable....]
    0 0
  22. I concur Ned. Ralph's comments about CO2 varying by +/- 200ppm sound very reminiscent of the results of the Beck "paper". Ralph's coyness about his knowledge of Beck actually *confirms* that this is his primary source (methinks he doth protest too much). Beck's collection of historical CO2 samplings ignores the poor quality of both the sampling sites, the measurement methods & the sensitivity of the measurement tools-all of which are suspect. For a very good analysis of Beck's data-I suggest going here: http://www.realclimate.org/index.php/archives/2007/05/beck-to-the-future/ Oh, & before Ralph accuses me of merely trying to "squeeze out skeptics"-that claim is simply *not true*. I just want to squeeze out BAD SCIENCE! That's as true of Beck as it is of Manne (he of the awful Hockey-stick. I mean, seriously, what kind of *scientist* uses a single, dubious source of paleo-climatic information & builds a paper round it?) By contrast, though it has still to be independently verified, Lindzen's hypothesis regarding "The Iris Effect" is based on quite sound scientific principles (yes, I have read the paper, & understand enough of it to make this judgment)-even though Lindzen is a noted Skeptic.
    0 0
  23. I'm not sure if I'm witnessing the conception of a new misconception or just a "rebunking" (hat tip to Hank Roberts) but ralphiegm's constant repetition of problems with C02 measurements sure sounds like a launch to me. ralphiegm, all of the measurement sites you worry over show a steady increase in C02 content. How would the poor mixing you imagine comport with that? Is each site measuring a hermetic local atmospheric cell with its own C02 sources? For instance, what about the grandpa site, Mauna Loa? Is Hawaii stuck in a persistent gyre, with the atmosphere isolated from the rest of the world? Does the C02 measured at that site originate just within Hawaii? Or does the imaginary bubble extend to Midway? Japan? San Francisco? Where does the C02 in the contrail of a jet flying to Hawaii make the transition from one magical domain to another? Is there a mysterious atmospheric atomic and molecular sieve at play here, unknown until now but identified via proxy only by you? Remember Chernoybl? Remember how it was detected outside of the Ukraine? How about those radionuclides, hmm? Did the the sieve remove Ukrainian C02 prior to crossing the border? Speaking of isotopes, how about the C02 isotope distribution? Does each mysterious atmospheric bubble include a special synchronizing system so that even while mixing does not take place, isotope ratios are kept at the proper proportion across domains? Wait a minute. Maybe it's more reasonable to accept that the atmosphere is mixed. I dunno. What do you think?
    0 0
  24. Marcus writes: By contrast, though it has still to be independently verified, Lindzen's hypothesis regarding "The Iris Effect" is based on quite sound scientific principles (yes, I have read the paper, & understand enough of it to make this judgment)-even though Lindzen is a noted Skeptic. Actually, there really isn't good evidence for Lindzen's iris; in fact, there's now quite a bit of evidence against it: Chambers et al. 2002 Lin et al. 2004 Rapp et al. 2005 Trenberth et al. (in press) There's some good discussion of this here and here.
    0 0
  25. Still further thoughts on the problems with Lindzen's 2009 paper here. Trenberth et al. seem to have really demolished that hypothesis.
    0 0
  26. Even though I have researched climate change/global warming in depth for a few years, there are many aspects of the science I don't understand. I grasp the issues, I see the political problems of business fighting scientists for control of the economy and its direction, based on the cost of going to a low- or zero-carbon economy vs. the dire ecological (and some economic) trade-offs of business as usual. But I need help on much of the science--especially its significance to the earth's ecosystem. As a lay person, I don't see the significance of the airborne fraction of CO2 being relatively constant. Why does that matter to some (Anthony Watts, for example), but not to you or RealClimate.org? No website I've searched has explained this. Please put the answer up front and center in the blog--because how this affects our ecology is why I care. The airborne fraction findings appear to conflict with the IPCC AR4 statement: "Atmospheric carbon dioxide (CO2) concentration has continued to increase and is now almost 100 ppm above its pre-industrial level." Yet a few lines later IPCC AR4 states: "There is yet no statistically significant trend in the CO2 growth rate as a fraction of fossil fuel plus cement emissions since routine atmospheric CO2 measurements began in 1958. This ‘airborne fraction’ has shown little variation over this period." Confusion alert! Explain this conflict to non-scientists if you want us to understand. How can CO2 concentrations be rising since the 1850s (up to 390s ppm as of Dec. 2010) if the airborne fraction is constant? It seems obvious that the airborne fraction would be rising as concentrations of CO2 rise. "Airborne fraction" sounds the same as "concentration." Concentration is a "fraction"--right? Measured in parts per million (ppm). How can concentrations of CO2 be rising if the fraction is constant? Conversely, if concentrations are rising, how could the airborne fraction stay the same? The airborne fraction should be rising as well. Note: It's easy to see why some bloggers are confused about the CO2 measurement site (Mauna Loa, Hawaii), and assuming (wrongly) that CO2 concentrations are only rising there from volcano gas. (You cover this objection well elsewhere on the site.) Is this the reason Watts jumped on the Knorr study--confusion about the significance of the airborne CO2 fraction? Please, make the answer so simple a 4th grader can understand it.
    0 0
    Moderator Response: [Daniel Bailey] The natural carbon cycle is a closed system. Humans are adding extra CO2 into it. The airborne fraction is how much the system can deal with & remove (currently about half of the extra CO2 we put into it). What is left undealt with is added to the existing level of CO2 in the air. This second value is the concentration. Higher levels of CO2 act to raise the global temperatures over time, until a new equilibrium is reached. All other contributing factors being equal, if CO2 concentrations are rising, so will global temps.
  27. Airborne fraction is not the same as atmospheric concentration. It is defined as the ratio of the annual increase in atmospheric CO2 to the CO2 emissions from anthropogenic sources. I apologize for not providing any references, as this is being tapped out from my phone.
    0 0
  28. The airborne fraction is important as it is an indicator of the ability of the natural environment to resist the rise in atmospheric carbon dioxide. If the airborne fraction increases, this suggests that the oceans and terresrtial biosphere are becoming saturated; should that happen we would have less leeway in our use of fossil fuels as more carbon dioxide will be added to the atmosphere for each unit of fossil fuels consumed. Essentially dC = AF*CAE where dC is the increase in atmospheric carbon dioxide from the pre-industrial equilibrium value of 280ppmv, AF is the arborne fraction and CAE is cumulative anthropogenic emissions. Each year that we emit CO2, then cumulative anthropogenic emissions (CAE) is a little larger, and if AF is constant, then dC will also be a little larger. There is no contradiction in the two statements from the IPCC. The airborne fraction is the proportion of anthropogenic emissions that remain in the atmosphere [caveat: simplified definition]. If the airborne fraction remains constant, the amount of additional carbon dioxide in the atmosphere will still increase as our cumulative emissions are also increasing. It is a bit like paying tax. We pay tax on our income at a fixed rate (a bit like the arborne fraction), but the total (cumulative)amount of tax we have paid in our working lives still increases each year. IIRC Watts is confusing airborne fraction with the atmospheric concentration. If the airborne fraction remains constant, that would be a good thing as it suggests the natural carbon sinks have not yet begun to saturate, but it doesn't mean atmospheric carbon dioxide levels (and hence radiative forcing) are not still rising.
    0 0
  29. The confusion between airborne CO2 fractions and CO2 concentrations--and the significance of each--raises a much larger issue: the generally poor communication of complex scientific subjects to a lay audience. Often the overall meaning and impact of discoveries about complex processes are unclear, or get mixed up with other processes. Along with that, its overall effect on or significance to climate change gets lost in translation. Bottom line: the real, far-reaching and sometimes dire conclusions about various climate-related discoveries often get lost, diluted or distorted. An example: I just learned that ocean acidification has huge negative consequences, which are happening right now and getting worse. But I learned about it accidentally, via research on other topics. There are few or no stories in the media about it now. It is ongoing, it is devastating our oceans--but nothing is out there warning the public to stop fossil fuel use, the main cause of the ocean acid spiking. Consequence 1: This muddiness in scientific communications feeds new skeptic arguments as (perhaps unknowingly false) "bombshells", which then get fed to the public (often in watered down or distorted form) from the media by reporters who don't understand the science enough to question it. Also facts and their significance are misrepresented or distorted by reporters with a political agenda, or a mandate to angle news with a conservative or pro-business bias. Such mandates were revealed in recent Fox News scandals, such as directives to staff to do so on health care reform issues, and others, by heads of Fox News. (See Wikipedia on Fox News Channel.) Consequence 2: Hence, the general skepticism among the public (at least in the U.S.) is far greater than that among scientists in general. Public belief in human-caused global warming (AGW) is hugely less than the 97% of climate scientists who understand (based on the huge piles of evidence) that humans are causing global warming and consequent ecological catastrophes. Consequence 3: When the scientific community gets around to fixing the message, it's not heard--ineffective, too complicated, etc.--or it's too late to squash the new myth, which spreads like wildfire in the blogosphere, via Faux News and of course, conservative talk radio. In some media, nobody seems able or willing to check facts or trust real climate scientists over people without pertinent credentials; some skeptical scientific bystanders and those in fields not related directly to climate science are held up as heroes--based not on the quality of their work, but on their skepticism about climate change causes and processes. Sadly, a large portion of the disillusioned public trusts these skeptics without question. This group is unwilling or unable to discern real science from specious claims, over-hyped objections, weak challenges, and outright lies. They recycle myth after myth, and only the ones that fit their predetermined notions. Not scientific! (Parents and teachers: would you please show kids how to do research thoroughly and think critically!? Even better, learn how yourselves.) Consequence 4: The government has passed many laws, and blocked the passage of far more, that would limit climate change and cut pollution. This is a catastrophic failure to solve the problem--based largely on a cracked foundation of weak, broken or misconstrued scientific messaging! What can be done? It's hard to change political beliefs and alignments much. Many conservatives simply align with other conservative opinion leaders against human-caused global warming, for example, without bothering to check the evidence. But scientists *can* do one thing better: communicate. One solution: Scientists need to work with marketers--hire an ad agency for heaven's sake!--to popularize fact and evidence better than the misinformation (in some cases, disinformation and lies) on global warming. Another solution: reach out to schools. Children are constantly learning science concepts, and the framework is already there to educate them about climate science and climate change. Put the educational materials out there, make it part of the government program to boost science and technology training, and get it done!
    0 0
    Moderator Response: Please try and keep your comments on topic, per this site's Comment Policy. You can use the search button or navigation links to find threads related to your point. For this particular post, Are we too stupid would be a more appropriate thread.
  30. Tshane, Here at skeptical science we are about the airborne fraction. That is why this thread exists. It is discussed as a side item in other threads. You probably have not noticed it being discussed. The airborne fraction is not the same as concentration. Many people are confused by that. CO2 concentrations are increasing in the atmosphere as measured at Mauna Loa (and other stations). The volcanic gases do not interfere with the measurement. Your first IPCC statement refers to that. The amount of CO2 released each year by humans would raise the CO2 by more than what is measured if all of it stayed in the atmosphere. About 57% of the CO2 disappears. It goes into trees and the ocean and other natural "sinks" that absorb carbon. The amount that stays in the air is called the airborne fraction. This fraction has stayed the same for a long time. WUWT does not understand what the airborne fraction is so they think (incorrectly) that if the fraction stays the same that the CO2 concentration in the air is staying the same. The real issue is that scientists fear that the airborne fraction will increase. If the sinks become full or stop absorbing carbon for some reason then more CO2 will stay in the atmosphere. That means the CO2 concentration will begin to rise much more rapidly. The climate models presume that the airborne frction will not increase so if the fraction increases we are in even more trouble that we currently think. (For example a recent paper estimates that permafrost will release a large amount of carbon starting in 10 or 20 years) This recent skeptical science thread reviews some of the related issues about the carbon cycle. As you learn more it makes more sense and the pieces start to fit together.
    0 0
  31. Thanks for the replies, Bibliovermis and Dikran. But it is *still* confusing. Dikran Marsupial: "There is no contradiction in the two statements from the IPCC. The airborne fraction is the proportion of anthropogenic emissions that remain in the atmosphere [caveat: simplified definition]. If the airborne fraction remains constant, the amount of additional carbon dioxide in the atmosphere will still increase as our cumulative emissions are also increasing." So why does the concentration increase, but the fraction shows constant? Does this mean the volume of total air is increasing along with the volume of CO2 emitted by humans (and volcanoes, natural emitters, etc.), so the percentage of CO2 (airborne fraction) is constant? (Air increases, CO2 increases in air, so percentage or fraction of CO2 is constant?) If this is correct, a way to communicate that should be clear: 1) CO2 is increasing in the atmosphere. This is bad. (State the reason and the effects--simply.) 2) CO2 as a percentage of the atmosphere is the same. THis is good. (State the reason and the effects--simply.) And doesn't this simply (and only) mean that carbon sinks (oceans, trees, vegetation, etc.) are taking up the CO2 we put out? It does *ot* imply other things--for one, that carbon sinks are healthy for taking in the carbon! It's just a dry, factual statement with numbers and percentages. For example, World Climate Report blog claims "Coral Reefs Expand As the Oceans Warm"--reefs are expanding as a result of ocean warming near Japan. Other places are not mentioned. (http://www.worldclimatereport.com/index.php/2011/02/18/coral-reefs-expand-as-the-oceans-warm/#more-475) This would contradict (or better, ignore) overwhelming evidence that, partly because of CO2 turning oceans more acidic, coral reefs are shrinking and dying overall. So the overall significance is *not* just that the ocean is warming, but that the warming is only one effect of climate change--with some positive but mostly negative consequences. They are ignoring the effects of acidification. World Climate Report: "And it is this opposite effect—a positive impact of [sic? do they mean "on"? --Tshane] coral reef communities and their dependents—that is routinely left out of climate change impact assessments." Isn't that just cherry-picking the science for "good news" in a sea (literally) of bad news caused by CO2 emissions? Also leaving out the overall effect of warming oceans by focusing only on the Japan research? Do climate change assessments "routinely" leave out positive impacts? To be true, this blanket statement would have to evaluate every climate change assessment referenced for what's left out, what was considered, and what was not. But...I don't see that kind of detail and broad scientific, methodical focus in their report.
    0 0
    Moderator Response: Your point regarding cherry picking positive effects is similar to the Positives and negatives of global warming post. FYI this site's List of Skeptic Arguments is great way to find rebuttals to common skeptic arguments. Keep it in mind and resist the urge to stray off-topic, it really does help keep this site readable and organized, which ties into your argument about clear communication of the science.
  32. Tshane3000 The airborne faction is not the fraction of the atmosphere that is due to anthropogenic emissions (as implies by your statement 2), it is the fraction of what we have emitted that is still in the atmosphere. If we have emitted 200 units of carbon dioxide since the start of the industrial revolution and atmospheric carbon dioxide has risen over that time by 100 units then the aurborne fraction would be 0.5 becuase only half of the carbon we have so far emitted is still in the atmosphere. If we had emitted 400 units and atmospheric levels had risen by only 50 units, then the airborne fraction would be 50/400 = 0.125 Carbon sinks are only taking up *some* of our emissions. The airborne fraction is currently about 0.45, which means that the environment is soaking up about 55% of what we are currently emitting. The remaining 45% though goes into the atmosphere, where it increases the greenhouse effect. It is probably best to get to the bottom of one issue before moving onto the next.
    0 0
  33. Tshane, Simple example: Let's say year one you add 2 tons of CO2 into the atmosphere. If the atmospheric fraction is 50%, then that means 1 ton stays in the air and 1 ton is absorbed by nature. The CO2 concentration has also increased because there is an additional ton of CO2 in the air. There is more CO2 in the air than before both in terms of total amount and as a fraction of atmospheric mass. Now let's say year 2 you again release 2 tons of CO2 and again 1 ton stays in the air and 1 ton is absorbed by nature. The atmospheric fraction is still 50% because half of the new CO2 emissions have been absorbed by nature. However, CO2 concentration has increased because now you have 2 extra tons of CO2 in the air instead of just one (1 ton from year 1 + 1 ton from year 2). Does that clear things up?
    0 0
  34. Is the OP confusing the "airborne fraction" with the CO2 levels themselves?  As defined, the constancy of the airborne fraction would simply mean that the amount of increase in global CO2 for each kg released would remain constant.  If it were to increase suddenly, that would be cause for greater alarm, and if it were to precipitously drop we might be able to take some comfort, but the fact that it remains the same essentially means the problem will continue to grow as expected.

    0 0
  35. swt94025 @84,

    The answer is 'No it's not' but but I can see the appearance of "no statistically-significant trend in CO2 growth" in the OP's quote from IPCC 2007 is perhaps a little too unexpected and thus potentially confusing. As it happens, over the long-term, both the Airborne Fraction and the increase in total human annual CO2 emissions remain remarkably constant since 1958 when MLO CO2 measurements began. (The latter increase measures some 1.4Gt(C)/decade. Given reported emissions in recent years, hopefully that constant level of increase is becoming a thing of the past.)

    0 0

Prev  1  2  

You need to be logged in to post a comment. Login via the left margin or if you're new, register here.


The Consensus Project Website

THE ESCALATOR

(free to republish)


© Copyright 2024 John Cook
Home | Translations | About Us | Privacy | Contact Us