Climate Science Glossary

Term Lookup

Enter a term in the search box to find its definition.

Settings

Use the controls in the far right panel to increase or decrease the number of terms automatically displayed (or to completely turn that feature off).

Term Lookup

Settings


All IPCC definitions taken from Climate Change 2007: The Physical Science Basis. Working Group I Contribution to the Fourth Assessment Report of the Intergovernmental Panel on Climate Change, Annex I, Glossary, pp. 941-954. Cambridge University Press.

Home Arguments Software Resources Comments The Consensus Project Translations About Support

Twitter Facebook YouTube Mastodon MeWe

RSS Posts RSS Comments Email Subscribe


Climate's changed before
It's the sun
It's not bad
There is no consensus
It's cooling
Models are unreliable
Temp record is unreliable
Animals and plants can adapt
It hasn't warmed since 1998
Antarctica is gaining ice
View All Arguments...


Username
Password
New? Register here
Forgot your password?

Latest Posts

Archives

Working out future sea level rise from the past

Posted on 9 February 2010 by John Cook

Predicting future sea level rise is tough. A growing contributor to sea level rise is ice sheets that break off into the ocean. However, ice sheet dynamics are non-linear and difficult to predict. The IPCC 4th Assessment Report essentially ignores ice sheet dynamics, predicting sea level rise of 18 to 59 cm by 2100. More recent research accounting for accelerating ice sheets predict sea level rise of 75 cm to 2 metres by 2100 (Vermeer 2009, Pfeffer 2008). Even these latest predictions admit they may not fully predict the non-linear aspect of ice sheet dynamics. However, there is another way to determine future sea level rise that neatly sidesteps the complexities of non-linear dynamics. Look at how sea level has responded to temperature change in the past.

The last interglacial around 125,000 years ago is a period of special interest. The Earth's orbital eccentricity was more than twice the current value, meaning the orbit was more elliptical. This caused warmer summer temperatures than current conditions. Sea surface temperatures at the equator were about 2°C warmer than pre-industrial levels. Ice cores from Greenland and Antarctica find polar temperatures were about 3 to 5°C warmer than today.

Thus the last interglacial provides an insight into where our climate is currently headed over the next century and beyond. A global compilation of sea level indicators from reefs, corals and sediments were used to estimate global sea level during this period. The result was that it's very likely (95% probability) that sea levels were at least 6.6 metres higher than today. It's likely (67% probability) that sea levels exceeded 8 metres (Kopp 2009).
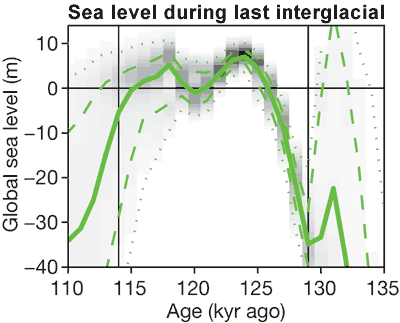

Figure 1: Probability density plot of global sea level during the last interglacial. Heavy lines mark median projections, dashed lines the 16th and 84th percentiles, and dotted lines the 2.5th and 97.5th percentiles (Kopp 2009). Global sea level of 0 represents current sea level.

Independent analyses of the last interglacial paint a similar picture. A number of studies have found sea levels during the last interglacial much higher than modern levels, all concluding that ice sheets are very sensitive to temperature change (Blanchon 2009, Overpeck 2006, Rohling 2007). It's important to note that this doesn't mean sea levels will rise 6.6 metres by 2100. It takes time for the ice sheets to respond to warming and there is still much uncertainty over exactly how quickly sea levels will reach such levels.

Nevertheless, the bottom line is the global warming expected over the next century will take us to temperatures that in the past raised sea levels over 6 metres higher than current levels. This is a sobering fact for the millions of people concentrated on coastlines.

0 0

Printable Version  |  Link to this page

Comments

Prev  1  2  

Comments 51 to 91 out of 91:

  1. Look at the Antarctica situation - ice loss is accelerating there now. We don't know if it is a transient phenomenon, but we know that we are surprised. We also know that we have had sea level rise during years of little surface temperature increase, indicating imbalances. It takes very little acceleration to reach around 1m rise by the end of the century, and in fact we don't know if the forcing already in place will be enough. Fitting an exponential model, t=0 in 1900, L(0)=-5 L(t)=Lo+a*exp(kt) with the historical data plotted above, I get (R quickie) a=2.1, k=0.02 for L in cm. And L(200)=121 cm, ie 126 cm above 1900 level in 2100. For such a short time span and relatively modest rises, this process is perfectly possible. Of course, the 2.6 cm/year rise predicted from 2099 to 2100 by this "model" may seem extreme compared to the present rate of about .32 cm/year, but compare that to the rate of about 0.07 cm/year in the 1890es. Which, apart from some possible land use/GHG modifications should be the "natural" sea level rise in the "LIA recovery". Then somebody might say "exponential processes don't occur in relevant contexts in nature". Really?
    0 0
  2. #49 thingadonta, that effect can contribute to the average rate of sea level rise, but has no effect on changes in rate (acceleration) on the timescale of a century or two. Almost all of that sea level rise happened 6000 years ago or earlier, so the change in subsidence rate today due to that load is really, really tiny. It is irrelevant to the subject of Church 2008.
    0 0
  3. Slightly misspoke in my post #52. It is irrelevant to the acceleration, but not the whole reconstruction. But check out page 11 of Church 2008, and my first posting. The loading effect of sea level rise is included in the GIA modeling. For details, you would have to track back through previous papers.
    0 0
  4. Arno Arrak, what is different is that today Greenland is losing significant amounts of ice. Based on multiple independent data sets, by the way. It was not in the 1990s and before. Antarctica as a whole is most likely losing ice. In the 1990s and before it was not, as far as we could tell. So things HAVE changed. Chao et al. (2008) looks like a very solid paper, and you can see a plot of their sea level curve in the reply to comment #10. Prior to their work, there were unexplained real or apparent changes in rate in the middle of the 20th century. They showed that these could be explained by water impounded in reservoirs, which is the context of their linear fit. But look at the last 25 years of the data -- the trend is clearly steeper than average, and that is where you find the largest residuals to their linear fit. It appears that Chao et al did not test whether a model with a break in rate in the 1980s would be statistically justified based on the data or not -- they did not report on it or even hint that they tried it. This was not the focus of their paper, and certainly their conclusion does not rule out the possibility of recent acceleration in rate, as they stated explicitly in the last paragraph of the paper.
    0 0
  5. From the Kopp 2009 abstract: "When global sea level was close to its current level 10m, the millennial average rate of global sea level rise is very likely to have exceeded 5.6 m kyr-1 but is unlikely to have exceeded 9.2 m kyr-1" If I interpret this correctly, 5.6m ky-1 is an average rate of 5.6mm/yr. Our current sea level rate of rise of around 1.7mm/yr (over all historical record) to 3.2mm/yr (over the shorter satellite record) is well below the 5.6mm/yr natural sea level rise rates expected at this point into the interglacial. We should therefore expect an significant acceleration of the sea level rate of rise, with or without anthropogenic global warming. Is this interpretation incorrect somehow?
    0 0
  6. Jeff, thanks for #54 - exactly the point I was going to make about steeper rise in the last 25 years in Chao et. al. (2008), precisely the era in which the anthropogenic CO2 warming has dominated. I think Arno's comment has been disappeared because he made the exact same comment about Gore on another thread and ignored it when he was cor
    0 0
  7. Charlie, what you're missing is the first sentence of the abstract. "With polar temperatures ~3–5 C warmer than today, the last interglacial stage (~125 kyr ago) serves as a partial analogue for 1–2 C global warming scenarios." Knopp et. al. (2009) are concluding that 1-2 C of global warming from present would likely increase the rate of sea level rise from the current value (say 3.1 mm/y) to more than 5.6 mm/y and maybe as high as 9.2 mm/y. Without that 1-2 C of warming, there\'s no reason to expect such an increase. Conversely if AGW goes higher, say 3-4 C, one would have to expect sea level rise faster than those numbers. One background point you may not know - the interglacial before the current one just happened to be warmer than this one - that's why it can be used in the way that paper uses it. The reason it was warmer is because the underlying orbital forcing condition was stronger.
    0 0
  8. Berényi Péter at 03:57 AM on 10 February, 2010 "Yes, definitely. The cancellation is exact, eccentricity variations have no effect on overall solar radiation forcing. Just on its seasonal timing." I beg to differ. The eccentricity does change the total amount of solar radiation. Just not by a huge amount. Dividing a year (orbital period) up into 1000 equal-length segments (about 8.76hrs each), I have calculated the relative total solar radiation input for various eccentricities, based on a simple 1/r^2 relationship between distance from the sun and solar radiation intensity: eccentricity relative radiation 0 1.00000 (circular orbit) 0.0034 1.00001 (min e of Earth's orbit) 0.0167 1.00017 (current e of Earth's orbit) 0.028 1.00045 (mean e of Earth's orbit) 0.058 1.00181 (max e of Earth's orbit) As I understand it, the eccentricity of Earth's orbit is currently decreasing from a value of ~0.02, and is expected to dip to ~0.003-0.004 over the next 20-30ky. The numbers above suggest that eccentricity actually increases mean solar radiation, though the effect is slight (<0.2% at most). This is because the semi-major axis of the orbit doesn't change, which means any increase in eccentricity results in periods where perihelion is closer to the sun, and the inverse square law means the radiation intensity increase at perihelion is greater than the decrease at aphelion, with the difference being about 1% by my reckoning.
    0 0
  9. GFW -- thanks. Makes sense now.
    0 0
  10. I decided to look up some old papers about the loading effect of rising sea level. Farrell and Clark (1976) proposed the classic form of the sea level equation, including the loading caused by rising sea level. Peltier (1994) modified this to include the fact that the extent of the ocean is time-dependent, because water comes up on the shelves, changing what is called the "ocean function" (the ocean function is 1 over the ocean, 0 over land). So the bottom line is that accounting for these effects has been standard for decades. The state of the art has moved past this paper now, but if anyone is interested in finding out more, Peltier's classic 1998 paper in Reviews of Geophysics is a good place to start, and is available free: http://europa.agu.org/?view=article&uri=/journals/rg/98RG02638.xml&t=rg,Peltier
    0 0
  11. Bern and Berényi Péter, I think that the key is not only the eccentricity, but also the timing of the perihelion with respect to northern hemisphere seasons. This is because changes in albedo over a year cycle are dominated by the changes in the northern hemisphere (the southern oceans don't change albedo much). The perihelion in January when the northern hemisphere has snow cover means that the total energy absorbed over a year is less than it would be if the perihelion was in July. Rather than muck up the explanation any further, I'll just point you to George White's explanation: http://www.palisad.com/co2/eb/eb.html See the section on albedo.
    0 0
  12. The link to Kopp in the head post leads to a paywall. The full paper is freely available at http://www.princeton.edu/step/people/faculty/michael-oppenheimer/research/Kopp-et-al-%282009%29-Probabalistic-assessment-of-sea-level-during-the-last-interglacial-stage-.pdf
    0 0
  13. "Charlie A at 16:03 PM on 10 February, 2010 Bern and Berényi Péter" #61 It is clear that radiation intensity increases for the Earth as it gets closer to the Sun. It is also clear that the Earth's tangential velocity increases as it gets closer to the Sun, and that net radiative forcing is thereby compensated. That is very different from the idea that these two tendencies lead to perfect cancellation. I dont see this as being necessarily the case because I think of the characteristics of electromagnetics and gravity (not to mention drivers of the Earth's heat budget) as being independent. Perhaps, however the math proves me wrong.
    0 0
  14. Bern It looks like your calculations assume a static model. The Earth spends less time in those segments nearer the Sun, and more time in those segments farther from the Sun.
    0 0
  15. Bern at 15:22 PM on 10 February, 2010: "I beg to differ" Don't do that, please. Sice J. Kepler (1609) the issue is settled. In your calculation you should not divide the orbital period up into 1000 equal-length segments, but segments for which enclosed area between radii connecting endpoints to center of Sun and the orbital segment itself is constant, i.e. one thousandth of area enclosed by orbit. Redo, enjoy.
    0 0
  16. #48 Jeff Freymueller at 12:17 PM on 10 February, 2010 "But you have to follow up the references. It is clear from the text that they followed the method of Church and White (2006), which in turn followed Church et al. (2004), which outlines the selection procedure" Of course I should have done that. Unfortunately I have a daytime job outside climate science and those papers are behind a paywall. I could arrange for a university proxy, but even that takes time. Could you just copy-paste the list of tide gauge station identifiers used in the Church et al. (2004) calibration procedure along with a pointer to full sea level histories of those gauges?
    0 0
  17. 65 BP: You might be well advised to take the step further to Newton. Kepler settled the issue in a kinematical sense, not a dynamical - that was Newton's contribution. You are making the tacit assumption that wr^2 = L = const independent on eccentricity e. In the case of Earth, I guess we must assume the total energy E=T+V is approximately constant, e varying. Solving this equation for L, is it still independent on e? I haven't looked into that, but intuitively I would guess not. Using r=a/(1+e*cos(theta)), and integrating out theta from r^2w=L also seems to me to result in an expression for L dependent on e. But this is just some thoughts on the fly, I haven't looked into it. It seems to me that your argument shows that we can concentrate on L=L(e) to look at the total irradiation. You did not mention the variable albedo with a non-vertical axis of rotation, but if that is approximately a periodic function of angle, it should integrate to zero over a period, so that's probably ok.
    0 0
  18. #67. SNRatio Of course at least I. Newton (1687) is needed to handle the perturbation issue. The mathematical methods to treat effects of small orbital disturbances adequately took some time to develop even after that (a century or two) and with recent emergence of chaos theory, it is not finished yet. However, the case of eccentricity changes in Earth's orbit is simple. The main players are Jupiter & Saturn. Both have nearly circular orbit, Earth as well. Earth's orbit is also tiny compared to those of giant planets. Disturbances from forces other than radial cancel pretty well and radial forces do not change orbital angular momentum, so they leave orbital period alone. Q.E.D.
    0 0
  19. re#60: thanks Jeff, I was just wondering whether anybody had looked at it-ie the loading effect of rising sea levels. So it seems they have. It would have more bearing on eg flooded river deltas and such. Something else which is probably way off topic (I have always been interested in unusual oceanic features), various natives/locals/fisherman I have come across in the Indian Ocean are adamant that ocean swell size increases with the new moon. This assertion I have heard from areas separated by long distances and cultures. (They might also believe it increases at the full moon, but I havent heard it). I might just have dismissed this, excpet that they were usually right, at least in the short times I was there. Probably has nothing to do with changing sea levels (unless there is some sort of lunar-swell-tide relationship/cycle which has also changed over years/decades/centuries), but I doubt it. Just thought it was interesting. I have no real idea why they ?might be correct in their observation (?ocean current changes?, wind/swell energy combining with lunar tides??).
    0 0
  20. "Berényi Péter Don't do that, please. Sice J. Kepler (1609) the issue is settled." Kepler didnt have computer. Besides, even Kepler didnt say this, as he was only talking about conservation of angular momementum.
    0 0
  21. thingadonta, it's the combined effect of the moon and the sun. It has been know for millennia and anyone living by the sea is well aware of it.
    0 0
  22. thingadonta, here's a picture
    0 0
  23. #70. RSVP "Kepler didnt have computer" He didn't have an electric toothbrush either. So what?
    0 0
  24. #66 Berényi Péter: "Could you just copy-paste the list of tide gauge station identifiers used in the Church et al. (2004) calibration procedure along with a pointer to full sea level histories of those gauges?" They show the stations used in a series of figures, not a list. But I was able to get Church et al. (2004) for free from home, so I think you can get that paper (the later one requires a subscription). The 2004 paper is in Journal of Climate. As for the data, they got all the data from the Permanent Service for Mean Sea Level (http://www.pol.ac.uk/psmsl). I think their entire catalog is freely available.
    0 0
  25. #69 thingadonta, I have no idea if there is a general relationship between swell size/height and phase of the moon, either regionally or globally. Sounds interesting, and possibly testable. I think there are some sea state measurements that are made by satellite, based on the scattering properties of the ocean surface (roughness, basically). But I don't know where one would go to find such data.
    0 0
  26. Jeff Freymueller at 04:07 AM on 11 February, 2010: "They show the stations used in a series of figures, not a list" Well, it makes the study uncheckable. There are data for 2008 individual stations at the PSMSL site. If we do not know the subset used, we know nothing. http://www.pol.ac.uk/psmsl/psmsl_individual_stations.html
    0 0
  27. RE: Berényi Péter at 20:56 PM on 10 February, 2010 Ah, but I did divide it into segments of equal area. You assumed I divided the orbit by length, but I actually divided it by time. To be honest, I expected the higher eccentricities would result in *lower* annual average solar input, due to the longer time spent in the outer parts of the orbit. But in my reading I found that the semi-major axis of the orbit does not change, and, as I mentioned earlier, that means perihelion gets closer, more than counterbalancing the longer time at aphelion. Charlie A: yes, you're right, the phasing of the orbit with the seasons is critical too, as is precession & tilt, and these likely have a far greater effect than just the change in solar input due to eccentricity alone. My point, though, was that eccentricity by itself does have some influence, when you integrate the energy input over an entire orbit.
    0 0
  28. #76. "Well, it makes the study uncheckable. There are data for 2008 individual stations at the PSMSL site. If we do not know the subset used, we know nothing." Sorry, but that's nonsense. Many if not most (maybe all) of the continuous tide stations (which is what they used) are uniquely identifiable from the maps and the siting criteria they mention. If you can't get them all, then politely asking specific questions of the authors to sort out what you can't resolve on your own is what I would recommend.
    0 0
  29. I wonder if this may be the simplest way to estimate the effects of eccentricity e: Irradiation intensity is inversely proportional to angular momentum L=L(e), and from the orbit equation and the second law we get (integrating out) L(e)=a^2/T*L_integral where L_integral can be defined (R syntax) as follows: L_integral <- function(e=0){integrate(function(x){1/(1+e*cos(x))^2},0,2*pi)$value*(1-e*e)^2 } This is a decreasing function of e, therefore irradiation intensity will increase with increasing e. Please correct me if I am wrong! This gives about the same results as Bern got (his values in paranthesis): L_integral(0.0)/L_integral(0.058)=1.001686 (1.00181) L_integral(0.0)/L_integral(0.0167)=1.000139 (1.00017) It's not a strong effect, but it is definitely an effect.
    0 0
  30. Bern "My point, though, was that eccentricity by itself does have some influence, when you integrate the energy input over an entire orbit. " I would think, especially if this effect is integrated over 100,000 years,... plus noting that fact that Northern Hemisphere winter coincides with perhelion, and that most dry land on the Earth is in the Northern Hemisphere, (which would imply a tendency for heat to store unevenly over time), and that ice ages more or less have 100,000 year cycle. Maybe Milankovich wasnt so far off the mark.
    0 0
  31. I apologize for having contributed to mathematics as a broken language here. The intensity/eccentricity problem is easily solvable in closed form, I(e) = I(0)*(1+e^2/2)/(1-e^2)^2. Perhaps an interesting parameter is the summer half year intensity. For two eccentricities e1 and e2, the relation is approximately (pi+4e1)/(pi+4e2). The ca 0.2% variation in intensity between max and min e translates to 2-3 W/m^2 @max irradiation, average one fourth of that, as usual.
    0 0
  32. RSVP, Bern, SNRatio it turns out you are right and I am wrong. Sorry for that. I should have payed more attention, narrative with no math can be misleading. Areal velocity is "constant" indeed, as I have assumed, but only as long as orbit is not changed. With increased eccentricity, it should decrease. So. If A is area of orbital ellipse, T is orbital period, areal velocity is A/T. Let w be angular velocity, r distance to Sun. Instead of r^2w = const (1) (WRONG! in a sense) I should have written r^2w = A/T (2) For an ellipse with semimajor axis "a" and eccentricity "e" A = (1-e^2)^0.5a^2 (3) From (2) and (3) r^-2 = wT(1-e^2)^-0.5a^-2 (4) Since instananeous energy flux is proportional to r^-2, integrating (4) for an orbital cycle (from 0 to T) and dividing it by T gives average radiation power flux. P = 2Pi(1-e^2)^-0.5a^-2 (5) Solar input does depend on eccentricity after all, it is proportional to (1-e^2)^-0.5, so increases with decreasing eccentricity. For small values of e (1-e^2)^-0.5 ~ 1+e^2/2 (6) There is no first order dependence, that much is true. Present day value of e is 0.0167, 125 kyears ago it used to be somewhere around 0.04. Illinois State Museum Milankovitch Factors/Orbital Eccentricity http://www.museum.state.il.us/exhibits/ice_ages/eccentricity_graph.html If we assume "solar constant" (~1367 W/m^2) to be constant over such a timespan, it means a 226 mW additional average radiative "forcing" at TOA (Top of Atmosphere). Not much. Short term variations in solar constant are slightly larger than that. However, annual peak-to-peak irradiance variation due to eccentricity is proportional to 4e(1-e^2)^-2. It was 2.4 times more 125 ky ago than it is now. This year peak daily iradiance at the North Pole is 526.49 W/m^2 (on June 20-21) while it is 561.90 W/m^2 for South Pole (December 22). http://aom.giss.nasa.gov/srlocat.html Since at present perihelion occurs in early January, southern summer irradiation is considerably higher than its northern counterpart. With ancient eccentricity value and right phase of precession, peak daily irradiation at North Pole would be as high as 590 W/m^2 (12% higher than today). Of course axial tilt is also changing, making things a bit more complicated. Illinois State Museum Milankovitch Factors/Axial Tilt http://www.museum.state.il.us/exhibits/ice_ages/tilt_graph.html Anyway, enough to melt ice ferociously. On the other hand, polar winters must have got a lot more chilly back then, probably drier as well (just the opposite of what is observed in recent decades). I was also trying to deceive you (unintentionally, due to my usual hastiness) about the reasons behind constancy of semimajor axis. In fact, as we have seen, orbital angular momentum does change with changing eccentricity, even if there is no first order dependence. On the other hand, semimajor axis (which is inversely proportional to orbital energy and proportional to the two-third power of orbital period, irrespective of eccentricity) is fairly stable. For a different reason however than I was trying to push. It was worked out in late eighteenth century by Lagrange & Laplace. See link for details, amazing stuff. http://www.scholarpedia.org/article/Stability_of_the_solar_system
    0 0
  33. Well, 125 ky ago axial tilt was close to its low value, somewhere around 22.5°, a degree smaller than today. If we take it into account, irradiation at North Pole summer solstice could not be substantially higher than present day Antarctic peaks. Still 7% higher than current arctic values, but is it enough to melt seventy million cubic kilometer of ice, then increase ocean temperature furher? At the tropics, where the bulk of ocean warming is done, neither eccentricity nor tilt has much effect. Are we missing something?
    0 0
  34. Berényi Péter, a possible mechanism for glacial termination has been described elsewhere in this site.
    0 0
  35. The thermal expansion of water is also non-linear. It accelerates with increasing temperature over 4C. It looks pretty complicated to solve. It's also very slow. Sea level lags temperatures by thousands of years.
    0 0
  36. First, the greatest factor in sea levels is the shape of the ocean floor determined by plate tectonics. The effect of plate tectonics creating massive chasms and mountains reshapes the "basin" in which the world's ocean water sits, affecting sea levels far more than any other factor. Second, if there were global warming, it would INCREASE the amount of snow, sleet, and rain on the polar regions. The polar ice caps would be GROWING if there were global warming, not shrinking. Sea levels would FALL, not rise. Evaporation from the ocean's surface (even below the boiling point temperature) accelerates when the water is warmer. An increase in the temperature of the ocean's surface would cause an increase in the humidity of the atmosphere, which -- EVENTUALLY (complex to be sure) -- would increase the humidity world wide. More water vapor in the atmosphere would precipitate when coming into contact with the colder air at the poles. Yes, the vast majority of the evaporation would precipitate at warmer climes, but there would still be a net INCREASE in the precipitation in the Arctic and Antarctic regions. Third, the temperature at the polar regions remains below the freezing point of water year-round. The temperature at Antarctica's coastline in Summer was -15 degrees C. An increase from -15 to -13.4 degrees C leaves the temperature still below freezing. How does ice melt below the freezing point of water?
    0 0
  37. As for the orbital variations, you are all missing the boat quite dramatically. Review the analysis of "THE SWINGING SUN" by Dr. Landscheidt. The planets DO NOT technically revolve around the sun. ALL the bodies in the solar system revolve around the CENTER OF MASS of the solar system. This cuases the sun to "orbit" around a point which is NOT the physical center of the sun, but is the center of mass. The Jovian planets cause the sun to swing around a point in between the sun and the Jovian planets (though extremely close to the sun if not within it). This motion causes the sun -- a mass of plasma -- to slosh around the center of mass in a complex series of cycles ranging from the 11 year sunspot cycle (really 22 years) to 78 years, 170 years, hundreds of years ,and thousands of years. Take a large bowl of water and spin around. Watch the water. The sun's motion around the center of mass of the solar system creates pressure waves and variations in the sun.
    0 0
  38. JonMoseley, do you think you've just discovered the concept of center of mass? Do you think that people here (let alone the climatologists) do not know about it? Come on ...
    0 0
  39. JonMoseley #86 i'm a bit confused. Are you claiming that sea level falls in a warmer world and rises during colder ages? Are you saying that in Antarctica there's not ice melting in summer? It seems to strongly contradict the evidence ...
    0 0
  40. The polar ice caps would be GROWING if there were global warming, not shrinking. Sea levels would FALL, not rise.
    @JM: This is completely at odds with historical sea level and ice coverage reconstructions. Also, what you said can be refuted in a simple manner. Temperature varies with latitude, evidently. This means there's essentially a temperature threshold for the ice caps. The threshold can be thought of as existing at specific north and south latitudes. These threshold latitudes change if the temperature of Earth changes. Hence, if the temperature increases, the polar ice caps shrink. If the temperature drops, the polar ice caps grow.
    0 0
  41. This is probably a silly question. In Fig 1 of this post, when current sea levels match the interglacial sea levels (the zero line), would the current CO2 levels match with those particular interglacial CO2 levels?
    0 0

Prev  1  2  

You need to be logged in to post a comment. Login via the left margin or if you're new, register here.


The Consensus Project Website

THE ESCALATOR

(free to republish)


© Copyright 2024 John Cook
Home | Translations | About Us | Privacy | Contact Us