Climate Science Glossary

Term Lookup

Enter a term in the search box to find its definition.

Settings

Use the controls in the far right panel to increase or decrease the number of terms automatically displayed (or to completely turn that feature off).

Term Lookup

Settings


All IPCC definitions taken from Climate Change 2007: The Physical Science Basis. Working Group I Contribution to the Fourth Assessment Report of the Intergovernmental Panel on Climate Change, Annex I, Glossary, pp. 941-954. Cambridge University Press.

Home Arguments Software Resources Comments The Consensus Project Translations About Support

Twitter Facebook YouTube Mastodon MeWe

RSS Posts RSS Comments Email Subscribe


Climate's changed before
It's the sun
It's not bad
There is no consensus
It's cooling
Models are unreliable
Temp record is unreliable
Animals and plants can adapt
It hasn't warmed since 1998
Antarctica is gaining ice
View All Arguments...


Username
Password
New? Register here
Forgot your password?

Latest Posts

Archives

CO2 is not the only driver of climate

Posted on 25 October 2009 by John Cook

Climate scientists tend to go on a bit about CO2. However, as readers often point out, CO2 is not the only driver of climate. There are a myriad of other radiative forcings that affect the planet's energy imbalance. Volcanoes, solar variations, clouds, methane, aerosols - these all change the way energy enters and/or leaves our climate. So why the focus on CO2? Is it because scientists are all hysterical treehuggers determined to run peoples' lives with a one world government? Or is there a rational, scientific reason for this CO2 preoccupation? Let's find out which...

When I first started investigating global warming science, I attempted to discern the cause by a process of elimination. I studied all possible causes and ruled out any that couldn't be causing all the warming. As my understanding grew, I came to realise this was an inappropriate approach. Understanding what drives climate does not occur by a process of elimination. It's happens by a process of integration. There are many influences of climate and they all need to be considered together to gain the full picture.

For clarity, let me note a few definitions. Radiative forcing is loosely defined as the change in net energy flow at the top of the atmosphere. In this post, we're talking about the radiative forcing from 1750 to 2005. Values are taken from Chapter 2 of the IPCC AR4 which in turn took all their values from peer reviewed papers - apologies that I was too lazy to cite all the original sources. Positive radiative forcing has a warming effect (so obviously, negative radiative forcing has a cooling effect).

  • Surface Albedo has changed due to activity such as deforestation. This increases the Earth's albedo - the planet's surface is more reflective. Consequently, more sunlight is reflected directly back into space, giving a cooling effect of -0.2 Wm-2.
  • Ozone affects the climate in two ways. The depletion of stratospheric ozone is estimated to have had a cooling effect of -0.05 Wm-2. Increasing tropospheric ozone has had a warming effect of +0.35 Wm-2.
  • Solar variations affect climate in various ways. The change in incoming Total Solar Irradiance (TSI) has a direct radiative forcing. There is an indirect effect from UV light which modifies the stratosphere. The radiative forcing from solar variations since pre-industrial times is estimated at +0.12 Wm-2. Note that the radiative forcing from solar variations may be amplified by a possible link between galactic cosmic rays and clouds. However, considering the sun has shown a slight cooling trend over the last 30 years, an amplified forcing from solar variations would mean a greater cooling effect on global temperatures during the modern warming trend over the last 35 years.
  • Volcanoes send sulfate aerosols into the stratosphere. These reflect sunlight, cooling the earth. A strong volcanic eruption can have a radiative forcing effect of up to -3 Wm-2. However, the effect of volcanic activity is transitory - over several years, the aerosols wash out of the atmosphere and any long term forcing is removed.
  • Aerosols have two effects on climate. They have a direct cooling effect by reflecting sunlight - this is calculated from observations to be -0.5 Wm-2. They also have an indirect effect by affecting the formation of clouds which in turn affect the Earth's albedo. The trend in cloud cover is one of increasing albedo which means a cooling effect of -0.7 Wm-2.
  • Stratospheric Water Vapour has increased due to oxidation of methane and had a slight warming effect of +0.07 Wm-2.
  • Linear Contrails from aviation have a slight warming effect of +0.01 Wm-2.
  • Nitrous Oxide reached a concentration of 319ppb in 2005. As a greenhouse gas, this contributes warming of  +0.16 Wm-2.
  • Halocarbons (eg - CFC's) were used extensively in refrigeration and other industrial processes before they were found to cause stratospheric ozone depletion. As a greenhouse gas, they cause warming of +0.337 Wm-2.
  • Methane is actually a more potent greenhouse gas than CO2. Pre-industrial methane levels, determined from ice core measurements, were around 715 parts per billion (ppb). Currently methane rates are at 1774 ppb (eg - 1.774 parts per million). The radiative forcing from methane is +0.48 Wm-2.
  • CO2 levels have increased from around 280 parts per million (ppm) in pre-industrial times to 384 ppm in 2009. The radiative forcing from CO2 is +1.66 Wm-2. CO2 forcing is also increasing at a rate greater than any decade since 1750.

Here's a visual summary of the various radiative forcings:
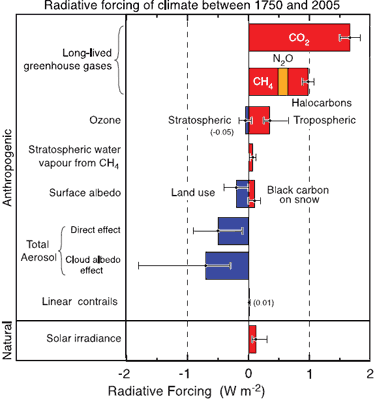

Figure 1: Global mean radiative. Anthropogenic RFs and the natural direct solar RF are shown. (IPCC AR4 Figure 2.20a)

Putting it all together, Figure 2 compares the warming from human caused greenhouse gases to the total radiative forcing from all human sources.
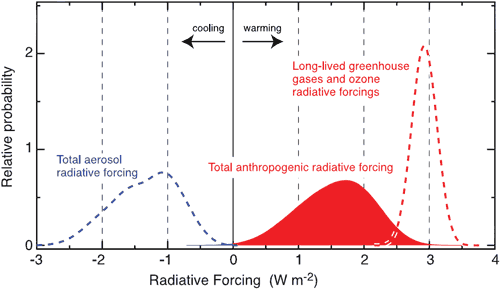

Figure 2: Probability distribution functions (PDFs) from combining anthropogenic radiative forcings. Three cases are shown: the total of all anthropogenic radiative forcings (block filled red curve); Long-lived greenhouse gases and ozone radiative forcings (dashed red curve); and aerosol direct and cloud albedo radiative forcings (dashed blue curve). Surface albedo, contrails and stratospheric water vapour RFs are included in the total curve but not in the others. Natural radiative forcings (solar and volcanic) are not included in these three PDFs. (IPCC AR4 Figure 2.20b)

Greenhouse gases and ozone contribute warming of +2.9 Wm-2. The majority of this is from CO2 (+1.66 Wm-2). This warming is offset by anthropogenic aerosols, reducing the total human caused warming to 1.6 Wm-2. So surprisingly, the warming from CO2 actually exceeds the final total radiative forcing. If ever asked how much CO2 contributes to global warming, you could say "all of it... and some!" But a more appropriate response would be to list the various contributors of forcing, both negative and positive, although this may cause the questioner's eyes to glaze over (and wish they'd never asked). Framing science is never easy.

The other important point to glean from Figure 2 is that we have a relatively high understanding of greenhouse gas radiative forcing. The probability density function (PDF) shows a much higher probability than the aerosols PDF, meaning the uncertainty associated with greenhouse gas forcing is much lower. This degree of confidence is also confirmed by experimental observations from both satellites and surface measurements which confirm the degree of enhanced greenhouse effect from rising greenhouse gases.

So bringing it all together, there are two reasons for the focus on CO2:

  1. CO2 is the most dominant radiative forcing
  2. CO2 radiative forcing is increasing faster than any other forcing

UPDATE: just read an interview with climate scientist Ken Caldeira which focuses on the issue of geoengineering. But one particular quote summed up the issues discussed above:

Question: They also write that you are convinced that human activity is responsible for “some” global warming. What does that mean?

Caldeira: I don’t think we can say with certainty whether we’re responsible for 90 percent of it or we might be responsible for 110 percent of it. But the vast majority of global warming, I believe, is due to human release of greenhouse gases to the atmosphere.

0 0

Printable Version  |  Link to this page

Comments

Prev  1  2  3  4  5  6  

Comments 251 to 268 out of 268:

  1. johnd, convection is definitely a factor in weather, although the data show that latent heat (heat carried by evaporation) is ~3X the convective transfer. Storms have a lot of energy. But if you add up the energy of the entire surface of the planet, as measured, convection isn't the dominant mechanism for energy transfer. Where are your measurements???
    0 0
  2. Just adding to my post on the role of weather, cold fronts moving across a region can change conditions far faster and to a greater degree than what occurs if heat only dissipates due to being radiated off on a clear night. Granted if the night is long enough, any heat accumulated during the day will be lost, and at times more, but the rate of change does not match that of a fast moving cold front.
    0 0
  3. Measurement, noun:ˈme-zhər-mənt Numbers can be confusing at times, but they don't lie, and don't have an agenda. If you want to say that convection is dominant over radiation in terms of surface energy transfer, you will have to show that the existing measurements are wrong, with measurements that support your assertion. Storms are 'weather', not climate - short term variations can be and are MUCH larger than long term changes in the average value, but they average out in the long run. And the long run climate changes shift where the average is located. To mis-quote Jerry Maguire, "Show me the measure!"
    0 0
  4. KR at 05:16 AM, convection is not simply a factor in weather, it is the weather. Accurate measurements are still in the process of being gathered, and are likely to be for some considerable time. If accurate measurements were available, then accurate forecasts could be made, but the limitations of both measuring and understanding the processes means we are still very limited in what we know. If you strip all the assumptions and calculations out of your data, what real measurements are you left with, and what errors or range of uncertainty are they subject to, really. I can't see how anyone can claim one mechanism is dominant over the other, when at least one is so far from being understood, let alone measured accurately.
    0 0
  5. I can't see how anyone can claim one mechanism is dominant over the other, when at least one is so far from being understood, let alone measured accurately. Another way of saying it: My argument has no evidence to support it, so yours must be wrong. That does not seem very persuasive.
    0 0
  6. Actually, most of the energy in hurricanes and other storms is latent heat, released when water vapor condenses into clouds. The spectrograph data for surface thermal radiation, atmospheric back-radiation, and solar irradiance energy values are extremely accurate, robust, and have been repeated over and over again by multiple researchers. Evaporative energy transfer calculated from total precipitation and the energy required for evaporation are solid as well. Total uncertainty in these measures are on the order of +/- 10 W/m^2, out of 492 input and 468 output. Convective transfer is admittedly harder to measure, with over-ocean measures of 10-11 W/m^2, higher over land with averages of 18-19 W/m^2, +/-5 W/m^2. Note that this totals only twice the uncertainty of the other pathways! There are NO convective estimates within an order of magnitude of the radiative energy transfer, no matter who you talk to. And there's only so much room left over between the radiative and evaporative transfers! Weather scale convection? Sure, lots of chaos, lots of uncertainty, really hard to predict next week's weather. But the total energy involved over the long haul (decades) is well known. If you don't have a measurement, you're left with an opinion. And as I said before, opinions contradicted by solid evidence aren't worth much.
    0 0
  7. A (very) side comment on storms, weather, and uncertainty: Weather is a chaotic system, composed of a number of non-linear interactions and stochastic behavior. Like any non-linear system, it is difficult to predict where it will go next along its strange attractor. Weather prediction, in fact, started much of the recent research in chaotic systems with the discovery of the Lorenz attractor! However, like other non-linear systems, the bounds on its attractor, the limits on where it can go, are well established. We don't know what the weather will be two weeks from now - but we know how much average energy is involved, and what the range of changes can be; Arizona won't suddenly freeze for a month in the middle of summer, the Arctic won't boil. And of central importance - the chaotic dance of weather around the average temperature still centers around the energy available for that dance, regardless of how impressive the storm.
    0 0
  8. Small scale analogy are off the taget because there's no significant pressure gradient. In the real atmosphere it is convection that determines (to a large extent) the lapse rate. The lapse rate, in a first aproximation, is constant and independent on temperature. It depends on accelaration of gravity and specific heat. On the contrary, surface temperature is determined by radiative balance. If surface temperature increases so will the whole atmosphere. More sofisticated models predict that the lapse rate may vary with global warming, in particular in the tropical regions. This effects is what should cause the intesification and expansion of the Hadley cell with the consequent expansions of deserts northward. Convection is essential for the redistribution of heat, not for the overall energy balance of the planet.
    0 0
  9. "If surface temperature increases so will the whole atmosphere." I mean troposphere.
    0 0
  10. RE#246 theendisfar Can you please quote at least one reference for your claims? Just one,or are you the only scientist in the world with this theory? I need a primer of data, curves, equations, or anything I can use as a reference before any of your assertions can be taken seriously. As a Peer review I am saying, get some references! A good literature review is probably the most important thing ever when doing research!
    0 0
  11. The best way to test just how much is known and understood and how much is assumed is to test it all, and the best way to test it is to use what is known or assumed to develop models that will predict or forecast the future. With weather and climate forecasting numerous models are used by the various agencies, the IPCC alone track I think 21 different models, and exclude an unknown number, presumably flawed models. All models differ according to the combination of assumptions that are plugged in. Now the important thing to remember is that each model on it's own should be completely valid. There should be no inherent flaws or assumptions that can be proven to be incorrect, otherwise they model itself would have to be considered invalid. Because each model is a valid model it has as much chance as any other model as producing an accurate prediction, and as can be seen with the IPCC tracked models there is quite a divergence. The same happens with weather forecasting modelling, only here we are able to witness whether or not the assumptions prove to be correct or not. In the beginning of the outlook period, typically, based on current data inputted, each model with produce it's own forecast. At times these can be as far apart as it is possible to get. It does happen when different agencies will produce totally different outlooks, 100% opposed. Nothing inherently wrong with the models, just the opinion of the forecasters as to which one was most likely to eventuate. As the outlook period shortens, all the models should begin converging until about 24 hours out they all should be fairly well aligned. At the beginning of the outlook period each had an equal chance of being right, assuming no known flaws were inherent in the assumptions, and with a range of different outcomes, if one happens to be proved right, all the others will have been proven to be wrong. However there is another scenario that can and does occur, they are all proved wrong. It is obviously impossible for them all to be proved right. As mentioned there is nothing wrong with any of the models within themselves. The problem lies in the limited collective knowledge about, in this case natural forces, and how that limits the veracity of all assumptions being made. I consider that this evidence, the relatively poor strike rate in producing accurate forecasts, as an indicator of just how limited the collective knowledge is amongst the professionals involved about all relevant factors in the natural world despite those who claim otherwise. If there is a large degree of uncertainty in the measuring of one aspect of the forces involved in the climate, it is completely illogical to claim that there greater certainty in the measuring of any other aspects, because at the end of the day, as in surveying, the loop must be closed, and it cannot close if there is uncertainty in any one leg, and certainty in the other legs then become hostage to the same doubts.
    0 0
    Moderator Response: Further discussion of the accuracy of models should be done on the thread Models are unreliable.
  12. My point about TOA, is that if you measure energy imbalance at TOA, then the system underneath it must heat up.
    0 0
  13. RE#261 johnd I have been busy marking my first year's papers so I can't help it... You say: ...and as can be seen with the IPCC tracked models there is quite a divergence... Please quantify this statement just the opinion of the forecasters as to which one was most likely to eventuate. Can you provide evidence of the forecaster's opinion? all the models should begin converging until about 24 hours out they all should be fairly well aligned. why 24 hours? What physical basis do you have for this? However there is another scenario that can and does occur, they are all proved wrong. It is obviously impossible for them all to be proved right. This statement is too vague. johnd, these statements could be taken and applied in all areas of science and still be given the same bad marks I am giving it now. Watch this video that was linked here before. In order to really criticise the scientific process you need to have a good foundation of how it works. The loose fitting language and assertions you provide do not reflect this.
    0 0
    Moderator Response: Looks like I posted my remark on johnd's comment at the same time you were posting yours. Let's take the discussion of model accuracy to the thread Models are unreliable.
  14. A comment or two on storms - by KR Thermal convection from the surface (estimated at 20-24 W/m^2) and latent heat/evaporation (est. 78 W/m^2, primarily by calculating evaporation energy versus precipitation) are both elements of storms/weather. As a personal anecdote (why, oh WHY are personal anecdotes more acceptable on blogs than actual data???), I fly (extremely) light airplanes. On a hot summer afternoon, in the peak of convective/thermal activity from ground temperatures, I can get bounced around by updrafts and downdrafts - to the tune of ~200 meters per minute in some cases. In a thunderstorm initiation, a thermal brings wet air up through the lapse rate (averaging 6.5 °C per kilometer temperature drop with altitude) to the point where it condenses - the bottom of a cumulus cloud. If the excess energy released by condensation warms the air sufficient to bring more wet air up, the updraft increases, more air comes in, the updraft increases some more, and so on - limited only by the transport of wet air up into the convection cell. At this point the initial thermal becomes irrelevant - the energy of condensation is much larger than the initial thermal transferring ground heat. In a thunderstorm the limit is the transport of wet air under and up into the convection cells. In a hurricane the warm ocean continues to evaporate as wet air moves up, supplying more energy, and feeding the storm as long as it is over warm ocean. The top of the cell is where the lapse rate reverses, and the temperature is no longer dropping with altitude. The initial thermal is the pull-starter on the storm - the condensation and latent heat provides the 'gas'. Hail also contributes - if the temperature drop in the storm is sufficient to freeze water, it gains the energy of liquid-ice transition as well. Approximately 5×10^8 kg of water vapor are lifted by an average thunderstorm, condense, and add energy to the storm. The storm ends when insufficient water vapor is available. Back to the personal - normal convection cells are enough to bounce me around. Thunderstorms have enough energy to reduce me and my plane to tasty bite sized chunks, with thousands of mpm up/down drafts... when a thunderstorm comes by I had better be hiding in a very secure hangar! Thermals can't do that. Latent heat provides most of the energy for storms - thermal convection from the surface just kick-starts the process.
    0 0
  15. yocta at 09:53 AM on 4 June, 2010, if you've finished marking your first years papers and it hasn't been too traumatic, answer to your earlier questions are at the "How reliable are climate models?" thread. I was going to provide multiple choice answers in keeping with the education practices of today but decided against it. ;-)
    0 0
  16. @248 KR Again - what are the actual measurements? In time. It appears you're not ready. Thought analysis and small scale experiments give solid clues to what happens when you scale up the model. You see these GCM models that AGW Believers hold so much faith in are nothing but THOUGHT Experiments without careful thought and input. First off, the numbers you give are averages. Averages are no help in determining the behavior of a thermo-system, only in determining the average inputs and outputs that will give an average temp. The less you know about the behavior of a system, the less able you are to predict the outcome of events. Example. 390W/m^2 works out to be an average 14.83 C surface temp, and 324 = an average 1.79 C Atmosphere temp. What does this tell you about the Highs and Lows of the system? Where they are at? How long does it take to reach a High or low in an area that is arid vs humid? How much higher or lower does it get in arid vs humid with same input? Here's some questions that may help. What would the Earth's High's and Low's be without an atmosphere (i.e. zero greenhouse effect)? Simple higher lower will suffice, but rate of heating and cooling are also important. If all matter emits radiation, then do N2 and O2 molecules emit radiation? Do they also absorb radiation in the same wavelengths that they emit? (look it up before you answer) Hint: They do. If N2 and O2 absorb and emit radiation, are they GHG's? Is the atmosphere heated by contact with the surface (conduction) or do GHG's absorb IR and transfer the heat to local N2 and O2? If CO2 'traps' 2W/m^2 at the surface of the planet and a cubic meter of water contains ~1.2 Billion joules (at 14 C), how long would it take for the 2 Watts to heat the cubic meter of water 1 C? How much energy (joules) is in a cubic meter of dry air at 14 C at sea level? In order to verify the GCM's are behaving correctly, the above questions and many more need to be answered. As for the measurements, they are useless when averaged, and for convection being a minor part, every bit of wind and weather the Earth has is a result of convection. 4,000 Trillion tons of air reside in the convective zone and it takes Trillions of Trillions of joules to get and keep it moving, much less blowing down buildings on occasion. We can get to 'peer reviewed' work soon enough, let's If you don't like answering questions, then say so and I'll simply make statements and you tell me if I'm wrong. Work for you? Feel free to ask me questions.
    0 0
  17. Again - what are the actual measurements? theendisfar - In time. It appears you're not ready. Now that's just a flat out insult. I'm very disappointed. The measured values for radiative, evaporative, and convective energy transfer are well established - and they show (relative to our discussion) that convection energies are over 16X smaller than radiative, and 3X smaller than evaporative. Local variances cannot change the averaged values over an order of magnitude, which if you recall are what we were talking about. Large scale averages drive climate, not weather variances around mean temps and humidity. If you change the subject (N2 and O2 radiation? Non-atmospheric models of the Earth? When did you stop beating your wife???) from the balance of convection/radiation levels, I can only conclude that you don't have a response to my question - where are the measurements that contradict the currently agreed upon energy balances? Hypotheses and theories must match the measurements. If they don't, it's time for a new hypothesis.
    0 0
  18. RE#266 theendis far I second KR. Making statements waiting for someone to correct you, in my view is lazy. You say: If N2 and O2 absorb and emit radiation, are they GHG's? I can’t understand why you would ask this question as it demonstates to the reader, an incomplete understanding of the science. All molecules will have absorption/emission spectra, but whether it is relevant to Earth’s radiation budget (and hence if we would label them as greenhouse gases) is dependant on the particular wavelength of light they are active to. The hullaballoo about CO2 is that it is strongly active in the infrared region which is why we are so interested in its properties. See this as a primer on infrared spectroscopy and here on spectroscopy of planets in general and why different solar bodies have different measured temperatures and atmospheric colours. As to the rest of your questions bu they will happily provide references for you to read up on but it's not SS readers' job to answer them directly if you don't first do the homework. You need to go back and read a first year text on Climate Science, or get a one-on-one with an academic at a university. This took me about 40 mins to find good enough reliable web links to explain my points so I sympathise with people's lack of patience with you if you don’t make a demonstrated effort first to understand the existing physics behind that of climate science.
    0 0

Prev  1  2  3  4  5  6  

You need to be logged in to post a comment. Login via the left margin or if you're new, register here.


The Consensus Project Website

THE ESCALATOR

(free to republish)


© Copyright 2024 John Cook
Home | Translations | About Us | Privacy | Contact Us