


 Arguments
Software
Resources
Comments
The Consensus Project
Translations
About
Support
Arguments
Software
Resources
Comments
The Consensus Project
Translations
About
Support
![]()
![]()
![]()
![]()
![]()
![]()
![]()
![]()
![]()
![]()


![]()


Latest Posts
- Skeptical Science New Research for Week #17 2024
- Water is at the heart of farmers’ struggle to survive in Benin
- At a glance - The difference between weather and climate
- India makes a big bet on electric buses
- 2024 SkS Weekly Climate Change & Global Warming News Roundup #16
- EGU2024 - An intense week of joining sessions virtually
- Skeptical Science New Research for Week #16 2024
- How extreme was the Earth's temperature in 2023
- At a glance - Is the science settled?
- What is Mexico doing about climate change?
- 2024 SkS Weekly Climate Change & Global Warming News Roundup #15
- Fact Brief - Did global warming stop in 1998?
- Skeptical Science New Research for Week #15 2024
- EGU2024 - Picking and chosing sessions to attend virtually
- At a glance - The Pacific Decadal Oscillation (PDO) is not causing global warming
- Climate Adam: Is Global Warming Speeding Up?
- 2024 SkS Weekly Climate Change & Global Warming News Roundup #14
- Gigafact and Skeptical Science collaborate to create fact briefs
- Skeptical Science New Research for Week #14 2024
- How can I make my retirement plan climate-friendly?
- At a glance - Global warming and the El Niño Southern Oscillation
- A data scientist’s case for ‘cautious optimism’ about climate change
- 2024 SkS Weekly Climate Change & Global Warming News Roundup #13
- Skeptical Science New Research for Week #13 2024
- You can start applying for the American Climate Corps next month
- At a glance - Human fingerprints on climate change rule out natural cycles
- Want clean electricity? These are the overlooked elected officials who get to decide.
- 2024 SkS Weekly Climate Change & Global Warming News Roundup #12
- Climate - the Movie: a hot mess of (c)old myths!
- Skeptical Science New Research for Week #12 2024
Comment Search Results
Search for Humlum
Comments matching the search Humlum:
- At a glance - Is the CO2 effect saturated?
Eclectic at 17:38 PM on 23 April, 2024Theo Simon @4 :
As John Mason says @5 , there are certainly some Red Flags attached to that Kubicki paper ~ including it's citations of papers by Harde; by Humlum; and by Idso . . . those prominent luminati of the Alternate Universe.
Theo, to save your reading time in future ~ whenever you see a "gotcha" article in NoTricksZone .com , claiming that the mainstream science (of anything) is quite wrong . . . then there's a roughly 99% probability that the article is a load of taurine excrement [abbreviation = BS ].
Reading the cited [Kubicki] article's Abstract quickly demonstrates that the authors have simply failed to understand the basic physics of the atmosphere & GreenHouse Effect [abbreviation = GHE ]. And this first impression gets confirmed by reading the article's Conclusions, which are comprised of an excessive amount of word salad and bizarro politics.
Kubicki et al. seem to have discovered ideas that have been well & truly debunked . . . many decades ago. If only the authors had troubled to have their "novel" ideas reviewed by experts, before presenting their paper to the world ! They could have saved themselves so much embarrassment, as well as saving dollars.
- Settled Science - Humans are Raising CO2 Levels
Bob Loblaw at 06:44 AM on 13 January, 2023A follow-up to my comment @ 69, which was a response to EnderWiggin @ 68.
On Tuesday, I did a search for the title and author (Salby) that EnderWiggin provided. I was able to find parts 1 and 2 on a site hosted at scc.klimarealistene.com - but by Wednesday, that domain name had disappeared and could no longer be reached.
klimarealistene.com does still exist, but has no signs of the papers. A bit of searching on their web page found a link to scienceofclimatechange.org. Eventually, the two papers were found on this page (Volume 1.2 December 2021).
A bit of background. Klimarealistene is a well-known Norwegian climate "science" contrarian group. The "journal" Science of Climate Change is their creation. I suspect the change in web location has to do with reorganization of the journal's online pages. The old "scc" portion of the klimarealistene link was undoubtedly short for Science of Climate Change.
On the main SCC page, they say:
4 November, 2022
The journal Science of Climate Change was funded by Klimarealistene in Norway in September 2020, and the first issue appeared in August 2021. Several additional articles have been published in 2021 and 2022, but due to a heavy work load on the Editor they have not been collected into Volumes before now. A few articles have also been delayed in being published. The Scientific Council of the Norwegian Climate Realists is at the moment working on a plan for the management of the journal from 2023. In the mean time I have stepped in as Editor to handle the backlog…
The list of authors on their Volumes and Issues page reads like a who's-who of climate science contrarianism in Norway. Standard names such as Salby, Humlum, Harde, and Solheim dominate.
So, the "obscure" journal, as EnderWiggin refers to it, looks like it is basically just a mouth-piece for Klimarealistene, so they can "publish" stuff and make it look like a journal. Credibility factor approaching zero.
The two CO2 papers in question are co-authored between Salby and Hermann Harde. Interestingly, Salby is listed with an affiliation of "Ex Macquarie University" -a university he was fired from in 2013, after only 5 years. Not an inaccurate claim - he's clearly no longer there - but rather reeks of resume padding. (Of course, Salby is now "Ex Earth", having passed away in 2022.)
Part 1 basically looks at C14 fluxes and argues that it can be used to estimate carbon uptake rates. Part 2 follows to look at recent (nothing older than 1956) variations in CO2 and temperature, to claim that anthropogenic contributions to the rise in CO2 are negligible.
I didn't try to evaluate their math in detail, but basically it looks like yet another case of taking the short-term variation in CO2 concentrations and temperature, and making erroneous statistic correlations that mislead them about long-term trends. Same dog, same old tricks.
In my comment above, the most applicable debunking is probably the one in this SkS post:
- Human CO2 is a tiny % of CO2 emissions
MA Rodger at 22:29 PM on 2 May, 2021Eclectic @349,
I think what you call "quite a laundry list" presented by commenter lindzenfanone @348 is less a laundry list and more a nonsensical rant. (The commenter doesn't start well in my book with his chosen nom-de-clavier. For me Dicky Lindzen is today a proven liar who long-ago turned away from the scientific method.)
The rant begins effectively saying that there is no available ontological truth which of course will make all argument circular. This is followed by some silliness about naturally-emitted CO2 and anthropogenic-emitted CO2 requiring to act differently with AGW science. The non-correlation comment could be presented statistically if it were not so crazy and wrong, this followed by poorly presented statements that try (but fail badly) to set out reason to support a bold (and with the failure, unsupported) assertion that "IPCC's core theory is wrong!!"
The links appended to the comment lead to a number of dubious published papers that don't bear scrutiny**, Berry (2019) 'Human CO2 Emissions Have Little Effect on Atmospheric CO2' (two links provided), Humlum et al (20130 'The phase relation between atmospheric carbon dioxide and global temperature', Koutsoyiannis & Kundzewicz (2020) 'Atmospheric Temperature and CO2: Hen-Or-Egg Causality?' and Harde (2019) 'What Humans Contribute to Atmospheric CO2: Comparison of Carbon Cycle Models with Observations' (**These 'usual suspects' have been publishing drivel like this for years. If these particular papers presented anything game-chnging for AGW, indeed anything at all new and worthy of some small consideration, then that 'something' is failing to appear either within the denialist world or in the real world.)
- Solar Cycle Length proves its the sun
Hans Petter Jacobsen at 06:10 AM on 23 February, 2021Jan-Erik Solheim, Kjell Stordahl and Ole Humlum (SSH) published their papers 'Solar Activity and Svalbard Temperatures' and 'The long sunspot cycle 23 predicts a significant temperature decrease in cycle 24' early in 2012. According to SSH, their Solar Cycle Model can, based on the length of a solar cycle, predict the mean temperature in the next solar cycle for some northern regions. Later the same year I programmed their Solar Cycle Model. I got the same results as they did with their implementation of the model. When the model was run with temperature series for the northern region up to and including solar cycle 23, the results satisfied the statistical test used by SSH. A closer examination with hindcasting (backtesting) revealed that the model predicted the temperatures well until the mid-1970s, but not thereafter. I wrote about this in December 2012 here at Skeptical Science in the blog post 'Solar Cycle Model fails to predict the recent warming'.
In their papers, SSH made some specific predictions for temperatures in solar cycle 24, which had just started in 2012. In 2014 I discussed the Solar Cycle Model with the lead author Solheim on a Norwegian discussion forum. He stressed that we have to wait till solar cycle 24 has ended before we can evaluate the model's predictions for that cycle. Now it has ended. The temperatures in solar cycle 24 were higher than in the previous cycle, not colder as predicted by SSH. See more details in comment 22 in the blog post I wrote here at SkS.
- Solar Cycle Model fails to predict the recent warming
Philippe Chantreau at 00:31 AM on 21 February, 2021Thank you HPJ for this update. It is interesting that cycle 24 was one of the weakest in recent history yet we saw global temperatures in 2020 tied with the all time record set in the large El-Nino year of 2016.
I think people in Norway ought to challenge Solheim and Humlum to a bet like the Real Climate folks discussed recently.
- Solar Cycle Model fails to predict the recent warming
Hans Petter Jacobsen at 23:53 PM on 20 February, 2021When I wrote this blog post in December 2012, the temperatures measured so far in solar cycle 24 were much higher than SSH (Jan-Erik Solheim, Kjell Stordahl and Ole Humlum) predicted with their solar cycle model in [1] and [2]. In 2014, I wrote about the failure of their model on a Norwegian discussion forum. Solheim, the lead author of the two articles, participated in the discussion afterwards. He defended his model. He stressed that we have to wait till solar cycle 24 has ended before we can evaluate the model's predictions for that cycle. It ended in November 2019, so now we have the answer. The average temperatures in solar cycle 24 became much higher than SSH predicted with their model.
In [1], SSH predicted that the average temperature on Svalbard in solar cycle 24 would be between 1.5 and 5.5°C colder than it was in solar cycle 23. According to the Norwegian Meteorological Institute, the average temperature at Svalbard Airport Longyearbyen increased by 1.7°C from solar cycle 23 to 24. According to Berkeley Earth, it increased by 1.0°C at a location inland, not far from Longyearbyen.
In [2], SSH predicted that the average temperature in a northern region including Iceland and Norway would drop by at least 1°C from solar cycle 23 to 24. According to Berkeley Earth it rose by 0.3°C on Iceland and by 0.7°C in Norway including Svalbard.
Figure 1 in the blog post shows how the HadCRUT3 temperatures in the Northern Hemisphere fit with the predictions of the solar cycle model. Then solar cycle 24 had just started, and the blue star for solar cycle 24 showed the temperatures measured so far in that cycle. Now the blue star can be replaced with a blue circle showing the average temperature in solar cycle 24. That is done in the Updated Figure 1.

Updated Figure 1: The observed and the predicted mean temperatures in solar cycles up to and including cycle 24.
The original Figure 1 used the HadCRUT3 temperatures in the Northern Hemisphere, just as SSH did in [2]. Met Office has replaced the HadCRUT3 temperatures with the HadCRUT4 temperatures. The Updated Figure 1 therefore uses the the HadCRUT4 temperatures in the Northern Hemisphere.
The Updated Figure 1 shows the same for the northern hemisphere as the examples do for Svalbard, Iceland and Norway. The temperatures in Solar Cycle 24 became much higher than they were in the previous cycle. Not colder as predicted by SSH.
See the blog post Solar Cycle Model failed totally when predicting colder temperatures for more information and more plots.
The lead author Jan-Erik Solheim and his two co-authors are members of the Scientific Advisory Board in an organization run by climate deniers in Norway. Some months ago Solheim wrote on their web site (in Norwegian) that solar cycle 25 has started. He did not mention his failed predictions for solar cycle 24. On the contrary, he wrote about the connection between solar activity and the climate, about the little ice age caused by low solar activity, and that it will be exciting to see if low solar activity in this century will cause a colder climate. He has obviously not learned from his failed predictions for solar cycle 24.
References
1. Solar Activity and Svalbard Temperatures
Jan-Erik Solheim, Kjell Stordahl and Ole Humlum.
2. The long sunspot cycle 23 predicts a significant temperature decrease in cycle 24
Jan-Erik Solheim, Kjell Stordahl and Ole Humlum.
- CO2 increase is natural, not human-caused
Feneley at 22:16 PM on 6 January, 2019The arguments presented are helpful and fairly comprehensive, but I was surprised the author, dana1981, did not address what, in my view, is the most important scientific publication on this issue: “The phase relation between atmospheric carbon dioxide and global temperature” by Ole Humlum, Kjell Stordahl and Jan-Erik Solheim in Global and Planetary Change 100: 51-69, 2013. These authors showed, using published temperature time series from multiple sources and global CO2 and anthropogenic CO2 data that, for the years 1980 to 2011:
1. There was a good temporal correlation between global CO2 and ocean temp, land temp, global temp and lower troposphere temp BUT the global CO2 FOLLOWED the ocean temp, then the land temp, then the lower troposphere temp, in that order, with lags of 9-12 months.
2. In contrast, there was poor temporal correlation between anthropogenic CO2 emissions and both global CO2 and temperature.
3. While anthropogenic CO2 was emitted overwhelmingly from the northern hemisphere, the time sequence of ocean temperature variation commenced in the Southern Hemisphere, reasonably close to the equator, then spread north and south to the poles, always preceding the global CO2 time sequence.
These carefully determined temporal sequences and correlations, based squarely on the published temperature and CO2 data, clearly indicate a causal sequence in which global temperature changes PRECEDE global CO2 changes by 9-12 months, commencing with changes in the ocean surface temperature, then the land temperature, then the lower troposphere temperature. These observations are the complete OPPOSITE of what should be expected if anthropogenic CO2 emissions were driving both the global CO2 levels and then causing a secondary increase in temperatures.
So, while I appreciate the energy balance and other arguments advanced above, causality requires a demonstrated temporal sequence of changes that the data I describe here simply do not support. I would be very interested in your explanation for these observations.
- Climate's changed before
Eclectic at 16:46 PM on 16 December, 2018Ed @ 621/622 ,
you don't really advance your case (whatever it is) by waving a rhetorical hand in the direction of Copernicus, Galileo, Einstein, and LeMaitre.
Copernicus and Galileo were (strictly speaking!) representing the scientific consensus of their age (an age of very few scientists, indeed). Their opponents (shall we label them denialists?) were a group of rich & powerful men (in the upper echelons of the Papal state) who supported an evidence-deficient position. Easy to see a parallel with the rich & powerful magnates of the upper echelons of the fossil fuel industry . . . plus c'est la meme chose. Even more irony, in that the modern-day Pope denounces those same science-deniers.
Einstein and LeMaitre advanced the physics/astrophysics science ~ but they did not trash the pre-existing body of science.
# Attacking the consensus scientific orthodoxy [especially in climate matters] ought to be done with humility [and genuine skepticism], lest you join the ranks of the Dunning-Krugerites.
"Uncertainty" about ECS (currently the most probable ECS figure being around 3 or 3.5 degrees) is an interesting scientific question ~ but in no way justifies delaying on decently fast transition to a nett-zero-emission economy. After all, we citizens/voters/politicians/parents ought to be intensely practical in prudent risk-managing.
My apologies, but my little laptop is struggling to access "figure 8.14 and 8.15 of AR4 WG1". Perhaps, Ed, you would be kind enough to upload those charts and explain how you think they undermine the mainstream position.
Strangely, the same goes for Dr Humlum's "climate4you" illustrations. (I have no difficulty accessing the WUWT and Climateetc websites.) On the little I know of Dr Humlum: he has (scientifically speaking) a poor track record indeed. * That is not to say he must therefore be wrong, on the cloudiness issue. But it seems the somewhat-related "Iris Hypothesis" of Prof Lindzen has fallen flat on its face. And on a second point: a "cloudiness drop" providing a warming forcing of "roughly 4 W/m^2" has much the same problem I mentioned above in post #619.D . . . that if true, then there must also be some Unknown Mysterious Cooling Factor that nicely follows/matches the rising arc of CO2's warming forcing effect. Which seems absurdly unlikely, if not quite impossible.
(And which would leave only another 5 impossible things to believe before breakfast.)
- CO2 limits won't cool the planet
MA Rodger at 10:30 AM on 28 December, 2017Aaron Davis @18,
Not only are you seriously in error throughout you grand analysis, you are too stupid to understand when these errors are pointed out to you.
Perhaps we should consider the most egregious error you make. This is the inability to understand that an anomaly will take away any sign of temperature variation if such a variation resulted from an annual dip in CO2 over tha arctic. Consider this. The graph below is the RSS TLT data for arctic & antarctic, the graph you cite up-thread. It plots anomalies. Note the maximum variation is just +/-a handful of degrees centigrade from zero.
So what happened to the annual variation in polar temperature? This would give an annual cycle of 30ºC peak-to-peak but it has been disappeared. This disappearance is achieved "...by subtracting the a mean monthly value determined by averaging 1979 through 1998 data ... for each month." So the stonking big annual 30ºC cycle is entirely disappeared and any other annual cycle (like for instance a possible teeny weeny drop in temperature due to CO2 levels dropping by a few ppm every year for a handful of months) will also be disappeared with it. Was this teeny weeny cycle there during the period 1979-98 which provided the data for the anomaly base?
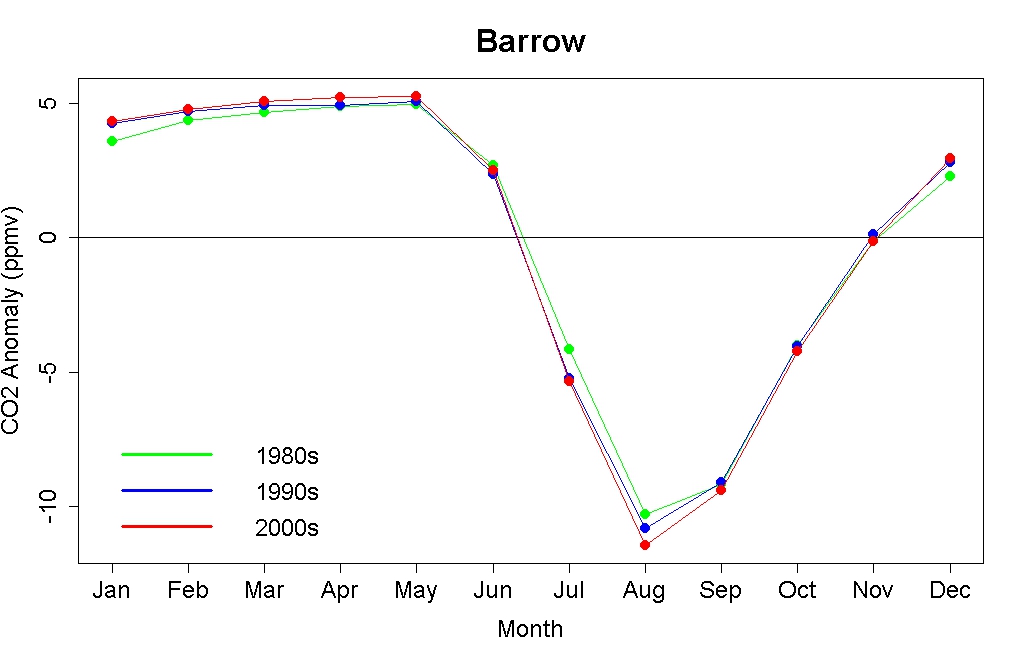
It appears it was! So it too would be disappeared from the anomaly.
Arron Davis, if you cannot comprehend this basic property of anomalies, you don't really have a place comment about anomalies on this thread.
- Temp record is unreliable
michael sweet at 22:12 PM on 31 July, 2017Mie Evershod,
Are you aware that the adustments of the old records have resulted in a substantial lowering of the amount of warming measured? Any uncertaity introduced by the adustments have to be in the direction of increased warming, not decreased warming. That means the problem would be greater than determined using the adjusted data. Humlum and others claim that they do not trust the adjustments but then refuse to use the unadjusted data for analysis because it shows a greater problem. That is contradictory and hypocritical.
The unadjusted data are still available for use by anyone who wants to use bad data. (link to Guardian article comparing adjusted and unadjusted data). If you do not trust the adjustments go for it with the old data.
- Temp record is unreliable
scaddenp at 21:02 PM on 26 July, 2017"Thirdly, Humlum argues that OHC is a better measure of global temperature which all would agree is true"
I am guessing Humlum support for OHC was at same time as Peikle was pumping it, believing it would show less warming. Wonder if he still as enthusiastic? Peikle went very quiet about it. OHC is a good measure of energy imbalance - and the data set is considerably less noisy than surface temperature. However, the surface temperature for all of its noise and measuring issues is about where we actually live.
- Temp record is unreliable
scaddenp at 20:46 PM on 26 July, 2017"but the data revisions - especially those before the satellite record - would seem to create some uncertainty around the long term rate of the warming."
I dont get the logic here. Does cleaning the lenses on your camera increase the noise in the image? The "revisions" are results of in depth, peer reviewed methodologies to put station records onto a common basis which reduces the uncertainty, not increases it.
I find your faith in the satellite data unwarrented too. See this myth for which has the greater uncertainty. Let me ask this, how much of Humlum stuff do we need to debunk for you before you write it off as misleading (to be polite)? 10, 20? or will you keep looking through that and other pseudo-skeptic sources in hope of finding better news?
- Temp record is unreliable
MA Rodger at 19:42 PM on 26 July, 2017Mike Evershed @427.
For anyone who takes the time to examine Humlum's work, it is evident the man is a prolific source of nonsense and that he does not take any rebuttal seriously because he doesn't care. Note his Figure 3 on the web-page providing your primary quote - it is addressed in this SkS rebuttal here but in response Figure 3 has not been properly corrected by Humlum. Rather, now we find his Figure 3 is simply "not showing the post Little Ice Age temperature increase."
The logic of the Humlum quote you present @422 is making three assertions. Firstly that it is difficult to create "a meaningful global average temperature" and while the word "meaningful" is a bit odd, it is correct to say that it is not a trivial task to create a global surface temperature record. But, as shown in the links @423Response, this work has been done.
Secondly, Humlum references Essex et al (2006). Yet Humlum does not set out in any way what it is in this paper he is referring to. He says it is "an interesting discussion of the whole concept of calculating an average global temperature" and that "a re-read of Essex et al. 2006 might be worthwhile." The reference by Humlum is thus nonsense.
Thirdly, Humlum argues that OHC is a better measure of global temperature which all would agree is true.
So, stripped of its nonsense, Humlum's quote is not supporting your suggestion that there is "some uncertainty around the long term rate of the warming," that is uncertainty beyond that declared within the work that created them.
- Temp record is unreliable
Mike Evershed at 18:33 PM on 26 July, 2017Thanks for the measured response Rob. My question was a serious one - my reading of Humlums data on this narrow point is not that there is any doubt about the fact of warming, but the data revisions - especially those before the satellite record - would seem to create some uncertainty around the long term rate of the warming.
- Temp record is unreliable
Rob Honeycutt at 11:18 AM on 26 July, 2017Mike... It should be noted that most of the regulars here are very familiar with Humlum's work. He really isn't credible. On this topic in particular he's presenting a rather absurd notion. Yes, all the various data sets show different figures, but they only vary in a minimal way, and the differences between them certainly don't invalidate them in any way.
To the question, "Is global mean temperature rising?" there can be no doubt. All the data sets say yes. We get that from all the surface station data and from all the satellite data. The variances between them are merely a function of how each group processes their data.
It's interesting that Humlum states that ocean data is the better indicator, and he's right. And when you look at ocean heat content you get the exact same answer. The climate system is accumulating heat.
- Temp record is unreliable
Bob Loblaw at 10:50 AM on 26 July, 2017Mark:
The point is that Humlum has no credibility as a witness.
- Temp record is unreliable
Mike Evershed at 05:11 AM on 26 July, 2017Hi DB: I apologise for not adding the final extension to the link. However now you have added the correct link, other users can see Humlums extensive analysis of administrative changes in all the major data series. This hardly constitutes a straw man. And how does making a generic attack on "Humlum's nonsense" contribute to this debate? I have cited his extensive charts on instability in the reconstructed temperature data and you respond with two completely unrelated points made on other data presented by humlum. Do your sites standards on "ad-hominem" and provision of proof apply to moderators? If not I'm probably wasting my time.
- Why the Republican Party's climate policy obstruction is indefensible
scaddenp at 06:45 AM on 9 July, 2017Climate4You is Ole Humlum's misinformation organ.
- CO2 lags temperature
KR at 21:17 PM on 4 April, 2017malpeli - Long story short with Humlum: if you remove the trend before analysis, then claim from what's left that the trend doesn't exist, you have done your analysis incorrectly. I won't speculate on why his analysis is so poor, but I'll point out that Humlum has a history of similar errors.
- CO2 lags temperature
HK at 04:33 AM on 4 April, 2017A big problem with Humlum’s claim is the period from 1940 to 1975.
Using SkS’s trend calculator I find the trend in this period to be -0.024oC/decade with data from NASA-GISS and -0.015oC/decade with data from Berkeley Earth, plus/minus some uncertainty for both.
In the same 35 year period the global mean CO2 concentration increased from 311 to 331 ppm. Where did those 155 gigatonnes of extra CO2 come from when both land and sea surface temperature trends were close to zero or slightly negative? - CO2 lags temperature
Tom Curtis at 22:03 PM on 3 April, 2017Malpeli @562, the short answer is that in determining the lags, Humlum first subtracts from each monthly temperature or CO2 concentration value, the value of that same data from the month exactly one year before. The effect of this process is to remove the trend. Therefore, at most all he can logically conclude is that temperature is responsible for the variations in CO2 concentration around the trend line. He is certainly unable to conclude from that that temperature is responsible for the trend in CO2, as he has removed all data about that trend from his analysis.
Further, when you examine the data you see a variation in temperature across a range of 1 C, and a variation of of CO2 concentration across about 3 ppmv. It follows that if we accept Humlum's analysis as he presents it, we would deduce (very roughly) a relationship in which each 1 C of temperature rise would result in 3 ppmv increase in CO2 concentration. We would then note that there has been approximately a 1 C increase in Global Mean Surface Temperature since 1900, and hence deduce that CO2 levels have only risen by 3 ppmv due to the increase in temperature, with the rest being due to some other factor. I have done that analysis more exactly using the full Mauna Loa record together with the BEST Land Ocean Temperature Index and found an expected increase of 0.56 +/- 0.32 ppmv of CO2 per degree increase in GMST. Humlum knows the implications of that data, and therefore carefully does not include the relevant analysis in his paper.
- CO2 lags temperature
malpeli at 20:51 PM on 3 April, 2017I have recently come across a study that has led me to question the very basis of anthropomorphic climate change (something I haven't been seriously forced into before). This study claims to have revealed that present day CO2 increases still lag behind temperature increases when you would expect it to precede it as the main driver of the observed temperature increase since 1975. From the abstract:
"The maximum positive correlation between CO2 and temperature is found for CO2 lagging 11-12 months in relation to global sea surface temperature, 9.5-10 months to global surface air temperature, and about 9 months to global lower troposphere temperature"
If CO2 is indeed the driver of this current period of accelerated warming, as the theory states, surely temperature would lag CO2, wouldn't it? What am I missing here?
http://www.tech-know-group.com/papers/Carbon_dioxide_Humlum_et_al.pdf
Apologies if this study has been covered elsewhere but my limited research indicates that it's been ignored by subscribers to the anthropomorphic climate change theory since it was published and contrarians are using it with little resistance.
I do not like being wrong, being repeatedly accused of belonging to the church of global warming is irritating enough. But cognitive dissonance is a worse. I'm more inclined to change my outlook than ignore evidence, though not without a fight obviously...
Does anyone have any suggestions as to why CO2 might still lag temperature, if indeed it is? - Just who are these 300 'scientists' telling Trump to burn the climate?
Nick Palmer at 00:31 AM on 2 March, 2017I thought I'd see how many of the usual suspects were in it. Interestingly, I didn't find Christy or Peiser in there...
ABDUSSAMATOV, Habibullo Ismailovich
ANDERSON, Charles R
BALL, Tim
BARTLETT, David
BASTARDI, Joseph
BELL, Larry S
BOEHMER-CHRISTIANSEN, Sonja A
BRIGGS William M.
D'ALEO, Joseph S.
DOUGLASS JR.
DYSON, Freeman
EASTERBROOK, Donald J.
EVANS, David M. W.
HAPPER, William
HUMLUM, Ole
IDSO, Craig
LEGATES, David R.
LINDZEN, Richard
MANUEL, Oliver K.
MISKOLCZI, Ferenc Mark
MOCKTON, Christopher
MOORE, Patrick
MORNER, Nils-Axel
MOTL, Lubos
SCHMITT, Harrison H.
SINGER, Fred S.
SOON, Willie
SPENCER, Roy W.
WHITEHEAD, David - The oceans are warming so fast, they keep breaking scientists' charts
Esop at 06:06 AM on 23 January, 2015The interesting thing is that over the fast 5 or so years, the deniers have willingly painted themselves into a corner by forecasting anything from mild to dramatic cooling. I can't count the number of times that I asked deniers back in 11/12/13 what their explanation would be when 2014 or 15 would break the record. The answer was always the same: It is cooling.
Back in 2011 or 2012, Norways #1 newspaper ran an article that contained an interview with top ''skeptic'' Ole Humlum, regurgitating the same old denialist mantras, with the mandatory predictions of rapid cooling due to record low solar activity in the coming years, negative PDO and the other usual suspects. I emailed the journalist (and got a response) and told her to do a follow up interview with Humlum & co in 2014 or 15, when the record would likely be broken. I' m not holding my breath, though, even though she might start thinking when the very confident prediction of a layman beat the predictions of her assembled her hand picked panel of ''experts'' (Humlum and (AGW ''skeptic'') solar physicists).
With leading denialists having for years predicted rapid cooling due to natural drivers, but what we instead have seen is more warming, will this wake up at least some of the ''skeptics''? Of course not the paid, pro level guys who know perfectly well what they are doing, but will some of the useful idiots now slowly start to wake up, and what will the implications be?
Will they turn quiet, or will they stand their ground and keep on denying, or will they turn against those that have fooled them for so long?
- CO2 lags temperature
scaddenp at 12:45 PM on 15 January, 2015Well anything from climate4you is likely.misinformation. This is discussed here and here.
You might like to put "humlum" into the search box to see other stuff.
- CO2 lags temperature
MA Rodger at 20:41 PM on 19 December, 2014davytw @447.
I have to say that your denialist has a pretty poor graph. There is a far better one, also from Wood-for-trees, up-thread @391.
As folk here describe, there is a tiny CO2 effect due to rising global temperature but also due to ENSO which wobbles temperature & CO2 both, small (or perhaps more correctly very small) effects when compared with the direct anthropogenic inputs of CO2.
These tiny wobbles are used by some, with added smoke and mirrors, to 'demonstrate' that rising CO2 is natural. I think Murray Salby takes the saddo prize in these works of lunacy as he has actually managed to line all his mirrors up to link this modern-day lagging of CO2 with the measured lags in CO2 in the ice core data. (If you can cope with such madness, there is a 68 minute video of his presentation here. I think it helps if you wear tin-foil hat, just to get into the spirit of the thing.)
Encountering such mind-blowing nonsense once too often prompted me to produce this graphic (usuallt 2 clicks t 'download you attachment'). I forget whose equasion it was, possibly Humlum's. And I'm pretty certain there is a SkS version as well, somewhere.
- CO2 lags temperature
MA Rodger at 06:40 AM on 26 February, 2014An interesting collection of denialist writing being linked @430 (Shaviv, Scarfetta & Solheim-Stordahl-Humlum). I'm not sure what we are supposed to make of them.
The different ilk of "It's the sun wot done it" messages are together rather contradictory. Shaviv's the one who tries to demonstrate ocean heating has an 11-year cycle, good ole Scarfetta fits global temperature to pretty-much every pulse-beat in the solar system with the one exception of the 11-year solar cycle, and the not-to-be-outdone Humlum in that linked paper fits Svalbard temperatures to the duration of the previous solar cycle.
And the other puzzle is - What has this collection of tosh got to do with the subject of CO2 lagging temperature? Anybody any ideas? - MP Graham Stringer and CNN Crossfire are wrong about the 97% consensus on human-caused global warming
Rob Honeycutt at 11:35 AM on 15 February, 2014Russ @8... Jeez, I wish you guys would apply even just a tiny fraction of scrutiny to the claims a wide range of high profile individuals who challenge man-made climate change.
Why not apply the same level of scrutiny to WUWT. Or to ClimateAudit. Or Pielke, Curry, Tol, Monckton, Ball, Carter, Humlum, JoNova, or any of a very very long list of people who torture the facts.
The OFA drops in one word that oversteps and all hell breaks loose. All the while, others on the "skeptic" side get away with intellectual murder.
- US school infiltration attempt by Heartland’s IPCC Parody
Dikran Marsupial at 03:10 AM on 2 November, 2013jdixon1980 The NIPCC report relies heavily on the paper by Prof. Essenhigh that appeared in Energy and Fuels, but fails to mention the paper (written my my alter ego), which explains the errors in Essenhigh's paper and shows that a short residence time is completely consistent with the rise in CO2 being 100% anthropogenic (see here for details). According to Google scholar, Prof. Essenhigh's paper has only been cited eleven times (i.e. it has generated more or less zero interest outside the blogsphere) one of those was my rebuttal and two relate to the rebuttal by the EPA. That the authors rely so heavily on a paper that has been cited so little, and fail to mention (nevermind address) the refutations, is not suggestive of good scholarship.
The most cited paper that references Prof. Essenhigh's paper is the one written by Humlum et al, which was cited 10 times, and two of those are refutations (there was a third that Google Scholar doesn't seem to have found yet, for details, see here). Sadly, those who can't learn from history are doomed to repeat it.
- An accurately informed public is necessary for climate policy
Rob Honeycutt at 07:48 AM on 30 July, 2013This is yet another denier tactic coming from Barry. They create impossible barriers of perfection for climate scientists and never expect anything close to the same from their own side.
Barry, this website is brimming with outrageous examples of "skeptics" propagating any number of completely ludicris claims. Where is your incredulity over them?
I'm waiting for a wide range of corrections from Pielke, Spencer, Christy, Watts, Goddard, Bastardi, Carter, Taylor, McKitrick, McIntyre, Easterbrook, Kappenberger, Scafetta, Humlum, and a long list of others.
Please let me know when these guys make their corrections and I'll gladly personally lobby John for a correction on the president's tweet.
- Murry Salby finds CO2 rise is natural
Tom Dayton at 23:47 PM on 27 July, 2013Michaelf, a debunking by Masters and Benestad was published in the July issue of the same journal. The article is paywalled, but Masters explained the approach on his blog, and Benestad debunked previous, annoyingly similar "work" by Humlum on RealClimate. Masters discusses their Masters and Benestad critique on his blog, including a discussion by he and Richardson about the complementarity of their critiques.
- Murry Salby finds CO2 rise is natural
Tom Dayton at 23:39 PM on 27 July, 2013Michaelf, Mark Richardson debunked Humlum's 2013 article in the latest issue of the same journal.
- Agnotology, Climastrology, and Replicability Examined in a New Study
sylas at 17:59 PM on 7 July, 2013In the interactive comments for review of this paper, in a reply by Rasmus ("SC C292: 'Reply to Ellestad/Solheim/"klimarealistene"', Rasmus Benestad, 25 Jun 2013"), there is a reference to a scanned copy of a letter:
I will maintain that Ellestad and “klimarealistene” are engaged in a propaganda campain. On February 3rd 2012, Ellestad wrote a letter to the director at MET Norway in an attempt to gag me, after I had commented on the Humlum et al (2011) paper on the website of a Norwegian newspaper. (A scanned copy is available on-line: https://drive.google.com/?usp=chrome_app#folders/0B5ZHm1tjzEtDWjhWZmxIQzVVSWc)
The link provided does not work. Is the scanned copy still available anywhere? Thanks!
- Media Overlooking 90% of Global Warming
Esop at 20:37 PM on 25 June, 2013A very timely article, Dana.
Just this morning, one of Norway's major newpapers, Finansavisen, ran an editorial perpetuating the very same myths.
No surprise, though. Norway has more outspoken deniers per capita than any other nation on earth. Humlum and Giæver are just two of many.
NRK (Norway's BBC) has a bad habit of inviting denialists, but no climate scientists when debating global warming. A well informed denier knows the talking points and will run over a representative from the Green Party andy day of the week.
This is just one tool in the state owned TV Channels quest to form public opinion and gather support for continued explotation of FF reserves in the North Sea and Arctic, securing continuation of major cash flow for the state owned oil company.
- Murry Salby - Confused About The Carbon Cycle
scaddenp at 06:33 AM on 15 June, 2013Well it would have to be published somewhere where reviewers would be unaware of the rebuttal to Humlum and where they were not aware of other methods of determining the contribution (eg d13 isotope balance, Henry's law etc). Good luck on that but then I'm amazed Humlum could find reviewers clueless enough to let his past.
- New study by Skeptical Science author finds 100% of atmospheric CO2 rise is man-made
Dikran Marsupial at 05:51 AM on 14 June, 2013civil engineer, just to clarify, my name is Gavin Cawley (I post pseudonymously, but not anonymously), Prof. Essenhigh wrote the original paper on which mine was a comment. Mea culpa, the link in the earlier post was to Prof. Essenhigh's original paper, rather than my comment paper, which you can find here.
Sadly Prof. Salby's argument is also incorrect (I would be genuinely pleased if it were correct) and I and others have written blog posts on his presentations (my article is the first of those listed, and would be a good place to discuss this further):
Murry Salby's Correlation Conundrum
Murry Salby finds CO2 rise is natural
Murry Salby - Confused About The Carbon Cycle
Humlum et al. make basically the same mistake and another SkS author has published a peer-reviewed comment paper on that one as well, see:
New study by Skeptical Science author finds 100% of atmospheric CO2 rise is man-made
Roy Spencer also made a similar error (happily only on his blog and didn't actually publish it), which I discuss here:
Scientists make mistakes frequently, you are not at the cutting edge of your field if all of your ideas are right, and some errors happen more than once. Sadly climatology gets a fair amount of media interest, so instead of these errors being quietly forgotten, they end up being discussed in public view.
Prof. Salby's new talk seems to have some additional material on ice core CO2 proxy data, but the central argument is still that addressed in my earlier SkS post.
- New study by Skeptical Science author finds 100% of atmospheric CO2 rise is man-made
Paul Pukite at 14:38 PM on 10 June, 2013Using the equatorial SST data for latitudes -6±15 degrees, we can take the Mauna Loa CO2 data and compensate for seasonal outgassing. This has a Henry's Law gain factor of 3 PPM/deg C after applying a lag of 1 month. This simple transformation completely removes the seasonal oscillations, leaving only low-level noise and perhaps a few glitches related to El Nino events (see 1998-1999).

The above figure is the compensated Mauna Loa CO2 data after removing the seasonal IPWP ocean outgassing of CO2. I also placed a polynomial fit as a guid to the eye.

The above figure shows the Indo-Pacific Warm Pool (IPWP) lies within the +9N to -21S SST average. This is the hottest part of the Pacific and should have the strongest activation for CO2 outgassing.
The SST data was taken from a NOMADS server (NOAA Operational Model Archive and Distribution System)
http://nomad3.ncep.noaa.gov/cgi-bin/pdisp_sst.sh?ctlfile=monoiv2.ctl&varlist=on&psfile=on&new_window=on&ptype=ts&dir=The CO2 data was taken from the Mauna Loa records, going back to 1981 to match the archival extent of the SST records
http://www.woodfortrees.org/data/esrl-co2/from:1981I have to say that the available oceanographic and atmospheric data is an amazing resource for debunking claims made by people like Humlum (and don't forget Murry Salby).
- New study by Skeptical Science author finds 100% of atmospheric CO2 rise is man-made
Esop at 09:26 AM on 10 June, 2013This paper from Humlum and similarly nonsensical stuff from the likes of Salby reminds me of the Simpsons episode where Bart is the "I didn't do it" boy. A juvenile display of not being capable of taking any responsibility for own actions. What is next from Humlum and his Norwegian cohorts ? A new paper claiming that humans don't actually emit CO2 at all?
- New study by Skeptical Science author finds 100% of atmospheric CO2 rise is man-made
Eyal Morag at 15:34 PM on 8 June, 2013Real Climate - On Humlum et al.
Humlum find a connection between ENSO and CO2 But don't understand his findings. C. D. Keeling and R. Revelle find and understand this connection at 1985.
El Nino’s effect on CO2 causes confusion about CO2′s role for climate change
Rasmus E. Benestad - Real Climate 11 September 2012
Anyway the same level of logic can find that temp don't connect to CO2 since every year from October to January the CO2 is rising while temp is falling. Just ignore the 1st & 2nd order of CO2 and temp rising.
- New study by Skeptical Science author finds 100% of atmospheric CO2 rise is man-made
william at 06:10 AM on 8 June, 2013"Humlum had just disproved the conservation of mass" Who says scientists don't have a sense of humor. Priceless.
- New study by Skeptical Science author finds 100% of atmospheric CO2 rise is man-made
Bob Loblaw at 04:35 AM on 8 June, 2013With all this discussion of the problems caused by Humlum et al's analysis that differentiates the data first, I am reminded of a math joke told to me years ago by a mathematician friend. (Yes, I know. "math joke" is an oxymoron. Don't ask me to tell you the one about Noah and the snakes.)
Two mathematicians are in a bar, arguing about the general math knowledge of the masses. They end up deciding to settle the issue by seeing if the waitress can answer a math question. While mathematician A is in the bathroom, mathematician B corners the waitress and tells her that when his friend asks her a question, she should answer "one half X squared". A little later, when the waitress returns to the table, A asks her "what is the integral of X?". She answers as instructed, and mathematician A sheepishly pays off the bet and admits that B was right. As the waitress walks away, she is heard to mutter "pair of idiots. It's one-half X squared, plus a constant".
[I'm not sure how much of the joke is a dig at mathematicians who forget some of the basics (the constant), or a dig that mathematicians can only find jobs working as a waitress in a bar.]
But, back to the issue at hand - differentiation will take any constant term and turn it into zero. But to take the flux data and turn in back into a change in storage you have to integrate. And when you integrate, you are in deep, deep trouble if you forget the constant, which is what Humlum et al appear to have done. If you can't figure out what the constant is, then you can't figure out the numerical value of the integration.
Details. Details.
- New study by Skeptical Science author finds 100% of atmospheric CO2 rise is man-made
Dikran Marsupial at 00:18 AM on 8 June, 2013CBDunkerson wrote "How could this Humlum paper have gotten through peer review?"
Peer review can only be expected to be a basic sanity check, and sometimes the reviewers selected may not be sufficiently expert to spot the flaws. The more times a paper is submitted to a journal, the more likely it is that some journal will accept it eventually. Peer review has always been susceptible to the occasional failure, but science has adopted a good way of dealing with bad papers, which is to simply ignore them. The problem comes when papers are written that have impact on the general public that don't have the background to see the errors.
In many fields bad papers draw little attention from anyone, it is the public focus on climatology that means that the bad papers get exposed. If "skeptics" didn't draw so much attention to them in the blogsphere/press, the bad climate papers would be simply ignored as well.
- New study by Skeptical Science author finds 100% of atmospheric CO2 rise is man-made
CBDunkerson at 22:05 PM on 7 June, 2013Mark, while the publication of your analysis is a wonderful response, I have to look at this Humlum paper and others like it with a growing sense of dread. It seems to me as if 'alternative realities' are creeping into science just as they have into politics, journalism, law, economics, and other formerly respectable fields.
How could this Humlum paper have gotten through peer review? Why would Global and Planetary Change publish it? How can the universities that employee the authors not be embarrassed to be associated with this?
I always thought that science was largely resistant to falsification because bad results would inevitably be uncovered and damage the credibility of all involved. Yet we seem to be seeing a lot of clearly wrong analysis getting published and no particular fallout when it is uncovered. Indeed, I doubt the denialsphere will stop praising Humlum in light of your findings... rather they will continue to accept his as valid and reject yours... creating two different views of reality. A situation I view with horror.
Obviously, there has always been fringe 'science' and from time to time it has gotten published... but am I wrong in believing that things have changed in that we are now seeing it actively celebrated and promoted even in the face of proof to the contrary? I fear a future in which publishing bad science can be a path to greater carreer success. Rupert Murdoch's News Corporation routinely puts out false propaganda in the guise of journalims... and is beloved for it. Radical ideologues routinely get appointed to the highest courts despite rulings bearing no resemblance to legal precedent or justice. Raving lunatics frequently get elected to high political office. The whole world is suffering from the guidance of economists who promoted austerity during a massive global recession.
If this kind of madness takes hold in the sciences we are truly doomed.
- New study by Skeptical Science author finds 100% of atmospheric CO2 rise is man-made
Dikran Marsupial at 18:46 PM on 7 June, 2013reality@21 Humlums argument is based on a (already well known) correlation between the rate of increase in atmospheric CO2 and temperature. The rise in atmospheric CO2 is cause by the average rate of increase being positive. Correllations however are insensitive to the average value of the signals, so the correllation between the rate of increase in atmospheric CO2 and temperature can not explain the increase itself.
We know that the rise is caused by human emissions. Atmospheric concentrations are rising more slowly than cumulative human emissions, so consevation of mass means that the natural environment must be a net carbon sink, taking more CO2 out of the atmosphere each year than it puts in. There is a natural contribution, but it is strongly negative.
The reason that there is little rate of increase while anthropogenic emissions have been rising approximately exponentially, is that rising atmospheric CO2 concentrations mean that the natural net carbon sink has been strengtheneing as well. This gives rise to the constant so called "airborne fraction". If you are happy with differential equations, there is a worked example in the paper I wrote which is referenced in my SkS article here.
- New study by Skeptical Science author finds 100% of atmospheric CO2 rise is man-made
gws at 18:40 PM on 7 June, 2013@21
"What you object to in ..."
Please read the article again. You have just created a strawman.
"If the CO2 in the atmosphere ..."
You are beating the strawman, 1. by ignoring the discussion and information given by others before your entry, 2. by ignoring the overwhelming evidence. Pretty much what Humlum et al. did ...
- New study by Skeptical Science author finds 100% of atmospheric CO2 rise is man-made
reality at 17:46 PM on 7 June, 2013What you object to in Humlum's graphs seems to be that the constant nature of the increase in CO2---same gradient---when differentiated produces a flat line, showing that there is no acceleration in the rate of change of CO2.
If the CO2 in the atmosphere was caused by human emissions, with little or no natural contribution, surely the curve would have a changing gradient [no longer linear and constant] depicting the increases in emissions eg with China's huge growth in coal-fired power stations and cars etc in recent years.
- New study by Skeptical Science author finds 100% of atmospheric CO2 rise is man-made
Icarus at 07:43 AM on 7 June, 2013It's sad that we still have to combat such inane nonsense as this Humlum paper. Surely there are better things for intelligent climate scientists to be doing?
- New study by Skeptical Science author finds 100% of atmospheric CO2 rise is man-made
JosHagelaars at 07:15 AM on 7 June, 2013Thanks for the post, excellent work!
Humlum's paper is full of extreme statements, one example: "Empirical observations indicate that changes in temperature generally are driving changes in atmospheric CO2, and not the other way around.". Humlum 'forgot' the existence of ENSO and other factors that have a large influence on the annual growth rate of CO2. Scientific omissions, a professor unworthy.
For Dutch readers, we covered the online release of Humlum's paper in September 2012 on Klimaatverandering - Humlum: over emissies en omissies.
- New study by Skeptical Science author finds 100% of atmospheric CO2 rise is man-made
chris at 06:27 AM on 7 June, 2013MarkR, Don't forget to add Humlum et al to the reference list in your comment when you get the proofs to review!
- New study by Skeptical Science author finds 100% of atmospheric CO2 rise is man-made
MA Rodger at 05:02 AM on 7 June, 2013HJones @6/8/10.
Anthropogenic CO2 emissions 1960-2010 aren't what you'd call "exponential".
The annual rise in atmospheric CO2 did dip in 2011 but this is more attributable to the La Nina event of that peaked in 2008 and far less attributable to the small reduction in CO2 emissions that year.
Some time back I created a graph using actual numbers (GISS temperature & MLO CO2) to rebut one of these Humlum type papers (it may have been the Murry Salby lecture) but the equasion being bandied about has been used with real data 1959-2012 and supports the veracity of Figure 1a in the post above, the green and blue of figure 1 being coloured pinkand red.
- New study by Skeptical Science author finds 100% of atmospheric CO2 rise is man-made
MarkR at 02:30 AM on 7 June, 2013Hi HJones @ #3
I didn't treat them differently. I converted both of them into fluxes and then compared them like-with-like.
Humlum et al's method took all the data they could find and then did something that would turn a lump sum into a flux. But they didn't realise that the human emissions data they took were already a flux. They converted the flux into the rate-of-change-of-flux.
In my comparison I determine an estimated natural flux in ppm yr-1, the human emissions in ppm yr-1 and total atmospheric change in ppm yr-1. Humlum et al instead turned the human part into ppm yr-2, so it is them who treated the human emissions differently from the others.
- New study by Skeptical Science author finds 100% of atmospheric CO2 rise is man-made
Dikran Marsupial at 02:24 AM on 7 June, 2013@HJones, FIgure 1 in AR4 only shows representative volumes of the annual fluxes, it doesn't tell you anything about their variability, which is what Humlums' argument is based on. Sadly Humlum is making pretty much the same mistake as Salby correlations tell you about the similarity of the "wiggliness" of two datasets, but it tells you nothing about their average values. It is the average values of the fluxes that governs the increase in atmospheric CO2, not the "wiggliness", which is why Humlum's conclusions are incorrect.
- New study by Skeptical Science author finds 100% of atmospheric CO2 rise is man-made
Esop at 01:22 AM on 7 June, 2013Excellent!
Over here in Denialostan (Norway), Humlum is heralded as somewhat of a hero and is the man journalists rather often go to when they need an opinion on climate issues. Ridiculous but true.
The anti-science movement has huge momentum up here these days. Almost no attention is paid to the disapearrance of the nearby Arctic sea ice and the huge increase in serious flooding seen over the past few years, the latest deluge still ongoing. Latest poll shows that the majority of the population is not the slightest worried about the rapidly changing climate. Oh well.
- Living in Denial in Norway
Esop at 07:57 AM on 3 March, 2013#19 (gws): A disproportionately large number of the worlds most active climate disinformers are Norwegians. Example: in the case of one the last denialist WSJ Op-eds, a huge percentage, I seem to remember that more than 10% , of those who signed it were Norwegians. That number is quite large considering a population that makes up less than 0.1% of the worlds population.
Some of the most vocal deniers are Norwegians: Giæver, Humlum, Stordahl, Solheim, Ellestad, Brekke, Segalstad, and the list goes on. When the newspapers run specials on climate/weather, these guys are often called on, and rarely the real experts like Benestad, Drange, etc.
For the general population, the winter of 2010 was like pushing a lightswitch. Pre 2010, most Norwegians had good understanding of the problem. Post 2010, climate change has become somewhat of a standing joke, despite increasing floods, etc. Cold winters in 11/12/13 as well as cool and rainy summers, with the MSM reporting next to nothing on the causes of the change has eroded that previous understanding almost completely. Polls have shown that Norwegians are way more skeptical than our neighbors in Sweden and Finland.
- Temp record is unreliable
Dikran Marsupial at 00:52 AM on 8 February, 2013Kevin, climate4you is run by Ole Humlum, who has written a number of deeply flawed papers on climate science, so pointing out that the plot originates from climate4you rather than WUWT does not make it any more authoritative. This doesn't mean that the plot is incorrect, but it is good cause to be skeptical.
- Ridley, Murdoch, and Lomborg Attempt to Greenwash Global Warming
Kevin C at 02:18 AM on 19 January, 2013
Terranova: You are certainly thinking along the right lines. There is a long literature on the relationship between El Nino and/or temperature and CO2 uptake, e.g. Barcastow 1976. The rate of CO2 change in the atmosphere lags the temperature change, showing that temperature or El Nino are driving the effect.
This has fooled some skeptics who haven't read this literature (e.g. Humlum) into thinking that temperature is causing CO2 emission, when in fact the emissions have been more steady and the rate of uptake has varied. - Solar Cycle Model fails to predict the recent warming
MA Rodger at 00:50 AM on 20 December, 2012
These two papers by Solheima Stordahlb & Humlum are classics of the genre - nonsense presented to look like scientific argument. The graph-fest presented in The long sunspot cycle 23 predicts a significant temperature decrease in cycle 24 was the first to be written although the last to be published (allowing both papers to reference each other).
As yet, the authors haven't quite perfected their style. In this first paper they are quite insistant that just "looking at" their graph of sun cycle lengths "tells us that we can expect several long cycles in the next decades" which their analysis says is indicative of very low NH temperatures.
What is remarkable by its absence in these two papers is intelligent comment about the temperature records since Sun Cycle 23 ended. These are the ones that will contribute to the low average temperatures they are predicting for Sun Cycle 24.
The nearest they get to such a comment is in their second paper Solar Activity and Svalbard Temperatures where they suggest a small drop in Winter temperatures in 2009 &10 may point the way to their predicted freeze up. Yet this 2009/10 Winter record is hardily even a straw to grab onto.
These jokers are predicting Svalbard temperatures will drop "from −4.2°C in SC23 to −7.8°C, with a 95% confidence interval [−5.8 to −9.6]°C in SC24." This is their grand finding, the whole reason for the paper. And why not? Svalbard's annual and winter mean temperatures "are completely described by the PSCL-model" that they created.
To achieve this lower annual mean, given the 2009-2011 mean at −3.76°C is even higher than the mean for SC23 (also noting the all-time record high for winter 2011-12) and also given the last 12 months could be taken as a reasonable value for the 2012 mean temperature (−1.87°C which would be the second highest annual mean on record), then the average over the remaining years of Sun Cycle 24 to achieve the temperature drop forecast by our trickster trio would have to be −10.4°C, with a 95% confidence interval [−7.6 to −13.2]°C.
If you bear in mind the coldest single year on record for Svalbard (from 1912) is −10.4°C, never mind "even less likely," can we really take these jokers seriously? - The Latest Pre-Bunked Denialist Letter in Lieu of Real Science
Esop at 20:30 PM on 3 December, 2012
It is pretty describing that out of the 17 denialists mentioned in the article, no less than three of them (Giæver, Humlum, Solheim) all come from a tiny, semi Arctic country with a population of not much more than 4 million. These disinformers get quoted frequently in the national press, while those top level climate scientists who produce real science (Benestad, Drange, etc) rarely get any mention and have their replies to the frequent denialist Op-eds censored, etc.
2012 was a game changer in the US, and it looks like the population finally woke up, thus the increased desperation of the denial industry. For Europe, and especially Northern Europe, the opposite is the case. A cold and wet summer has now been replaced by frigid winter conditions, due to the negative NAO. As a result, denialism is thriving. - Humlum is at it again
john byatt at 10:10 AM on 15 November, 2012
Classic read a bit of the paper, thought, not again,
googled :"Humlum is at it again" Great heading
. - PBS False Balance Hour - What's Up With That?
Kevin C at 00:52 AM on 20 September, 2012
DSL: I think you've made a critical point here.
To underline it, I think any analysis would conclude that climate science is knowledge-seeking - it is developing a single unified understanding of climate, consistent with observations and with the laws of physics. Details change in the light of new evidence, but the size of the changes is declining, i.e. the process is gradually converging.
By contrast, most climate skepticism is knowledge-avoiding, and thus is correctly classified as a form of denial. Climate skeptics are almost without exception not building a comprehensive and consistent understanding of reality - often they raise problems with existing theories without any interest in providing an alternative understanding, or they advance explanations which address microcosms of the data without attempting to fit them into a broader understanding (e.g. the Humlum paper), or they simply look for evidence that the science is unknowable.
The distinction is somewhat congruent to Lakatos' distinction between progressive and degenerate research programs,
Of course raising problems with existing theories is a valuable activity if done within a knowledge-seeking framework. I guess one source of confusion to the public is in the distinction between a paper which critiques a theory in order to increase knowledge and one which critiques a theory in order to avoid knowledge. - How to Solve the Climate Problem: a Step-by-Step Guide
M Tucker at 03:07 AM on 14 September, 2012
Depending on “media” is the huge shortcoming of the educational approach. The average reporter, either print, TV or even NPR (here in America), has, for the most part, the same shortfall in science education as Americans in general. Even those reporters who have graduated from prestigious universities are not qualified to investigate science issues. We do have some very good science reporters who have studied science and who regularly report on scientific issues but they are definitely not mainstream. They appear in science magazines or occasionally are printed in newspapers. Even NPR only has one program a week, two hours only, that is not available on all public radio stations and if available they may only run one of the two hour segments. The last time I heard an interview on one of my local public radio stations with Michael Mann a disappointingly large fraction of the callers were parroting the same old denier hogwash we have all heard for years. Michael Mann did a good job of defending the science but the host had little to add and his questions revealed a clear misunderstanding of the science. If he had read “Dire Predictions” the important bits did not sink in.
Also we are still dealing with scientists who actually have positions in climate science at universities who reject the scientific consensus. Christy immediately comes to mind. So reporters do not need to use someone like Watts to present the opposing view they can get Dr. John Christy Director of the Earth System Science Center at the University of Alabama. That sounds pretty impressive to someone, even the reporter, who is not familiar with the debunking of Christy’s opinions. Then we have people like Humlum who manage to get worthless papers published in respected science publications.
I listened to a report on NPR today, by a seasoned reporter, who managed to completely miss an opportunity to educate the listeners on a critical piece of the story. I was dumfounded. I will not go into the whole thing but simple important information can be completely overlooked by both the reporter and her editors when reporting on science or, in this instance, health and nutrition.
I have no good solution for this other than depending on actual qualified educators and increasing the science requirements in public schools. After all, not everyone will continue with schooling past high school. - Murry Salby's Correlation Conundrum
Doug Bostrom at 03:46 AM on 13 September, 2012
An excellent comment at RC by Christoffer Bugge Harder, pointing out the failure by Humlum et al. to account for carbon isotope ratios and C02 uptake in the ocean that can only be termed as blatant disagreement with their hypothesis.
Comment is here.
Harder's final suggestion applies to a number of scientists who have compromised themselves over AGW. The scientific community as a whole could be of better assistance to the public in evaluating outlandish claims. Crank or liar? Sometimes choices funnel down uncomfortably tight; charitable instincts suggest the former as opposed to the latter. - Murry Salby's Correlation Conundrum
Stephen Baines at 00:50 AM on 12 September, 2012
Ugg. As I stated at RC, I honestly do not understand how that Humlum paper gets through peer review with that interpretation intact. It such an elementary error in interpretation to think the correlation explains the mean value in annual CO2 change. And it's not as if it isn't well know that ocean pCO2 is increasing, stable isotopes of atmospheric CO2 have changed and we can't account for all anthro emissions. How can anyone think the ocean is a source of CO2 given that fact? Who reviews these things?
I really think Rasmus was too deferential in his evaluation at RC. Sometimes short and direct is the best policy. Long winded rebuttal suggest that there is some meat there. - Murry Salby's Correlation Conundrum
Tom Dayton at 23:55 PM on 11 September, 2012
That Humlum et al. 2012 paper is discussed in a new post at RealClimate. - Murry Salby's Correlation Conundrum
Dikran Marsupial at 21:13 PM on 11 September, 2012
The pre-bunking of Prof. Salby's yet to appear article applies equally well to the new paper by Humlum et al., who make exactly the same mistake of using a correlation between rates to justify conclusions about long term changes. - CO2 lags temperature
Troy_CA at 16:41 PM on 1 September, 2012
David (and others), for a specific response to Humlum et al., 2012, I put up a quick demo of why their method will create misleading results:
https://troyca.wordpress.com/2012/08/31/comment-on-the-phase-relation-between-atmospheric-carbon-dioxide-and-global-temperature/ - CO2 lags temperature
Rob Painting at 20:43 PM on 31 August, 2012
David Sanger - this is much easier if you understand that the oceans are Earth's main heat reservoir. Arguably the greatest climatic effect greenhouse gases exert is that they trap more heat in the ocean.
During La Nina the oceans accumulate more energy - as heat is buried in the sub-surface ocean, and during El Nino this heat wells to the surface and is smeared across the central and eastern equatorial Pacific. Due to these characteristics, and the surface air-sea exchange of heat, the Earth is cooler-than-average during La Nina, and warmer-than-average during El Nino.
But there's more to the story, there are two large competing effects on carbon exchange during ENSO. In a La Nina phase upwelling of acidified deep water along the western coast of North & South America out-gasses CO2 to the atmosphere. But this is more than compensated by the wetter-than-average rainfall which falls over the continents and particularly the tropical river basins of the world. More rainfall over such a vast land area generally means more plant growth and a draw down of atmospheric CO2.
During El Nino the much of the continental land surfaces are drier-than-average. This is because the upwelled heat on the Pacific equatorial ocean surface draws moisture away from the continents, and rainfall is focused over the ocean. CO2 out-gassing may shut off, but again this is more than compensated for by land vegetation. As drought sets in on the continents, vegetation dies and CO2 is released back to the atmosphere. Warming air temperatures also elevate respiration which, again, releases more CO2 back to the atmosphere.
These natural short-term CO2 fluxes dwarf human fossil fuels emissions, but unlike fossil fuel pollution they do not increase incrementally year after year.
It is, of course, more complicated than that. For example the distribution of rainfall is vitally important, but that is the general picture. Armed with that knowledge you can now under see that Humlum & co aren't telling us something we don't already know. They just lack understanding of the physical mechanisms which drive this and, allied to ideological bias, therefore come to conclusions unsupported by the evidence.
As for large volcanic eruptions - they can reduce atmospheric CO2 because they stimulate enhanced plant growth on a global scale. This is accomplished by the volcanic aerosols high in the stratosphere increasing light-scattering which more readily penetrates the leaf canopy. In the absence of other limiting factors, more sunlight equals more growth and hence draw down of atmospheric CO2. You can see this in the graph you presented - after the Mt Pinatubo eruption (1991) even the El Nino of 1991-92 saw a decline in atmospheric CO2 - the opposite of the normal response. - CO2 lags temperature
davidsanger at 18:57 PM on 31 August, 2012
scaddenp @378 Thanks for the link. That explain a lot about the context. I should have thought to search the site first for "Humlum"
KR @381 So if I understand the graph then he's just showing that (sometimes) if the measured CO2 increases a bit more quickly year over year, then the temperatures increase a bit more compared to the previous year, and if the CO2 increase from year to year is a bit more modest the temperature increase is a bit less (or could actually be a decrease since the y-axes have different zero-lines). Whatever is causing the variability from year to year (even noise?) could then affect both measures in a similar manner. And none of this has anything to do with why either measure is trending upwards. Is that close?
skywatcher @379 so would effects of ENSO and volcanic activity account for the seeming lag in the graphs where temperature differentials from the previous year appear to increase or decrease 12 months or so before measured CO2 differentials from the previous year? - CO2 lags temperature
KR at 14:46 PM on 31 August, 2012
David Sanger - and other readers: The simple lesson from this particular paper is this:
If someone de-trends the data, as Humlum did in that graph, they are no longer examining the trends, and therefore cannot conclude anything about them.
This is actually a fairly common mistake - any number of papers have filtered out the trends, and then attempted to state conclusions about the very data they have excluded from analysis. Very sad... - CO2 lags temperature
skywatcher at 14:38 PM on 31 August, 2012
David, all that graphic shows is that detrended air temperature, which is mostly ENSO and occasional volcanic influences, is related to detrended CO2 with the annual cycle removed too. So there is a relationship betweent he variability of both graphs, no surprise there. It says absolutely nothing about what is causing the overall rise in either one, though clearly the skeptics would want you to believe that ocean temperature rise is causing CO2 rise.
They ignore many things:
1: what is causing ocean temperature to rise?
2: why is ocean pH decreasing, if CO2 is being released from the oceans (which should cause pH to rise)?
3: Where is all our CO2 going? We release ~30GT per year, yet annual CO2 rise is only half that. [the truth is that it is going into the oceans, acidifying them.]
4: As linked above, the chemical signature of the CO2 is that from FF-derived carbon, shown by several independent lines of evidence.
So lots of suspension of disbelief required before you can accept the Humlum paper. In fact, I suspect I'll find the suspension of disbelief when watching The Hobbit later this year a whole lot easier! - CO2 lags temperature
Rob Painting at 13:38 PM on 31 August, 2012
David - you really do have to wonder how such nonsense gets published. Ocean acidification i.e. the increase of global atmospheric carbon dioxide dissolved in sea water renders the thrust of this paper null & void.
For a relatively thorough treatment of this subject I'd recommend this SkS post: Climate Change Cluedo: Anthropogenic CO2
Where does Humlum think all human carbon dioxide emissions are disappearing to anyway? - CO2 lags temperature
davidsanger at 13:20 PM on 31 August, 2012
Could someone comment on the paper released today in Global and Planetary Change : "The phase relation between atmospheric carbon dioxide and global temperature" Humlum, Stordahl and Solheim.
Abstract is at http://www.sciencedirect.com/science/article/pii/S0921818112001658 but the full text is behind a pay wall.
"Ice cores show atmospheric CO2 variations to lag behind atmospheric temperature changes on a century to millennium scale, but modern temperature is expected to lag changes in atmospheric CO2, as the atmospheric temperature increase since about 1975 generally is assumed to be caused by the modern increase in CO2."
HIghlights "...►Changes in ocean temperatures appear to explain a substantial part of the observed changes in atmospheric CO2 since January 1980. ► CO2 released from use of fossil fuels have little influence on the observed changes in the amount of atmospheric CO2, and changes in atmospheric CO2 are not tracking changes in human emissions."
Has this paper gone through peer review and what do SKS regulars think of it. What's the issue or explanation? - Solar Cycle Length proves its the sun
muoncounter at 12:35 PM on 30 March, 2012
Solheim, Stordahl and Humlum 2012 (the paper under discussion since this comment) find a negative correlation between solar cycle length (SCL) and temperature change. Shouldn't we look to see if this correlation is consistent?
Referring to Figure 1 from this paper, the graph posted here, the early cycles (1680-1790) are shorter. This was the guts of the Little Ice Age, so short cycles -> cooling.
However, Vaquero and Trigo 2012 report an interesting point:
We have reconstructed the SCL (average duration of 10.72 \pm 0.20 years) during the MCA using observations of naked-eye sunspot and aurora sightings. Thus, solar activity was most probably not exceptionally intense ...
Looking again at the graph, 10.7 years would be very comfortable during those LIA years. However, the Medieval Climate Anomaly (MCA) was a warm period - indeed, in its former identity as the MWP, it is the warm period vital to so manydenia'skeptic' arguments.
So once again, a so-called 'skeptic argument' - solar cycle length - runs both hot and cold. It can be used to justify warming and cooling, as needed to suit the needs of the moment. - Solar Cycle Length proves its the sun
scaddenp at 06:16 AM on 30 March, 2012
tompinlb - there is absolutely no doubt that the climate responds to changes in solar activity and that solar has been major influence in the past. The problem with the solar explanation for current warming is that the solar signal is more or less flat, unlike the past. Solar proponents ask us to believe that a warming comparable with holecene climatic optimum in NH is happening in both hemispheres but without the same solar signal. The signal is consistant with GHG forcings and completely out of scale to other mechanisms. Furthermore, there is the problem of explaining why the measured increase in GHG forcing somehow is not involved in the warming. Do you have a problem with the instruments doing the measurements?
The idea that actual temperatures have "increasing diverged" from IPCC models is just denialist posturing. Some detail can be found here. Furthermore the Rahmstorf and Foster paper reveals the signal more clearly when natural variation is removed. While the natural variation estimates are indeed curve-fitting, the scale of change in the natural forcing considered (temperature diff compared to change in energy), is believable from physics point of view (unlike humlum's effort). - Solar Cycle Length proves its the sun
Doug Hutcheson at 19:21 PM on 29 March, 2012
tompinlb @ 17, you speak of "Archangel Russia with a change of 0.14 degC per decade" and then state "This station has experienced a rate of temperature change that is 300 percent of the average rate of change shown for HadCRUT3", yet earlier you made the point "the average for HadCRUT3N in this same table is shown as 0.47 degC per decade". I am confused, or misreading the figures, but 0.14 is not 300% of 0.47 in my book. Have I misunderstood something?
Your final sentence reads "They only make the argument, and provide the evidence to support the argument, that previous solar cycle length explains from 40% to 60% of the historic change in temperatures in the stations that they investigated". I think you are mixing up correlation with causation. They have identified a weak correlation between temperature change and previous sunspot cycle length, without suggesting any mechanism by which the previous cycle is implicated in causing the temperature change. The apparent correlation is a curio, no more. As stated in the paper: "This indicates a possible existence of a physical mechanism linking solar activity to climate variations", which is really no more definite than linking hem-lines with global warming, or even hem-lines with solar cycles.
They conclude "This indicates a connection between the behavior between the solar dynamo and temperatures on the Earth". Of course there is a connection! The forcing from TSI is already well explored and is taken into account when modelling future climate change, along with all the other known forcings. The observed influence of variations in TSI is slight and does not lag the solar cycle by 6 years, or 12 years, or any other arbitrarily selected time span.
I would reword the final sentence of your comment @17 like this: "They make the allegation, without providing satisfactory evidence to support the allegation, that previous solar cycle length explains from 40% to 60% of the historic change in temperatures in the small sample of stations that they investigated, without proposing any credible mechanism by which this may have occurred and without showing how this mechanism has affected global mean temperatures.".
If the authors had come up with a new theory that invalidated what we know already about forcings on climate, they would be in line for a Nobel Prize, instead of being relegated to publishing in a fringe journal.
I believe I speak for everybody on this forum in saying we would be thrilled to discover that AGW is not real and we can all sleep easy in our beds. The Solheim, Stordahl and Humlum paper has not done anything to refute AGW, unfortunately for us. - Solar Cycle Length proves its the sun
scaddenp at 06:08 AM on 29 March, 2012
Journal of Atmospheric and Solar-Terrestrial Physics? They also published Scafetta's climatastology paper. Did they publish Humlum's 2011 nonsense too?
What's intriguing here is the idea that a very small forcing in sun can account for temperature variation, yet much larger forcings do not. However, like Scafetta's curve-fitting, it makes predictions that can be quickly refuted. However, because of the nature of curve-fitting, I am sure some new and exciting other variable will found by skeptics when these have failed. - Solar Cycle Length proves its the sun
tompinlb at 14:13 PM on 28 March, 2012
A new paper presents evidence that changes in solar cycle length can account for roughly 40 to 50 percent of the historic change in average temperature at a number of stations in coastal Norway. See Solheim Stordahl and Humlum, The long sunspot cycle 23 predicts a significant temperature decrease in cycle 24, in Journal of atmospheric and solar terrestrial physics, February 2012. The scientists have found that in this area, the solar cycle length is predictive of temperatures after a delay of 9 to 12 years, which delay they believe is related to the time frame for solar influences in the tropics to affect the north Atlantic ocean near Norway. They also make a very specific prediction that the extended length of solar cycle 23 will lead to significant cooling in their area of study. This theory will be tested as we see what happens with temperatures over the next ten years. If they are correct, then solar influence on temperature is much more significant, and the effect of co2 much less significant, than the consensus climate science would argue. - New research from last week 10/2012
Flakmeister at 10:02 AM on 15 March, 2012
JE Solheim as in
http://junkscience.com/2012/03/14/solheim-the-long-sunspot-cycle-23-predicts-a-significant-temperature-decrease-in-cycle-24/
and yes that Humlum... Ole! Ole!
Seems I just got my self banned from junkscience for having the temerity to rip apart (using facts nicely, I might add!) every posting on oil/energy over the past few days...
I guess you are not allowed to respond to Milloy calling Obama a Marxist...
And saying Inhofe is a hypocrite for not adhering to Isiah might not of helped...
;-) - New research from last week 10/2012
KR at 07:43 AM on 15 March, 2012
Flakmeister - Which paper, which Solheim? Note that there is a JE Solheim who frequently works with Dr. O. Humlum, whose papers have been roundly criticized and refuted. - 2nd law of thermodynamics contradicts greenhouse theory
scaddenp at 11:57 AM on 24 February, 2012
"is there something wrong with NOAA and ISCCP data ?"
No, only with Humlum's representation of it. Read their website instead. (And put "humlum" into the search box here for more examples of stuff from him).
And if you look closely, you will see the textbook that the data came from. And below it, the link to Science of Doom which goes into the science behind your questions in considerable detail over a 10 part series. I highly recommend you to look at it. More detail than a blog commentary can give plus links to the textbooks and papers. - Is there a case against human caused global warming in the peer-reviewed literature? Part 1
Jim Powell at 09:43 AM on 10 November, 2011
Humlum has no papers in the WoS under Meteorology Atmospheric Sciences, the criterion that I used. - Is there a case against human caused global warming in the peer-reviewed literature? Part 1
skywatcher at 08:34 AM on 10 November, 2011
Chris Shaker, Ole Humlum's been publishing for a great many years, often not specifically on climate, or specifically skeptical of it. If the article is not explicitly negative or doubtful of human-caused global warming, it's not icluded, so nearly all Humlum's papers don't count for this purpose.
Recently he's become prominent in Norway as a skeptic, and regrettably he seems to have dropped his previously excellent science standards along the way. Humlum's most recent paper probably does count for the list; sadly it's a tragic case of regional curve-fitting climastrology that has little basis in science. That fits nicely with the list above. - Is there a case against human caused global warming in the peer-reviewed literature? Part 1
cjshaker at 08:15 AM on 10 November, 2011
How sure are you that this list is accurate?
Just looking at Dr. Ole Humlum. He is listed as having 0 peer reviewed papers which cast doubt on the AGW hypothesis.
Found a list of his peer reviewed papers. He has 86 of them, according to this reference:
http://www.climate4you.com/Text/BIBLIOGRAPHY%20OLE%20HUMLUM.pdf
I find something that looks like 'CO2 hypothesis' in several of them.
Chris Shaker - Crux of a Core, Part 3... Dr. Ole Humlum
KR at 03:09 AM on 5 October, 2011
citizenschallenge - That site, and Ole Humlum in general, have been discussed here. Search on "Humlum", which will take you to here, here, or here.
Ole Humlum has repeatedly focused on the GISP2 core (a local record), leaving out or incorrectly matching the recent instrumental record, cherry-picking short time frames, and in general making a hash of the data to support his "it's not happening" points.
Rob Honeycutt's Crux of a Core series addresses this topic quite thoroughly. - Crux of a Core, Part 3... Dr. Ole Humlum
Stig Mikalsen at 09:05 AM on 16 September, 2011
Thanks Rob. Then there should be more posts relating to his website ;) It is clever, but misleading.
To the diagram/chart:
Humlum may have adjusted the chart, but his a priori belief is that CO2 has nothing to do with global warming. The chart, adjusted or not, reflects this belief.
So my main point was the general one that he is still using the diagram with this particular combination of temperature and CO2 to prove that "The past temperature changes show little (if any) relation to the past atmospheric CO2 content" And "It can, however, from figures [2,] 3 [and 4] be concluded that the temperature increase 1975-2000 is not unique when compared with past records, and that the net effect on temperature by atmospheric CO2 has been small or even absent"(From Humlums site
Besides this very doubtful (a priori) conclusion and use of data, if I understand you correctly there are also these issues:
1. He knows of this post, but still uses the lowest estimation in Box et al 2009 (which he refers to as Brox et al 2009)
2. He is still using a local record, your main point of misrepresentation of GISP2
3. Box et.al. 2009 end their data in 2007, but Box has an additional three years of data that Humlum is not using.
4. He is still using a CO2 record that ends in 1777
To me that makes his diagram/chart five times misleading, but I may be wrong. - Crux of a Core, Part 3... Dr. Ole Humlum
Rob Honeycutt at 02:34 AM on 16 September, 2011
Stig... I think he did adjust the chart but only to reflect the very lowest possible value presented by Dr Box's data. I'm going to take the long term approach to this and contact him when Dr Box publishes newer data. And I'll continue to contact Dr Humlum on an ongoing basis as newer data becomes available.
The good news here is that because SkS has become a popular destination for people researching climate change issues, our articles on Humlum are more likely to come up in a google search than Humlum's site. So, people are more likely to learn about Humlum's site from us than anywhere else. In essence, we get to frame his work prior to people reading his work. - Crux of a Core, Part 3... Dr. Ole Humlum
Stig Mikalsen at 02:11 AM on 16 September, 2011
I just took a look at Humlums website and he is still using the same diagram. He also defended the use of it in Teknisk Ukeblad (may) now in august.
Rob @2 "I've told Dr. Humlum about this post but he says he's off on another trip into the field with students and will be out of touch. He might pop in to comment once he's back from that trip".
I think he's back from that trip since he is constantly updating his website (but not the diagram and his a priori denialist beliefs). Perhaps Rob should write him again? - Are you a genuine skeptic or a climate denier?
KR at 01:33 AM on 2 June, 2011
J. Bob - I thought some of the data on the climate4you site looked familiar. It's run by Ole Humlum.
See the two threads on Humlum's previous work here and here. His data is heavily cherry-picked to present a particular point of view, which is exceedingly poor science.
As you yourself have noted, it's worthwhile to consider the presenter and the quality of their scientific endeavors. Sites like climate4you, jonova, co2science, WUWT, ClimateRealists, ClimateAudit, and the like are much less credible as a result - their past work (to put it somewhat politely) stinks. - Humlum is at it again
Mighty Drunken at 22:47 PM on 24 May, 2011
I do think that Dr. Humlum et al may be correct on the problems of assigning a quantitative value for the probability of AGW. I think this is more a problem for the science of complex systems, not a massive flaw in "AGW theory". Some things are just too complex for us to assign definite values for.
What really irks me in the opinion piece is this part;
"The CO2-hypothesis as it is formulated right now does not even fulfills the requirements of science, so we are miles away from being able to calculate a meaningful certainty on it. The reason for its lack of scientific foundation is the lack of ability for the CO2-hypothesis to come with forecasts that can be checked now or within a couple of years' time."
They seem to be trying to redefine science to exclude complex systems which take a long time to change, or are in the distant past. Things like cosmology, evolution and climate science. They take an extreme view of falsifiability which goes much further than Karl Popper's. Reading Popper talk about evolution in regard to falsifiability is quite enlightening, especially as his views change with time becoming more favourable to the idea that Darwin's theory is testable. - There's no correlation between CO2 and temperature
Tom Curtis at 23:55 PM on 16 May, 2011
michaelkourlas @6:
First, as Dr Humlum knows very well, the temperature record of any single site makes a very poor proxy for global temperature. Any such site will always show far more variability than a true global temperature because other locations across the globe will not warm or cool synchronously with the first location. This is easily seen in the following graph of several proxies for temperatures at individual locations during the holocene:

As you can see, the individual temperature proxies are all over the place, and the GISP2 record (light blue), which shows four of the five highest peaks, is probably the most variable amongst them.
Of course, as you can also see, if you take an average of the individual records there is very little remaining variability, compared to that of GISP2 alone. Indeed, taking a multiple proxy mean shows global temperature variability to be confined to a 1 degree C range, not the 2 degree C range Dr Humlum would have you believe.
The multi-proxy mean is not the best reconstruction. This is so because it treats individual site specific reconstructions as of the same value as multi-proxy regional reconstructions; and also because of the eight reconstructions used in this case, only two are from the tropics (33% of the Earth's surface), only two from the Southern Hemisphere extra-tropics, in both cases from Antarctica, and the other four are from the Northern Hemisphere extra-tropics. Without this Northern Hemisphere bias, it is likely the reconstruction would show even less variability.
As can be seen from the diagram below, Dr Humlum chose to compound the misleading choice of a very variable single site proxy by using global mean temperatures (which because they are a global average have low variability relative to single sites) to represent the modern era. In this way the false impression is created that modern global temperature temperature change is much less than past episodes, whereas modern global temperature are at levels rarely if ever exceeded in the Holocene.
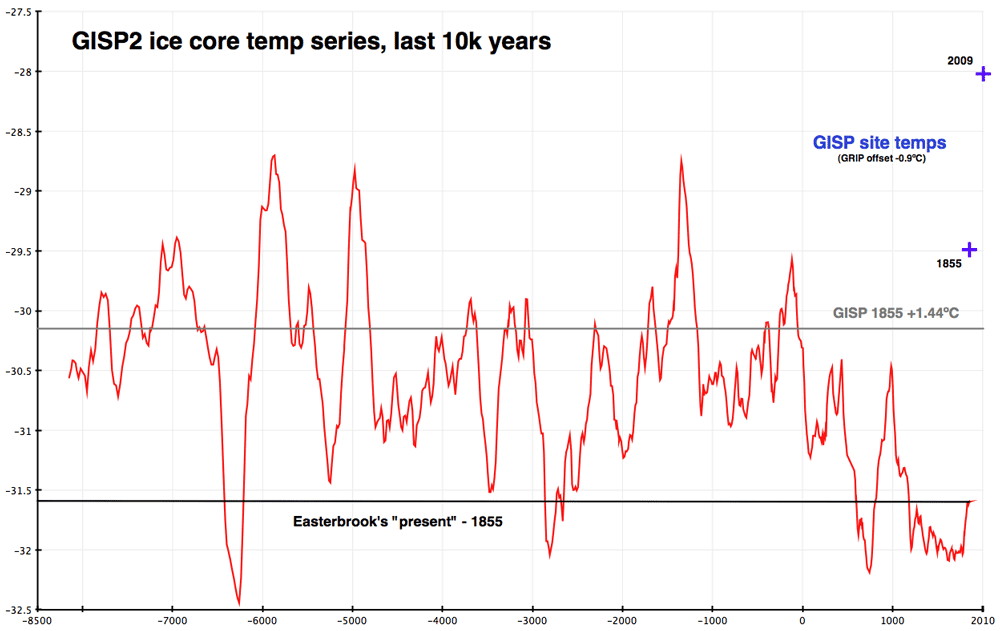
Second, the range of CO2 levels over the Holocene as shown by the Epica core is just 20 ppm. A increase of CO2 from 260 to 280 ppm will result in an increased forcing of just , and a temperature increase of just 0.4 Watts/m^2, and a temperature increase of just 0.32 degrees C. That is significant enough, and may well be why the Holocene has not slid into another glacial, unlike the previous inter-glacials. But it is certainly not enough to swamp the many forms of natural forcing, being of a similar magnitude to changes in solar forcings over the last two thousand years, and smaller than changes to volcanic forcings.
So, to summarize, variation in Holocene temperature is much smaller than Dr Humlum purports it to be, and CO2 variation is sufficiently small for non-CO2 forcings to be the primary drivers of temperature in the Holocene. Dr Humlum knows this. I wonder why he does not mention it? - Crux of a Core, Part 3... Dr. Ole Humlum
julienx2k2 at 07:46 AM on 11 May, 2011
Humlum has striken again this week... Using Fig. 1 without even changing anything, in a full page article in a weekly newspaper for Engineers (Teknisk Ukeblad).
Given that you shared your comments with him and he didn't even took them into account in his latest achievement (I wish you could read it, it is worth it, full of classical denier's arguments), Bjarne is right, Humlum is a real denier. - Crux of a Core, Part 3... Dr. Ole Humlum
Bjarne Mikael Torkveen at 05:46 AM on 2 April, 2011
Being a Norwegian citizen, I know how the Norwegian climate deniers operate. Ole Humlum is a climate denier in the true meaning of the term. He is not as flexible as Rob Honeycutt might think. Don't be fooled by his "charm", Rob. He likes to spread confusion and misrepresentations. His favourite arguments are: "Global warming stopped in 2000", "it's the sun" and "it's cosmic rays". As the majority of the audience on this site speaks English, I can only supply a limited amount of articles featuring Humlum, but here's one: "Another Unfortunate Truth – Global Warming Stopped" - Crux of a Core, Part 3... Dr. Ole Humlum
Tom Curtis at 15:20 PM on 1 April, 2011
I am unsure if this is the best place for this comment. However:
One piece of data that Dr Humlum presents is the correlation between global temperatures and the angular velocity of the Earth's rotation (or the inverse of the length of the day).
Humlum comments:
"The length of day (LOD) as shown above are subject to variations due to variations in oceanic tides (smaller than 0.03 ms in absolute value), variations in the atmospheric circulation, and to internal effects and to transfer of angular momentum to the Moon orbital motion. Also the dynamical influence of the liquid core of the earth may account for slow variations, but then generally expressed as overall long-term trends (Akoi et al. 1982).
The above diagrams show that periods with relatively high planetary rotation velocity (and low LOD) tend to be associated with relatively warm periods, and vice versa. Good examples are the peak of LOD in the early 20th century, concurrent with the last cold spell of The Little Ice Age and the loss of Titanic. Also the cold period 1965-1977 was associated with long day length (high LOD) and low planetary angular velocity. The generally increasing rotation velocity of Earth (and decreasing LOD) since then has taken place along with the period of late 20th century warming. Variations in LOD has also been associated with the Atmospheric Circulation Index (ACI) and variations in commercial catches of different fish species. Some of these associations are thoroughly described and discussed by Klyashtorin and Lyubushin (2007)."
Given the fact that some deniers claim there is a causal connection between the Length of the Day and global temperatures, with changes in the LOD causing changes in global temperatures, it is questionable that there is no discussion of (or mention of) glacial mass balance in the same context.
Looking closely at the LOD signal, it is very plain that there is a seasonal signal. The Earth has a longer day (ie, it spins slower) in the Northern Hemisphere winter. The cause of this is easy to attribute - snow. In the NH winter, large areas of the Earth are covered by a thick blanket of snow. The snow is, in the summer, found in the oceans, but in the winter it is found on land, and hence (on average) at several hundred meters greater altitude. Because of conservation of momentum, this shift of mass slows the Earth's spin, and hence lengthens the day.
The annual trend in changes of the LOD have similar magnitude to the seasonal variations. (The change in the 37 month mean of the LOD from 1972 to 2009 was approximately 0.003 seconds, while the seasonal variation has a range of about 0.0015 seconds.) It is also not a monotonic trend. Therefore whatever the cause, we do not expect the Earth to shed and regain angular momentum, but rather only to shed and regain angular velocity. This means the cause must involve changes in the relative locations of significant masses.
As hinted at above, the larges temperature correlated change in distribution of masses at the Earth's surface is the change in glacial mass balances. As glaciers melt, the melt water finds itself either directly or indirectly in the sea, thus redistributing the mass by up to 10,000 km towards the Earths axis. Because tropical glaciers can be involved in this mass redistribution, the relative size of the effect for a given mass moved should be larger than the seasonal snowfall effect as tropical and subtropical glaciers are further from the Earth's axis of rotation.
Following are the changes in mass balance for non-polar glaciers, and for Greenland. Clearly it would be very difficult to predict the change in the LOD from known changes in glacial mass balance, but it appears to me that the pattern in those changes can be seen as a long term trend driven by loss of mountain glaciers, modulated by the changes in Greenland's mass balance. The changes in Greenland's mass balance are, of course larger than the changes in mountain glaciers in absolute terms, but Greenland is much closer to the axis of rotation.


- Crux of a Core, Part 3... Dr. Ole Humlum
Rob Honeycutt at 10:00 AM on 1 April, 2011
Tom Curtis... I don't disagree. Humlum has been very nice in my exchanges with him so I'm trying to give him the benefit of the doubt here.
You're right, though, I think it's silly to use GISP2 as a definitive proxy for the Holocene. Even as a local measure of temperature I think it's dicy at many points. I seem to remember Dr Alley saying that there are parts of the record that are reflective of other things like snow drifts, and I believe Grootes 1993 (pointed out in Crux of a Core 2) states "The small Holocene O18 fluctuations of 1-2 occur too frequently to allow an unambiguous correlation between the cores."
In other words, as far as I understand it, GISP2 is a fantastic record to study events like the Young Dryas but trying to infer Holocene temperature is more of a stretch. And that's pretty much my objection to almost every use of GISP2 that I see out there in the blogosphere. People, Dr Humlum included, are using GISP2 in an inappropriate manner. - Crux of a Core, Part 3... Dr. Ole Humlum
Tom Curtis at 09:39 AM on 1 April, 2011
Rob Honeycutt @2, having read some of the site, I think you are bing to kind. Anyone who can give as detailed a comparison of "global" temperature indices as he does without mentioning that only one of them is truly global is being very selective in the data they present to the public.
Specifically in the case in question, any comparison between a local temperature record alone, and the global CO2 record is obviously invalid. What is more, I would suggest that any such comparison that fails to mention the host of factors causing additional variability in local temperatures compared to global temperatures (something entirely missing from his commentary) is inevitably misleading, and obviously so. Given that there are a significant number of reconstructions and/or proxies available that would give a better approximation of the global temperature record over that period, his choice of the very variable Greenland record is tendentious.
Further, it is well known that CO2 levels have been rising in the atmosphere since the invention of agriculture due to changes in land use, mostly in the form of deforestation and the extension of wetland methane emission due to rice cultivation. This, clearly is something that should be discussed in any comparison of the Holocene CO2 record with temperatures, and is entirely missing from Dr Humlum's commentary. At the same time, any comparison of CO2 and temperature from before the Holocene, ie, when human activity is in fact irrelevant, is entirely missing from his page. That cannot be accidental. - Crux of a Core, Part 3... Dr. Ole Humlum
pbellin at 05:24 AM on 1 April, 2011
A rolling stone gathers no moss. Here is a gem from the referenced web site:
"According to ice core analysis, the atmospheric CO2 concentrations during all four prior interglacials never rose above approximately 290 ppm; whereas the atmospheric CO2 concentration today stands at nearly 390 ppm. The present interglacial is about 2oC colder than the previous interglacial, even though the atmospheric CO2 concentration now is about 100 ppm higher."
This is based, I believe on a single ice core, the Vostok Ice core in Antartica. The figure discussed in this post is just below the gem above. I imagine Dr. Humlum forgot to update the Greenland temps to the most recent date, and forgot to mention that the forcing from changes in carbon dioxide have not all been realized. I imagine this web site would provide a treasure trove of topics for brave-hearted debunkers. - Crux of a Core, Part 3... Dr. Ole Humlum
Rob Honeycutt at 05:18 AM on 1 April, 2011
i have to say, Dr. Humlum has been very gracious in my communication with him. I wouldn't lump him in with the denier crowd at all. He's closer to a true skeptic but definitely with a lean toward "it's not so bad" as far as I can tell.
I've told Dr. Humlum about this post but he says he's off on another trip into the field with students and will be out of touch. He might pop in to comment once he's back from that trip. - Crux of a Core, Part 3... Dr. Ole Humlum
bibasir at 05:04 AM on 1 April, 2011
Great post! It is a shame that the likes of Humlum couldn't be put at the bottom of the hill to await the return of the boulder. He would excape the boulder if he would update his chart with the 2010 number and the CO2 for the present. Even though the addition of 2010 does not make the chart more accurate, atleast it shows the spike up to past records in one year. - CO2 effect is saturated
Norman at 17:28 PM on 11 November, 2010
#57 scaddenp
The person who runs Climate4you, has a lot of peer-reviewed publications. - It hasn't warmed since 1998
michaelkourlas at 13:52 PM on 26 January, 2010Look at this link for information on global warming stagnation since 2002: LINK The site is run by Ole Humlum, Professor of Physical Geography at the Department of Geosciences, University of Oslo. He says that "all five global temperature estimates presently show stagnation, at least since 2002. There has been no increase in global air temperature since 1998, which was affected by the oceanographic El Niño event. This does not exclude the possibility that global temperatures will begin to increase again later. On the other hand, it also remain a possibility that Earth just now is passing a temperature peak, and that global temperatures will begin to decrease within the coming 5-10 years. Only time will show which of these possibilities is the correct."
More than 100 comments found. Only the most recent 100 have been displayed.
More than 100 comments found. Only the most recent 100 have been displayed.


THE ESCALATOR

(free to republish)