


 Arguments


What’s going on with the Greenland ice sheet?
Posted on 31 August 2022 by Guest Author
This article by Alun Hubbard, Professor of Glaciology, Arctic Five Chair, University of Tromsø is republished from The Conversation under a Creative Commons license. Read the original article.
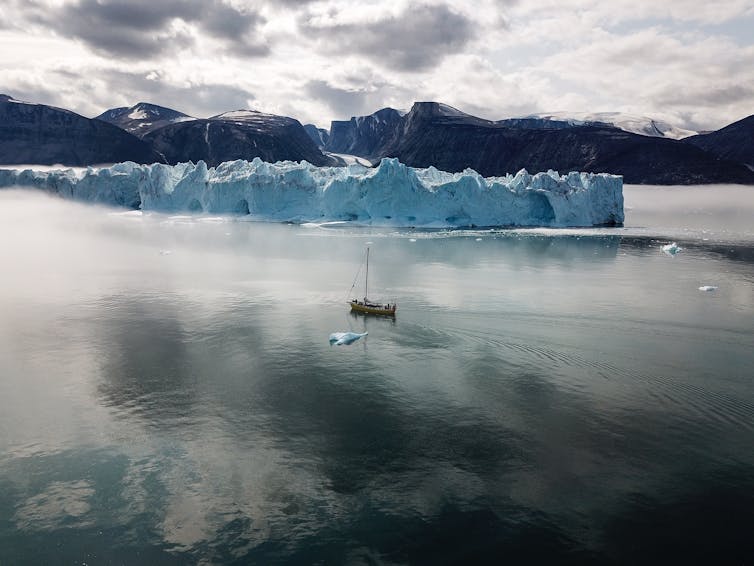
I’m standing at the edge of the Greenland ice sheet, mesmerized by a mind-blowing scene of natural destruction. A milewide section of glacier front has fractured and is collapsing into the ocean, calving an immense iceberg.
Seracs, giant columns of ice the height of three-story houses, are being tossed around like dice. And the previously submerged portion of this immense block of glacier ice just breached the ocean – a frothing maelstrom flinging ice cubes of several tons high into the air. The resulting tsunami inundates all in its path as it radiates from the glacier’s calving front.
Fortunately, I’m watching from a clifftop a couple of miles away. But even here, I can feel the seismic shocks through the ground.
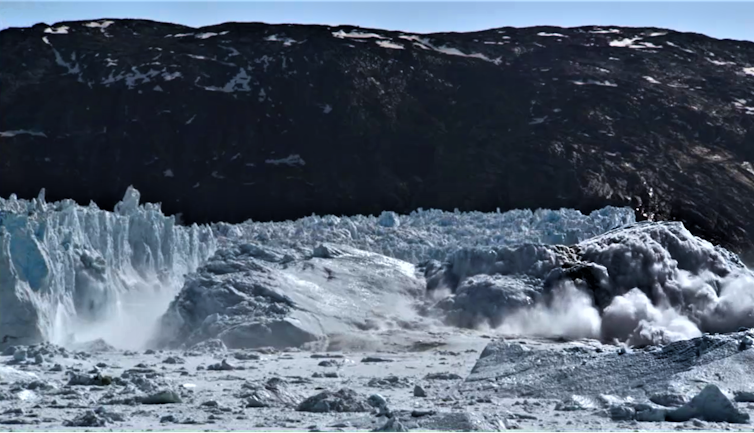 A fast-flowing outlet glacier calves a ‘megaberg’ into Greenland’s Uummannaq Fjord. Alun Hubbard
Despite the spectacle, I’m keenly aware that this spells yet more unwelcome news for the world’s low-lying coastlines.
As a field glaciologist, I’ve worked on ice sheets for more than 30 years. In that time, I have witnessed some gobsmacking changes. The past few years in particular have been unnerving for the sheer rate and magnitude of change underway. My revered textbooks taught me that ice sheets respond over millennial time scales, but that’s not what we’re seeing today.
A study published Aug. 29, 2022, demonstrates – for the first time – that Greenland’s ice sheet is now so out of balance with prevailing Arctic climate that it no longer can sustain its current size. It is irreversibly committed to retreat by at least 59,000 square kilometers (22,780 square miles), an area considerably larger than Denmark, Greenland’s protectorate state.
Even if all the greenhouse gas emissions driving global warming ceased today, we find that Greenland’s ice loss under current temperatures will raise global sea level by at least 10.8 inches (27.4 centimeters). That’s more than current models forecast, and it’s a highly conservative estimate. If every year were like 2012, when Greenland experienced a heat wave, that irreversible commitment to sea level rise would triple. That’s an ominous portent given that these are climate conditions we have already seen, not a hypothetical future scenario.
Our study takes a completely new approach – it is based on observations and glaciological theory rather than sophisticated numerical models. The current generation of coupled climate and ice sheet models used to forecast future sea level rise fail to capture the emerging processes that we see amplifying Greenland’s ice loss.
How Greenland got to this point
The Greenland ice sheet is a massive, frozen reservoir that resembles an inverted pudding bowl. The ice is in constant flux, flowing from the interior – where it is over 1.9 miles (3 kilometers) thick, cold and snowy – to its edges, where the ice melts or calves bergs.
In all, the ice sheet locks up enough fresh water to raise global sea level by 24 feet (7.4 meters).
David Attenborough takes us on a virtuoso tour of the Greenland ice sheet.
Greenland’s terrestrial ice has existed for about 2.6 million years and has expanded and contracted with two dozen or so “ice age” cycles lasting 70,000 or 100,000 years, punctuated by around 10,000-year warm interglacials. Each glacial is driven by shifts in Earth’s orbit that modulate how much solar radiation reaches the Earth’s surface. These variations are then reinforced by snow reflectivity, or albedo; atmospheric greenhouse gases; and ocean circulation that redistributes that heat around the planet.
We are currently enjoying an interglacial period – the Holocene. For the past 6,000 years Greenland, like the rest of the planet, has benefited from a mild and stable climate with an ice sheet in equilibrium – until recently. Since 1990, as the atmosphere and ocean have warmed under rapidly increasing greenhouse gas emissions, Greenland’s mass balance has gone into the red. Ice losses due to enhanced melt, rain, ice flow and calving now far exceed the net gain from snow accumulation.
Greenland’s ice mass loss measured by NASA’s Grace satellites.
What does the future hold?
The critical questions are, how fast is Greenland losing its ice, and what does it mean for future sea level rise?
Greenland’s ice loss has been contributing about 0.04 inches (1 millimeter) per year to global sea level rise over the past decade.
This net loss is split between surface melt and dynamic processes that accelerate outlet glacier flow and are greatly exacerbated by atmospheric and oceanic warming, respectively. Though complex in its manifestation, the concept is simple: Ice sheets don’t like warm weather or baths, and the heat is on.
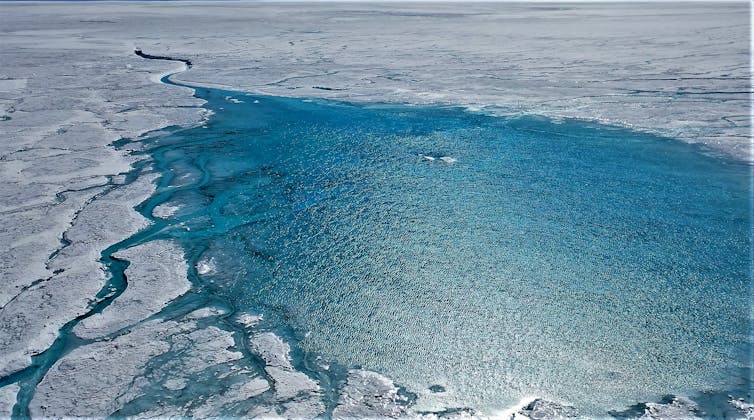 Meltwater lakes feed rivers that snake across the ice sheet - until they encounter a moulin. Alun Hubbard
What the future will bring is trickier to answer.
The models used by the Intergovernmental Panel on Climate Change predict a sea level rise contribution from Greenland of around 4 inches (10 centimeters) by 2100, with a worst-case scenario of 6 inches (15 centimeters).
But that prediction is at odds with what field scientists are witnessing from the ice sheet itself.
According to our findings, Greenland will lose at least 3.3% of its ice, over 100 trillion metric tons. This loss is already committed – ice that must melt and calve icebergs to reestablish Greenland’s balance with prevailing climate.
We’re observing many emerging processes that the models don’t account for that increase the ice sheet’s vulnerability. For example:
-
Increased rain is accelerating surface melt and ice flow.
-
Large tracts of the ice surface are undergoing bio-albedo darkening, which accelerates surface melt, as well as the impact of snow melting and refreezing at the surface. These darker surfaces absorb more solar radiation, driving yet more melt.
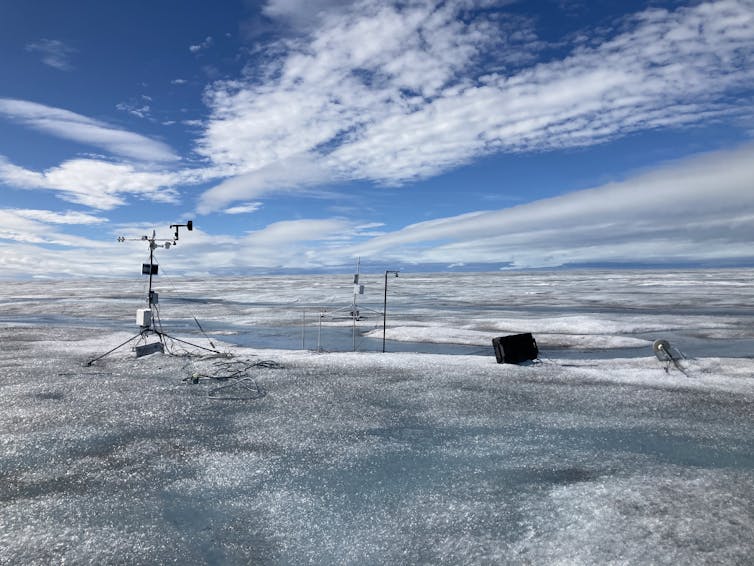 In August 2021, rain fell at the Greenland ice sheet summit for the first time on record. Weather stations across Greenland captured rapid ice melt. European Space Agency
-
Warm, subtropical-originating ocean currents are intruding into Greenland’s fjords and rapidly eroding outlet glaciers, undercutting and destabilizing their calving fronts.
-
Supraglacial lakes and river networks are draining into fractures and moulins, bringing with them vast quantities of latent heat. This “cryo-hydraulic warming” within and at the base of the ice sheet softens and thaws the bed, thereby accelerating interior ice flow down to the margins.
The issue with models
Part of the problem is that the models used for forecasting are mathematical abstractions that include only processes that are fully understood, quantifiable and deemed important.
Models reduce reality to a set of equations that are solved repeatedly on banks of very fast computers. Anyone into cutting-edge engineering – including me – knows the intrinsic value of models for experimentation and testing of ideas. But they are no substitute for reality and observation. It is apparent that current model forecasts of global sea level rise underestimate its actual threat over the 21st century. Developers are making constant improvements, but it’s tricky, and there’s a dawning realization that the complex models used for long-term sea level forecasting are not fit for purpose.
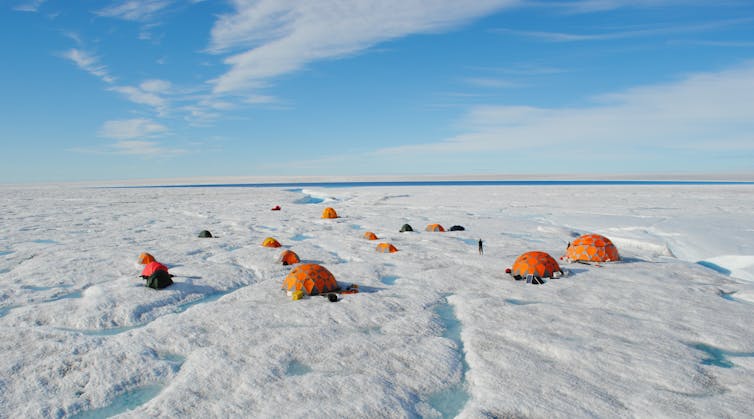 Author Alun Hubbard’s science camp in the melt zone of the Greenland ice sheet. Alun Hubbard
There are also “unknown unknowns” – those processes and feedbacks that we don’t yet realize and that models can never anticipate. They can be understood only by direct observations and literally drilling into the ice.
That’s why, rather than using models, we base our study on proven glaciological theory constrained by two decades of actual measurements from weather stations, satellites and ice geophysics.
It’s not too late
It’s an understatement that the societal stakes are high, and the risk is tragically real going forward. The consequences of catastrophic coastal flooding as sea level rises are still unimaginable to the majority of the billion or so people who live in low-lying coastal zones of the planet.
 A large tabular iceberg that calved off Store Glacier within Uummannaq Fjord. Alun Hubbard
Personally, I remain hopeful that we can get on track. I don’t believe we’ve passed any doom-laden tipping point that irreversibly floods the planet’s coastlines. Of what I understand of the ice sheet and the insight our new study brings, it’s not too late to act.
But fossil fuels and emissions must be curtailed now, because time is short and the water rises – faster than forecast.![]()


I thought I read that at 425ppm global sea rise would be 25m just based on the geological record?
wayne @1,
I'm not sure of which 'geological record' you are looking at, but I would reckon the tectonocally-changing 'geology' itself had some impact on the relative global temperature & thus sea level back when CO2 was last up at 425ppm.
The last time we saw 425ppm would be back 13 million years ago when the Arctic had no ice caps. The Arctic began getting seriously icy about 3 million years ago, apparently due to the Panama Isthmus forming to connect N & S America. There was also a widening of Drakes Passage at this time. The climate went through some interesting periods at this time 3my ago, with a period of warming with rising CO2 (but not quite back up to 425ppm) leading on to cooling & the icy Arctic.
I had read of this study. I wish the expected minimum of GL melt were added to the expected SLR from land glaciers and thermal expansion plus an expected contribution from Antarctica. I believe SLR is tracking at or above IPCC maximum expectatons which would give 3-ft by 2100 without much contribution from the big ice sheets. The ARs have started icluded a footnote re the unlikely but feasible collapse of portions of the big ice sheets. But isn't collapsing how the Laurentide sheet left so quickly?
Hansen, et al 2015 showed that melt water from the GIS could slow the overtuning current resulting in more warmth staying in the Southern Ocean at the same depth as the grounding line for Antarctic draining glaciers. DeConto Pollard 2015 modeled collapse mechanisms (structural instabilities) of tall ice cliffs produced by melting and calving of those glaciers.
So I'd think the bad news from GL means bad news for the west and east Antarctic Ice Sheets and expected SLR by 2100 could be closer to 6' in a moderate emissions scenario. The question is, how much of that is already locked in? I understand the compulsion to not be too unconservative, but maybe it's time for a realistic look at what we are really expecting.
MA Rodger, I think ive read that in numerous postings by Hansen and others over time. You seem to confirm at least partially with respect to 13mya
It's hard to be optimistic. Record temperatures, record fires (Siberia burns year round and Russia started flaring and burning their natural gas that they don't want to send to Europe because they can't shut down their wells), record floods, shrinking albedo and record amounts of fossil fuels used. Countries are trying to find new sources of fossil fuels. I live in southern Calif and the temp yesterday was 112oF and probably warmer today and all next week, really hot! China is turning more to coal, probably India too. Clearly the world has to work together to solve these problems, and then you look at the top 4 fossil fuel emitters - China, US, India and Russia. It's hard to imagine those 4 ever working together. 6' by 2100 sounds conservative to me.
Wayne @4,
I was in two minds on continuing our interchange, but I decided I would continue when I came across coverage of the paper underlying this SkS OP which surprisingly appeared today on the pages of my local rag with the title "Zombie ice to raise global sea level". On-line I see the same story getting into newspapers elsewhere (eg The Washigton Post).
In terms of an SLR-CO2 correlations, I don't recall seeing Hansen provide it. I believe the closest he got was in Hansen et al (2013) 'Climate sensitivity, sea level and atmospheric carbon dioxide' (with its well-used Fig 1) which looked at temperature & SLR but only inferred CO2 levels with very cursory checks to actual CO2 reconstructions.
And for me, Hansen's 5m SLR by 2100 was always a bit of theorising that I struggled with. Even after it appeared properly written up in Hansen et al (2016), which at least answered the energy equations that were my initial objection to such a large SLR projections, for me it still remains more 'discussion document' than a full-blooded argued case. In my view, worrying as it is, the future SLR from Greenland & Antarctica depends on the Precipitation minus Ice-Loss balances and that puts us in the hands of climatologists for the precipitaion and glaciologists for the ice-loss. The application of paleoclimatology and whether Greenland melted out in the Eemian isn't so relevant for our future SLR.
Just to throw in my other SLR bug bear which also becomes relevant here, I've always reckoned SLR ain't gonna stop at 2100. So why do we go on so long about the 2100 SLR when by 2150, 2200, 2300 etc it's going to be seriously bigger? (A total of 2.3m SLR/ºC AGW according to IPCC AR5 fig13.14.)
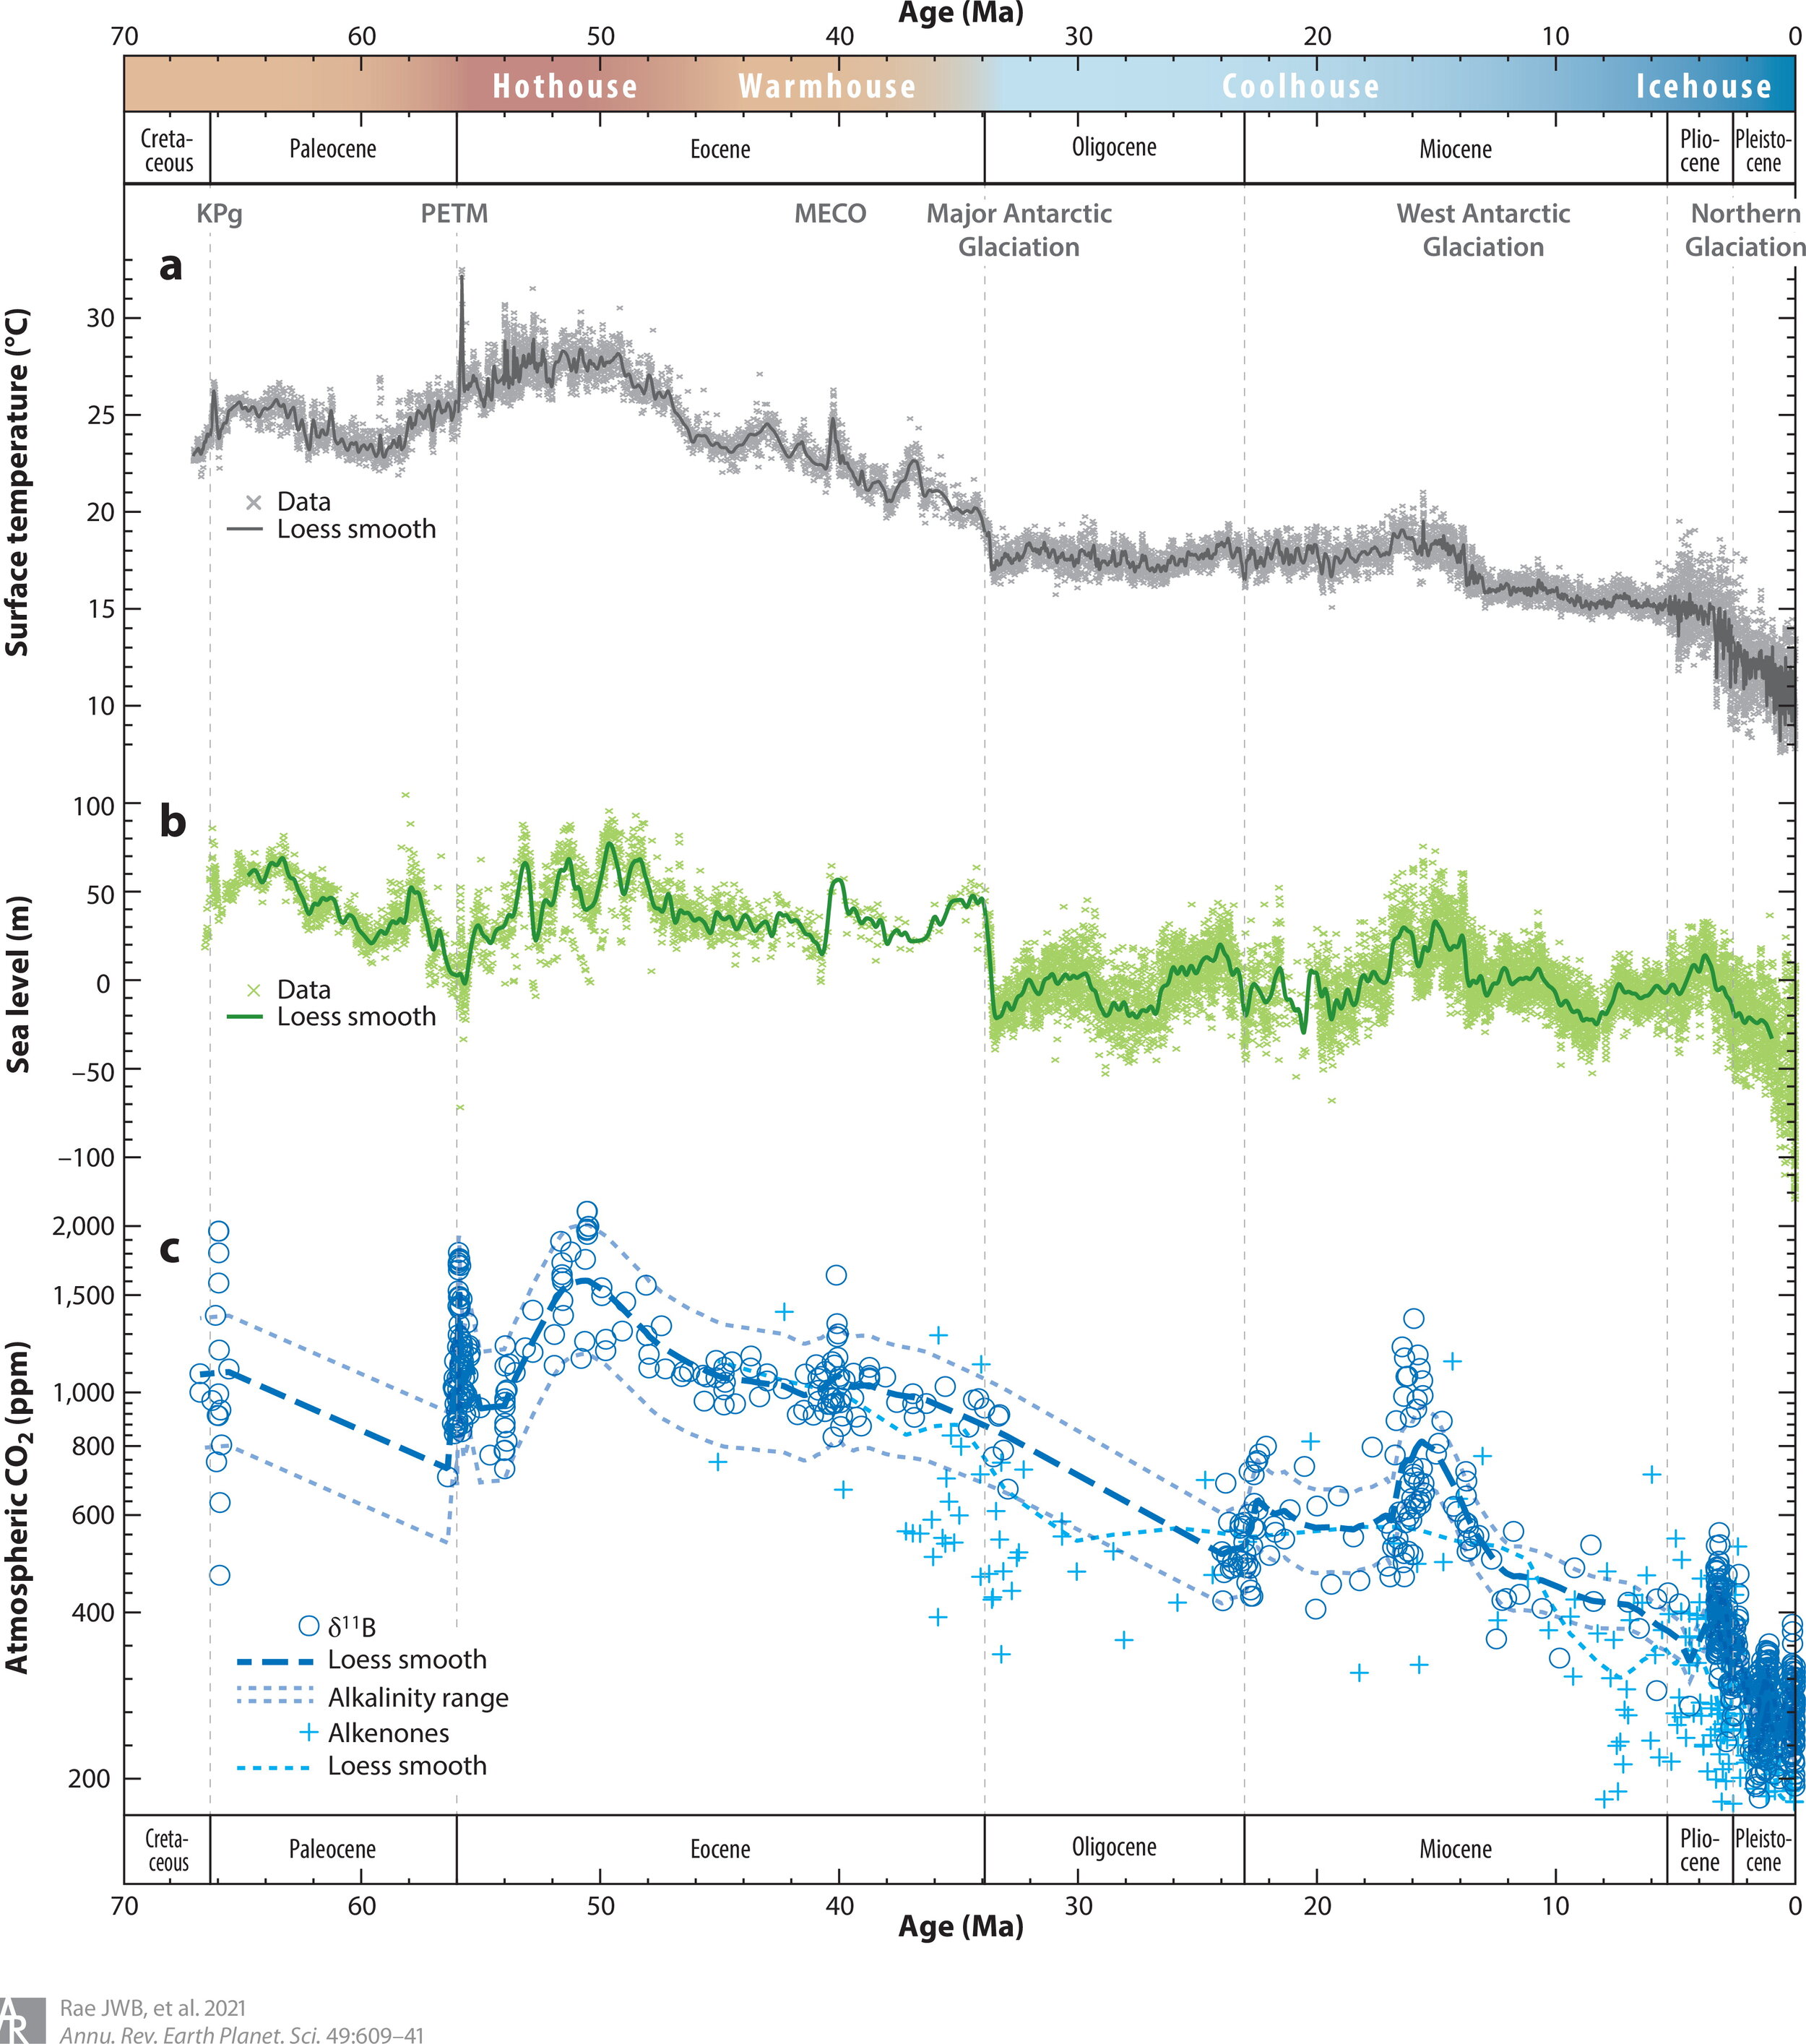
The SLR-ΔCO2 relationship is of course a paleoclimate thing, so may not be immediately relevant outside the Eemian or now we have a Panama Isthmus connecting N&S America. That said, the SLR-ΔCO2 relationship is usually a step beyond what most graphics provide, but fig 6 of Rea et al (2021) 'Atmospheric CO2 over the Past 66 Million Years from Marine Archives' does provide us a ΔT-SLR-ΔCO2 graphic. Note that they do not attempt to be definitive with this CO2 reconstruction, saying "While each method has uncertainties, these are largely independent, so their broad convergence on similar CO2 histories is encouraging."
But I stress the idea that paleoclimate stuff should concede precedence to glaciology when it comes to the melting ice caps today and glaciology is where the paper underlying the SkS OP above comes from, Box et al (2022) 'Greenland ice sheet climate disequilibrium and committed sea-level rise'. I read that paper as saying that, as of now (2000-19), Greenland is not tipped over into melt-out mode (which I think was always seen as requiring a little more AGW to do that tipping, but nonetheless is good news to hear said) and that the Greenland melt which we are committed-to will happen in the next several decades, not several centuries, and will be mainly over by 2100.
So at least for Greenland under the AGW so-far, my bug bear (that we are in denial ignoring massive SLR awaiting us post-2100) is assuaged.
Mind, the SLR thus awaiting from Greenland isn't trivial. And there is still Antarctica. And not forgetting we still have the tiny task of halting future AGW.
thanks Rodger
there is this older article
https://link.springer.com/article/10.1007/s40641-015-0014-6
I guess from a political perspective there is not much point in thinking past 2100