


 Arguments


How could global warming accelerate if CO2 is 'logarithmic'?
Posted on 28 March 2018 by DPiepgrass
After publishing my experiences talking to science 'dismissives' (or 'skeptics', or whatever you'd like to call them) and then participating in the excellent Denial101x course, I was invited to join the volunteer team at SkepticalScience last year.
But before all that, one of the dismissives drew my attention to a climate science paradox:
- Scientists agree that the greenhouse effect is approximately logarithmic?—?which means that as we add more CO2 to the atmosphere, the effect of extra CO2 decreases.
- However, the IPCC projects that if we don't take steps to reduce our emissions, global warming won't just get worse, it will speed up:
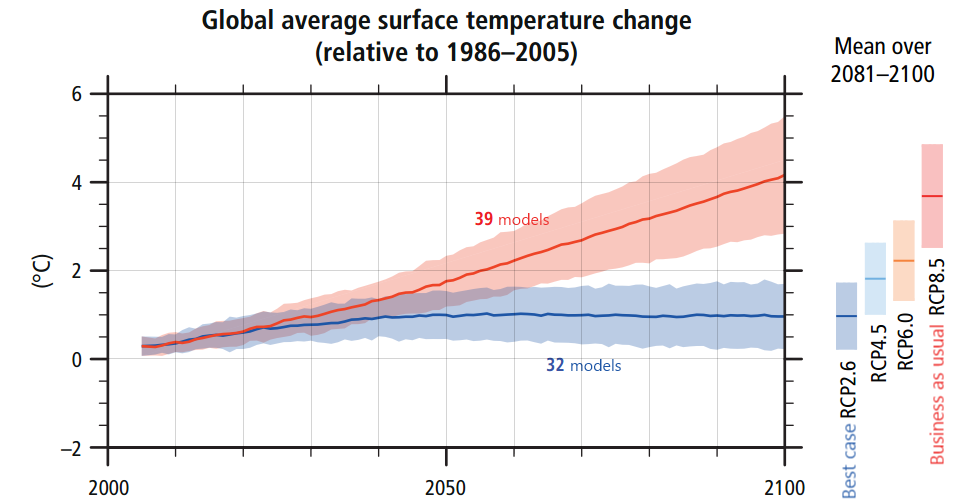
Figure 1: From IPCC AR5 synthesis report, page 11
How could both facts be true, I wondered? At the time I turned to "Ask A Climate Scientist" on Facebook and got a response from Steve Sherwood, an atmospheric scientist and one of the hundreds of IPCC report authors. I thought my first post here at SkS would be a good opportunity to share what I learned.
So what is this "logarithmic effect" exactly? It looks like this:
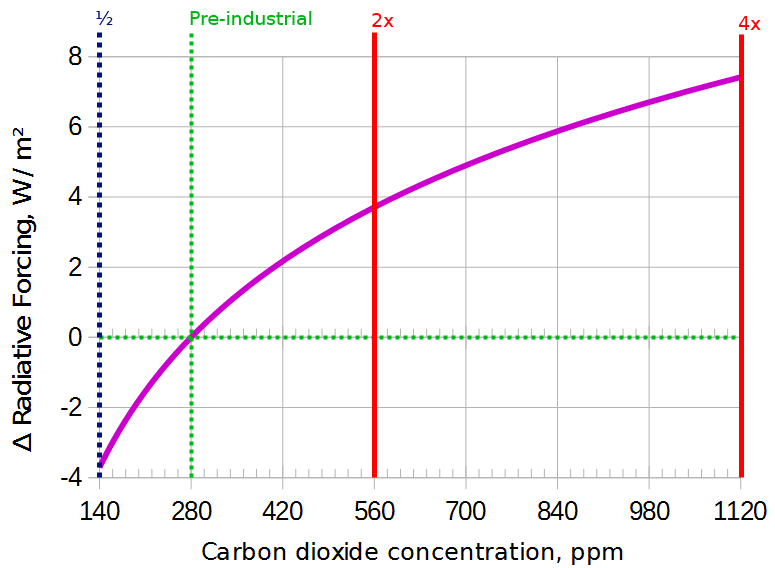
Figure 2: The surface receives about 3.7 W/m2 more energy each time CO2 is doubled.
In the last million years, CO2 levels have cycled between about 180 and 280 ppm during cycles about 100,000 years long. Because this happened in the steep part of the curve, a change of only 100 ppm (together with the Milankovich cycles) was enough to move the world in and out of the ice ages. Even though humans have increased the CO2 concentration by 130 ppm already, this extra 130 ppm has a smaller effect than the 100 ppm that was added naturally before.
But let's zoom in on the part that we actually care about: the modern era.
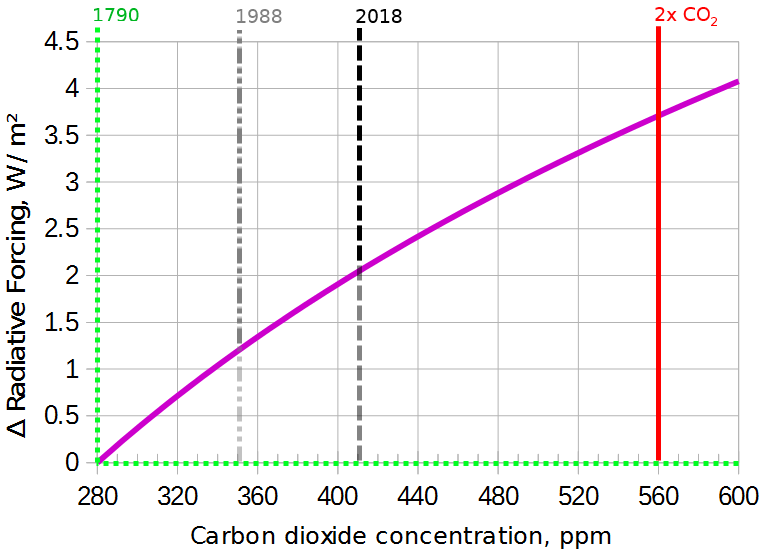
Figure 3
After zooming in, the logarithm doesn't make such a big difference: it's not far from a straight line. 560ppm will probably take us well beyond the Paris target of 1.5°C, so the 280-560 range is key; we would be unwise to let our civilization go beyond 560.
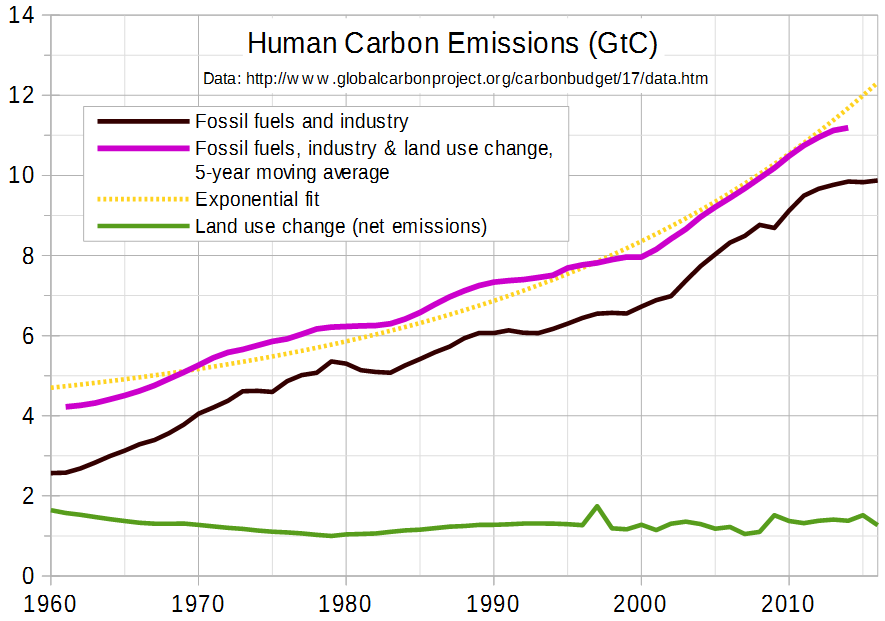
But human CO2 emissions are increasing exponentially—fast enough that when we plot atmospheric CO2 with a logarithmic scale, it still curves up slightly, even over the last 30 years:
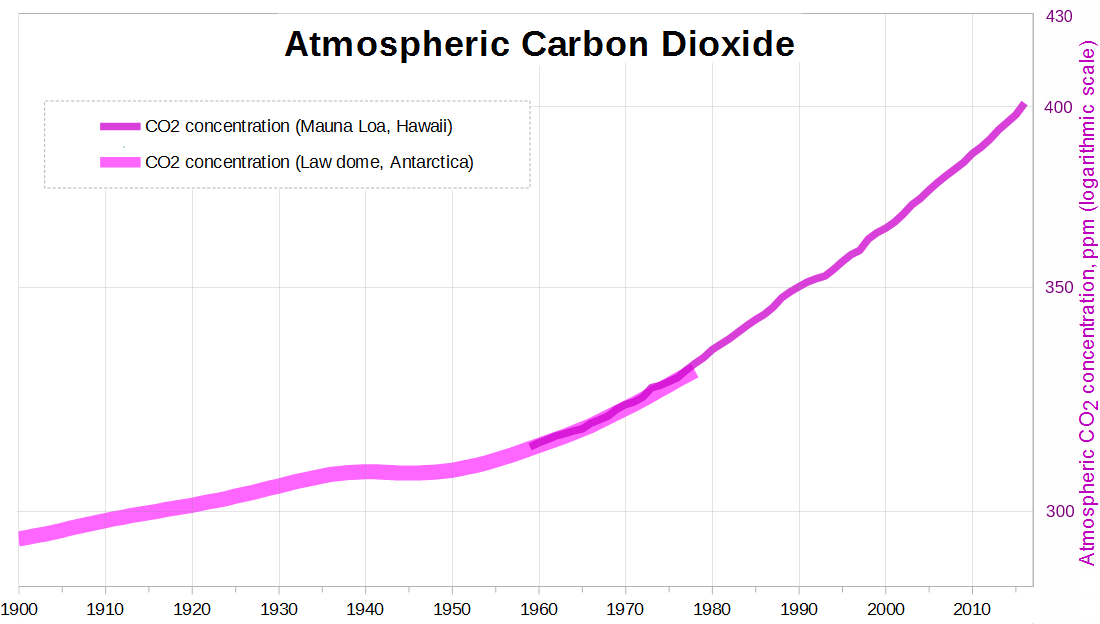
Figure 4
Exponential growth appears as a straight line on a logarithmic chart; an upward curve means, in some sense, faster than exponential growth.1 So if human emissions keep increasing as they have, it makes perfect sense that global warming would speed up.
"But wait," I hear you think, "surely it won't increase exponentially forever?" You're right, of course, it won't, but it could continue for awhile, and in total there are four factors that could work together to speed up warming:
- Rapid economic development
- Past emissions
- Carbon sink saturation
- Committed warming
1. The developing world is developing fast.
The late Hans Rosling explains this very well in his talk, "How Not to be Ignorant about the World". Poverty is decreasing faster than ever—which, I would think, means more power plants being built than ever before. Right now, about 1600 of those new power plants will burn coal. And as long as most of the world has a standard of living well below China's, there is plenty of room for growth to continue and perhaps even accelerate.
2. Past emissions (CO2 is cumulative)
Once we add CO2 to the atmosphere, we face the law of conservation of matter: it won't go away unless something removes it.
This is related to another paradox you might have heard: methane produces a much stronger greenhouse effect than CO2, yet scientists are less worried about it. Why? For one thing, it has a much lower concentration in the atmosphere, but what's really important here is that it has a short lifetime of only about 12 years before it is destroyed in the methane cycle. That makes the methane problem less serious, as we expect nature will clean up the mess when we eventually reduce our methane output.
Carbon dioxide doesn't go away so easily. Here's a graph from Joos et al. (2013) estimating how slowly a large "pulse" (sudden addition) of CO2 would leave the atmosphere:
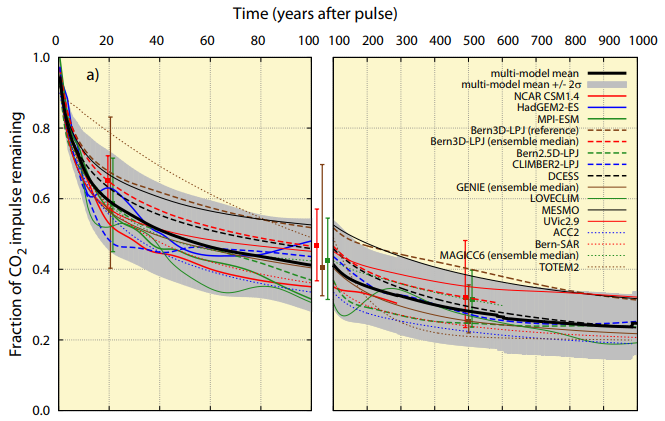
Figure 5
The black line is an average of many other studies and models. At first, the ocean and land absorb it "quickly", so about half of it is gone after "only" 50 years, locked up in seawater and plants. But the next 25% takes a full 950 years to go away! After 1000 years, the ocean has absorbed 59% (contributing to ocean acidification) and the land 16%, leaving 25% behind.
CO2 accumulation itself can't make global warming speed up, but what it does is prevent it from stopping by ensuring that the greenhouse forcing keeps going up. If you look at a graph of human emissions instead of atmospheric concentration, it's only roughly exponential. Human emissions temporarily stalled in the early 80s and early 90s, but since CO2 accumulates, the atmospheric curve just kept going up unabated.
3. Carbon sinks can saturate
Right now, carbon sinks (oceans, plants, and others) are removing about 2.4ppm of CO2 from the atmosphere each year, while we're adding about 5.2ppm, for a net increase of 2.5ppm per year.2
Figure 6: Where our emissions go (source)
While nature removes about half of our carbon emissions each year now, don't assume our good fortune will last. According to Jones et. al., 2013, there is disagreement between various climate models about the details, but on average, under the business-as-usual scenario known as RCP 8.5, the land is projected to absorb less CO2 as time goes on, and the fraction of our emissions absorbed by oceans will decrease too (even if the absolute absorption rate increases). In other words, just because we emit more doesn't guarantee nature absorbs more; sooner or later, CO2 will accumulate faster in the atmosphere. (On average about 2/3 of new emissions will stay in the atmosphere this century under RCP 8.5, where last century it was less than half.)
Basically, the oceans can absorb CO2 at first; increasing the CO2 in the air will always make oceans absorb more. However, as the oceans warm up, carbon solubility decreases—warm water can't hold as much of it, and the only reason ocean absorption will continue after that is that oceans are enormous and take time to "fill up", as the carbon spreads deeper and deeper. Given enough time, oceans would "saturate" and become unable to absorb more. Similarly, CO2 enhances plant growth to some extent, but growth is eventually balanced out by plant decomposition (which releases CO2), and the long-term effects of climate change won't necessarily be good for plants.
CO2 will eventually be removed permanently through a process called weathering—but this will take thousands of years.
4. Committed warming
Earth's climate system has feedback loops that magnify the warming effect of CO2. For example, as the arctic ice melts, it exposes ocean. The ocean is much darker than the ice, so more sunlight is absorbed instead of being reflected back to space. This enhances the arctic warming effect. This effect is time-delayed, since it takes many years for the arctic ocean to warm up (which in turn causes the ice to melt more quickly in the future, which in turn helps the ocean to heat up even more.)
"Committed warming" refers to future warming effects that would still happen even if CO2 levels stop increasing. A large source of delayed warming worldwide is the oceans, which, as you can see here, have not kept up with the warming of the land:
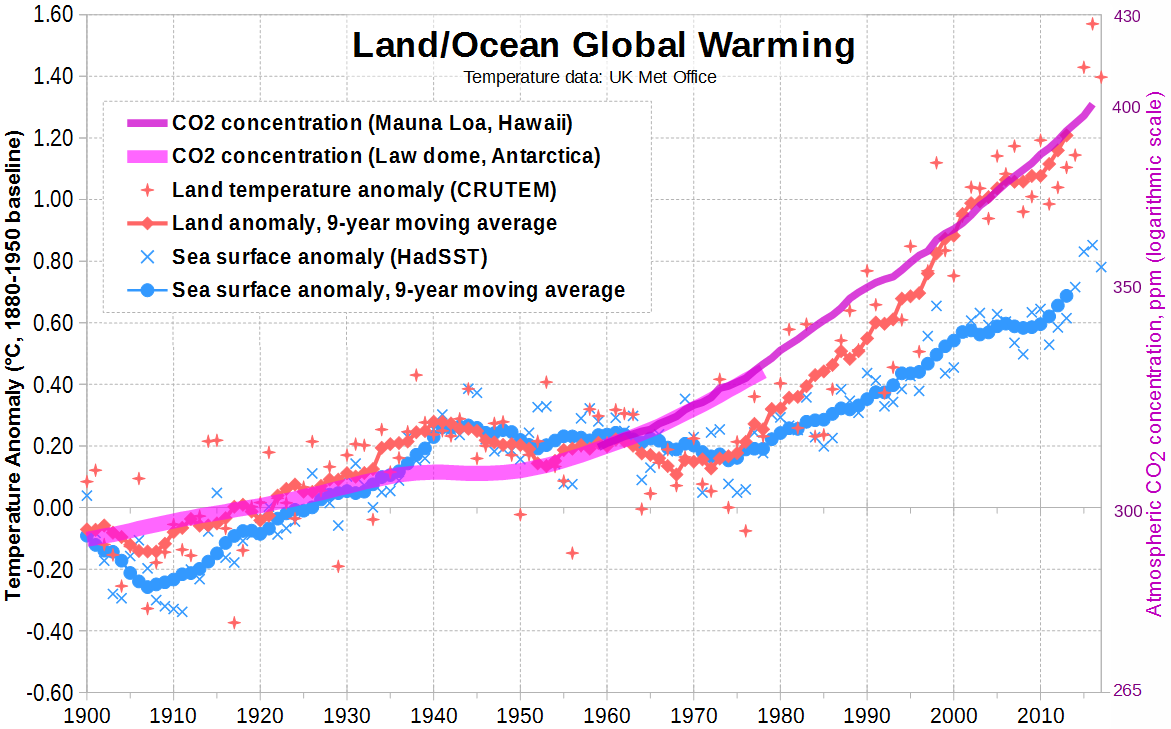
Figure 7
As our massive oceans slowly heat up, they will not only increase the global average surface temperature, but they will also warm up the land further, especially near the ocean where ocean temperature strongly affects the land.3
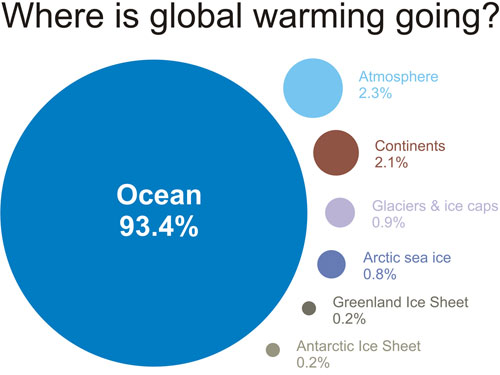
Figure 8 based on IPCC AR4 5.2.2.3
Due to this delayed warming, climate scientists have separate short-term and long-term estimates of global warming:

Figure 9: Warming from various CO2 levels based on a typical TCR estimate of 1.8°C and the most commonly-cited estimate of ECS, 3°C. Various scientific groups have produced a range of TCR and ECS estimates; the precise concentration of CO2 that corresponds to 1.5°C is unknown (the bars marked "Paris target" are drawn wide to represent the uncertainty, but are not scientifically accurate error bars). And of course, this graph is just a first-order approximation. The real climate will be warmed further by other greenhouse gases4, and the real climate has additional variability and unpredictability, as do all computer models of it.
As you can see, in the short term there is technically still time to fulfill the Paris agreement and keep global warming under 1.5°C—but this graph ignores methane, which moves the target closer. Unfortunately it is considered highly unlikely that we'll be able to stop at our 1.5°C goal.
The long term outlook is even worse: we've already passed 1.5.
The good news is that reaching the long-term "equilibrium" climate will take hundreds of years, giving us time to, hopefully, reverse course and avoid a lot of that committed warming. But it's very likely—especially after we pass 1.5°C—that humanity will someday need to figure out how to remove CO2 from the atmosphere on a large scale.
In summary:
Although CO2 has less effect at higher CO2 concentrations, this "logarithmic effect" will be overpowered by these 4 factors if we don't switch to clean energy quickly:
- Exponential growth of energy use
- Past CO2 emissions that nature has not yet absorbed
- Carbon sink saturation
- Committed warming
What if we manage to stop increasing our emissions? This related article indicates that if emissions hold steady, global warming will still continue upward linearly.
Good news though: the price of solar panels has passed an important milestone. Around the equator where sunlight is strongest, unsubsidized solar power plants have dropped below the price of coal. Hooray for Swanson's law! I also like to point out that a new kind of safe and cheap nuclear reactor will—if the public supports it—begin production in the 2020s. And on a graph of human CO2 emissions you can see emissions have stalled. Is this temporary, like it was in the early 80s and 90s, or are we finally at a turning point? Perhaps, but the IEA forecast still includes new fossil fuel plants in the coming years.
Footnotes
1 This may sound more dramatic than it is; the human emission increase has been exponential, not faster than exponential, so the upward curvature is caused by something else. I believe it's because we're in a transition region between roughly constant CO2 of the past (280 ppm) and the new pattern of exponentially increasing CO2. Inside the transition region, an upward curve is expected.
2 Note: due to uncertainties, the numbers don't add up perfectly (2.4+2.5≠5.2). These numbers are based on the average of the last 5 years of Global Carbon Budget data, i.e. 9.8 GtC emitted by humans per year, 1.39 GtC added via land-use change, 2.5 GtC removed by oceans and 2.63 GtC removed by land. These numbers are estimates, and the observed change is 2.51 ppm (5.32 GtC) per year, which is 0.33 ppm (0.71 GtC) different than expected. Data sources and uncertainty levels are listed here. The conversion factor is 2.13 GtC/ppm.
3 There is some good news: climate models say the oceans will never warm up as much as the land does. See Sutton et al. 2007 for details.
4 After writing this article I learned from the AGGI that CO2 accounts for only two-thirds of human-caused greenhouse warming, which suggests that by the time we reach 500 ppm CO2 there may be enough other greenhouse gases to warm the planet by as much as 2.25°C in the short term (that's 1.5°C divided by 2/3). However, most other greenhouse gases have a shorter atmospheric lifetime than CO2, so by the time we reach 500 ppm CO2, the fraction of warming caused by other gases is likely to decrease. Nevertheless, we should not be surprised to see 2°C warming above preindustrial levels at 500 ppm or shortly thereafter. At present emission rates, we will reach 500 ppm in 2055 (roughly).
P.S. Why does CO2 have a logarithmic effect? It's complicated; see IPCC FAR (1990) §2.2.2, pages 49-52, or Huang & Shahabadi (2014) for technical details.


Thank you for your article. Your mention of Methane in your second point might need revising: "...but what's really important here is that it has a short lifetime of only about 12 years before it is destroyed in the methane cycle. That makes the methane problem much less serious, as we expect nature will clean up the mess when we eventually reduce our methane output."
At least one study I've read about recently shows we've greatly underestimated methane's role. In the PNAS paper "Centuries of thermal sea-level rise due to anthropogenic emissions of short-lived greenhouse gases" (http://www.pnas.org/content/114/4/657), its authors state, "We show that short-lived greenhouse gases [e.g., methane] contribute to sea-level rise through thermal expansion (TSLR) over much longer time scales than their atmospheric lifetimes."
And "...at least half of the TSLR due to increases in methane is expected to remain present for more than 200 y[ears], even if anthropogenic emissions cease altogether, despite the 10-y[ear] atmospheric lifetime of this gas."
DPiepgrass nicely written article. I'm looking forward to your future posts.
Very carefully considered post but you left out as much or more than you include.
There are dozens of feedback mechanisms that are kicking in and really need to be included in the warming graphs. What about water vapor for one, the biggest one at that? Just plotting CO2 and announcing future warming is less than useless it is dishonest.
Also there is plenty of documented cases of natural sinks absorbing less and even starting to become emission sources such as forests.
The over all message of this post is that it is bad but not that bad and we have time so don't worr too much. I understand not wanting to upset people too much or cause panic but I believe that mentality is more harmful that good.
We need to state how bad it really is and that chanses are it is happening faster than expected using the same clear, considered, scientific evidence and let the public have the knowledge they need to make the right decisions.
Science does not get to decide how much truth we get to have.
Factor 5 is tipping points. As stated, carbon sinks are expected to take up less Carbon dioxide as they saturate so this will push up atmospheric CO2. Add to this, for instance, the possibility of huge burps of Methane from the various sources of Carbon dioxide clathrate. Despite the short life of Methane in the atmosphere, it could shoot up global warming to a point that the existing sinks loose more of their power to absorb the gas while at the same time pushing us over other tipping points such as a sudden complete melt of Arctic floating ice for a much longer part of the year. We are taking a giant step in to the unknown with our eyes closed.
Well written comprehensive post quoting many sources, but didn't seem to have one on background information on why CO2 has logarithmic growth.
nijel j
its the beer lambert law basiclly
Tminus, that's interesting. I suppose it makes intuitive sense that heat added at the ocean surface would take a long time to leave, because the heat can migrate downward and stay deep for a long time before radiating from the surface eventually. On the other hand, 70-75% of sea level rise is due to ice melting so that's a larger concern. Here too, methane will help ice melt earlier. Clearly methane is a problem, but in this context it's a question of how big the problem is relative to CO2. Since CO2 causes ocean acidification and methane doesn't, on the whole I'm still inclined to think CO2 is much worse. But I'm not opposed to removing the word "much" in "much less serious".
jef, it was necessary to leave out some issues to keep the post short (I was actually told I shouldn't post some of my previous material directly on SkS because it was too long). The TCR and ECS estimates come from scientists who have already included all feedbacks including water vapor. (see here for TCR and ECS estimates from various studies.) I don't see how "plotting CO2 and announcing future warming is [...] dishonest".
I didn't mention water vapor because it is a short-term feedback, as you can see on this illustration from AR5 SYR:
Although it is a short-term feedback, it acts indirectly as a long-term feedback because future committed warming (caused by long-term feedbacks) will be amplified by the water vapor feedback. But I didn't think it was necessary to lengthen the post by explaining this fact.
William, tipping points do exist and imply that the long-term warming curve isn't quite logarithmic. I believe that the usual estimate of ECS of 3°C (when CO2 doubles) does include some tipping points having been reached.
You mentioned clathrates—it is considered "very unlikely" that clathrates will release methane in a "catastrophic" manner during this century; in fact it appears the threat is many centuries away (see this video or this SkS article); I think it's safe to say we can stop worrying about clathrates unless new evidence comes in showing the threat has been underestimated.
I believe the most notable tipping point is ice sheet melting. According to one estimate, "the tipping point for eventual total melting of the Greenland ice sheet could be a global temperature of around 1.6°C above preindustrial"—or even lower due to uncertainty (this corresponds to more than 1.6°C of warming in northern Greenland, since the arctic has warmed much faster than the global average. In southern Greenland, maybe not, due to the cold blob.)
Uncertainty—contrary to what the dismissives say—is one of the scariest things about global warming. Due to uncertainty, the ECS could be as low as 2°C or as high as 4.5°C. The latter would be catastrophic for human civilization, especially as it corresponds to more than 4.5°C of warming on land. (Based on Sutton et al 2007's low-lattitude warming ratio of 1.51, that would be 5.9°C/11°F hotter on land and 3.9°C at sea. If you've ever lived in a tropical climate, you know the last thing we need is more heat!)
Though methane‘s direct contribution to sea level rise is small compared to potentional ice melting on Greenland and Antarctica, the point is that the thermal expansion of the sea caused by methane represents stored heat that lasts much longer than the life cycle of methane in the atmosphere that warmed the water. Such methane is like a blow torch heating rocks for only 5 minutes but the rocks then stay hot then warm for 50 minutes. Methane‘s heating of oceans, therefore, contributes to melting ice plugs around Greenland and Anarctica plus on top by contributing to heating the air. Dismissing methane seems misguided.
Alchemyst @6 and nigelj @5: The Lambert-Beer Law shows an exponential rise of Absorption with increasing concentration. So Alchemyst's statement is incorrect.
In the atmosphere, though, the law applies only to infinitesimally small slabs because neither temperature nor pressure are constant with height, thus the results have to be integrated over the whole atmospheric column. Individual absorption lines of GHGs that are "saturated" (e.g. all "strong" GHGs such as CO2), thus absorb less per concentration change, than lines of "weak" GHGs (e.g. CFCs) that are not "saturated". This is discussed in detail in most atmospheric chemistry textbooks.
The scientific community worked through the math decades ago and found that weak absorbers produce approximate linear increases in radiative forcing in response to their concentration increases, while those for strong absorbers increase logarithmically. These relationships are empirical, aka they apply to our Earth's atmosphere. The numbers for radiative forcing enter the calculation of Global Warming Potentials.
My intuition on the source of “greater then exponential curve” would be to investigate the role that the loss of the soil/carbon sponge Is playing.
This is such a good article. I keep coming back to it. If there is one thing that might improve it, I might suggest a discussion of the mathematical relationship between forcing function and temperature. If I remember my Physics correctly, radiative energy goes as the fourth power of temperature. So a small temperature change can make up for a relatively large deficit in radiative energy. Whether or not I am right about that, it would be interesting to see a discussion of that relationship.
richieb1234 - while the Stephan-Boltzmann law gives you relation between radiative power to 4 power of temperate (so the doubling CO2 would raise temp by 1.1C), it is less useful than you might think for estimating actual surface temperature. You cannot raise (or lower) temperature without other feedbacks coming in. These operate on very wide timescales from very fast (water vapour increase), through decadal scale of albedo change from less ice, to century/millenia feedbacks in carbon cycle. Add in the complexity of cloud feedbacks (both +ve and -ve), and you get the wide range of estimates on climate sensitivity.
scaddenp - Thank you. I think your response to my comment would be a good addition to the article, because I am probably not the only reader who wondered about how Stephan-Boltzmann fits into the picture.
richieb1234 @13,
It's an interesting thought. Although for me the answer below doesn't really need calculating, let's do it.
The forcing from a doubling of CO2 is 3.7Wm*-2, enough to raise a body at a theoretical temperature of 255K by 1K. This then kicks off feedbacks that raise the temperatures by something like a further 2K. For sake of argument, let us assume this ECS=1K+2K = 3K.
We know that a further doubling of CO2 will require twice as much CO2 as the first doubling and that will raise that theoretical body from the double-CO2's 258K, but by a little less than 1K due to the S-B fourth-power relationship. So theoretically it would be 0.966K or 3.4% less than the first doubling.
And if we went for a third doubling to raise that theoretical body from the quadruple-CO2's 261K, the CO2 would provide a further 3.7Wm^-2 of forcing** and raise temperatures by a theoretical 0.933K or 6.7% less than the first doubling. And compounded with the reduced second doubling, that would amount to 10% less warming over the third doubling or an average reduction of 4.5% over all three doublings. But with global temperatures now +9ºC and the uncertainty with ECS=3K (It could well be significantly higher through three doublings), I would be surprised if a 10% discount for being such a loyal customer of CO2-powered AGW is going to feature in anybody's decision making.
[** With a third doubling, CO2 atmospheric levels would be reaching 2,200ppm so now well above the 1,300ppm that my memory tells me is the top of the range over which the logarithmic relationship should be used. The forcing relationship then increases somewhat due to the compound CO2 absorption band at 10 microns starting to kick in.]
MA Rodger: Great stuff! Thanks