


 Arguments


US Passenger Vehicle Emissions Comparable to 1980 Mt. St Helens Eruption Occurring Every 3 Days
Posted on 4 November 2016 by Ryan Logtenberg
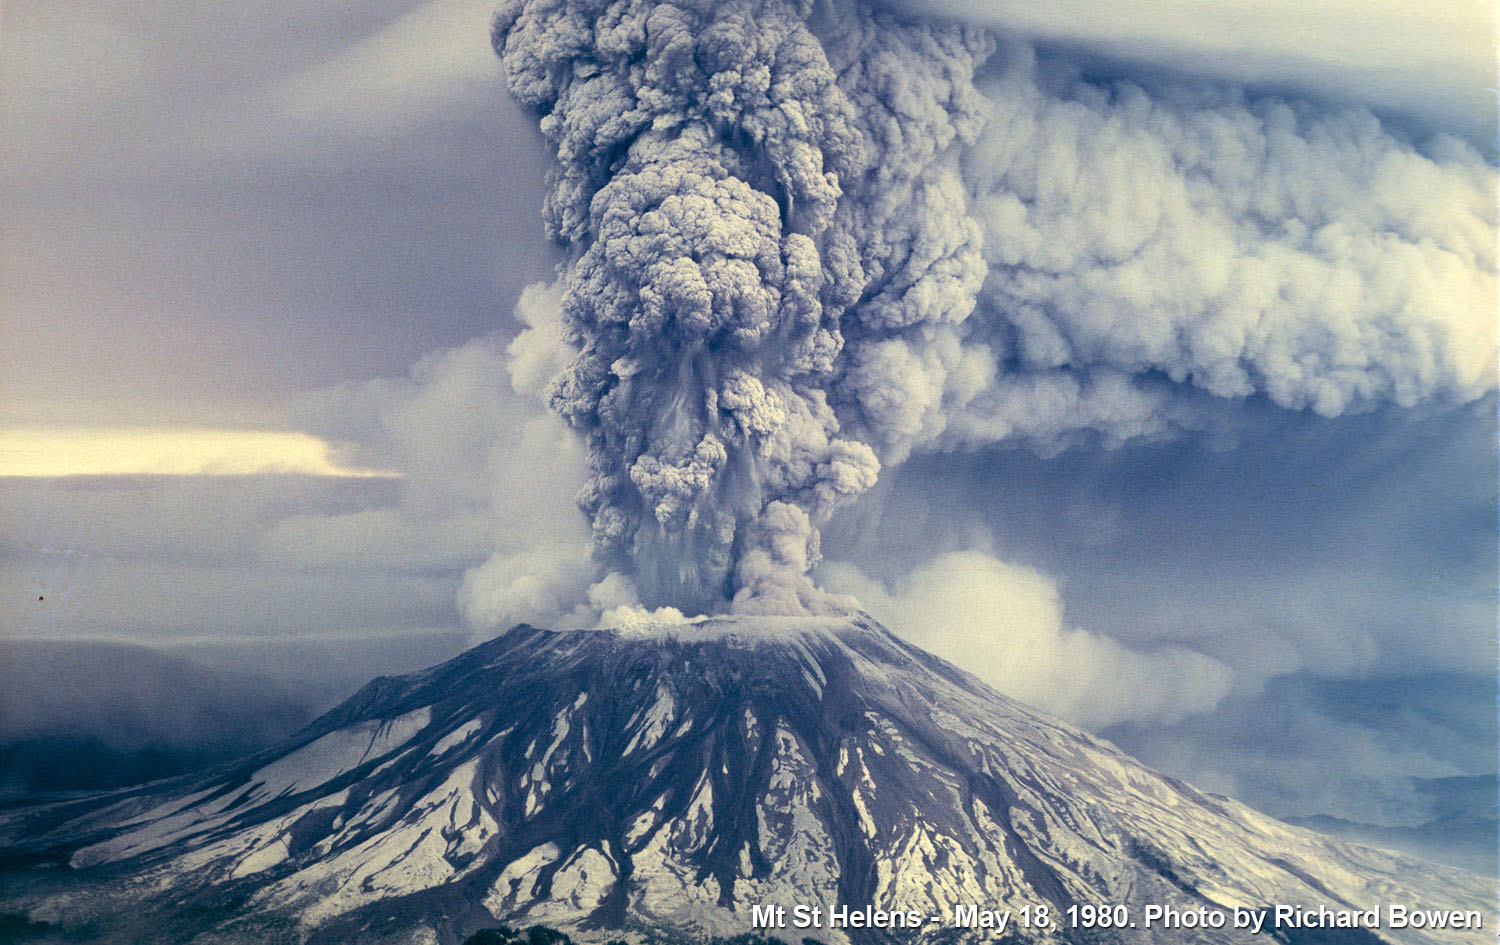
The eruption of Mount St Helens on May 18th 1980 was an event that few who were alive at the time will forget. The dramatic explosion and subsequent flooding was deeply surreal, and for 57 people, deadly. Many climate change skeptics believe that volcanic CO2 emissions like Mt. St Helens exceed those created by human generated emissions, and make any effort to reduce carbon emissions irrelevant. Climate scientists scoff at this idea, but given events as dramatic as Mt. St. Helens, it’s a tough criticism to ignore. But how does Mt. St Helen’s famous eruption compare in size to other volcanic events that have occurred around the globe?
The volcanic explosive index scale (VEI) is a form of measurement similar to the index that is used to measure earthquake intensities. The VEI scale ranges from 1 to 8, with 1 being the lowest and an 8 being a super volcano eruption like the one that occurred at Yellowstone National Park 640,000 years ago. Mt. St Helens eruption was a VEI-5. A VEI-5 volcanic eruption is seen as a significant volcanic event that occurs on average once every 12 years on the planet. Since Mt St. Helens, there has been only 3 other volcanic eruptions on earth that were equal or larger. The USGS estimates that 10 million tons of CO2 was released over its 9 hour eruption. That's a pretty huge number, but still a small fraction of the 260 million tons of CO2 released annually by all volcanoes on earth.
Now how does that compare to human emissions? For starters, there are 318 million people and 253 million passenger vehicles in the USA. The Federal Highway Administration estimates that Americans totalled 3.06 trillion miles of driving in 2015. That works out to an average driving distance of approximately 12,000 miles per vehicle. The average fuel economy in 2015 was 25.5mpg. Based on those numbers, 3.06 trillion miles divided by 25.5 mpg = 120 billion gallons of gasoline consumed each year. A gallon (or 6.3lbs) of gas burned in an engine produces 20lbs of CO2 because the burning of gas requires oxygen which then binds to the carbon atom to make the heavy CO2 molecule. So, 120 billion gallons x 20lbs = 2,400 billion lbs of CO2 (or 1,200 million tons) is produced each year from passenger vehicle emissions in the USA.
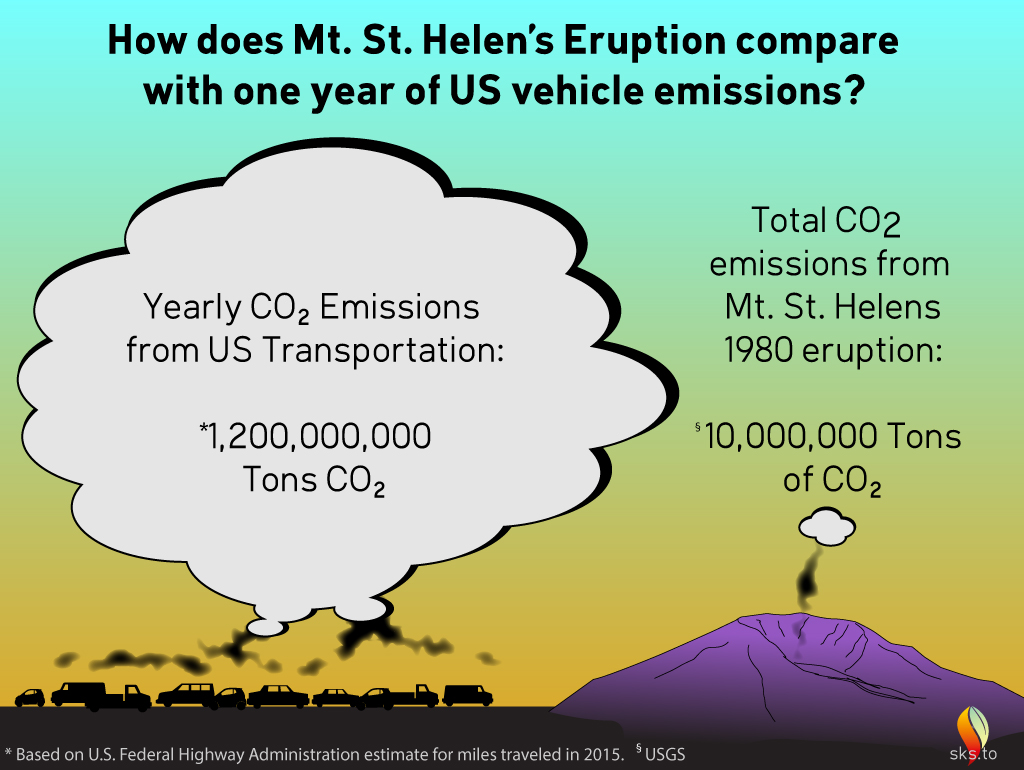 Since the Mount St Helens eruption produced 10 million tons of CO2, this means that passenger vehicles in the USA alone emit as much CO2 as a Mt St. Helens eruption happening somewhere in America every 3 days. The transportation sector (airplanes, trains, ships and automobiles) makes up 26% of US greenhouse gas emissions with the remainder coming from electricity, industry, agriculture and commercial/residential use. Total US greenhouse gas emissions (6.8 billion tons per year) are the equivalent of a Mt St. Helen's eruption happening almost twice a day in the USA alone. Factor in global human greenhouse gas emissions (46 billion tons per year) and that works out to 4,600 Mt St. Helen's eruptions occurring every year (or 12.6 eruptions per day). Remember, a VEI-5 volcano like Mt. St Helens only happens on average once every 12 years on the entire planet so to have CO2 emissions from one of these explosions happening 12.6 times a day is quite disturbing.
Comparing human emissions to famous volcanic events puts into perspective how our species can easily have an impact on the atmosphere of our planet. Atmospheric stations around the world including the NOAA lab in Hawaii has been keeping records of CO2 levels in the atmosphere daily since 1958. CO2 levels have been consistently going up annually since they started keeping track of it. With CO2 gas emissions equivalent to 12.6 Mt St. Helens occurring every day - it is not surprising to see why.
To see current CO2 emissions, methane levels, nitrous oxide levels, oxygen levels or the global temperature record visit ClimateLevels.org or checkout the graph below:


Interestingly, the Large Igneous Provinces (LIPs; massive, long-time volcanic activity) that have been associated with major extinction events in our planet's geologic/biologic history have released multiple thousands of gigatons of CO2 over their lifetimes. If we humans are releasing 46 gigatons per year, I suspect that we're emitting CO2 at a rate comparable to that of LIPs--natural events that wiped out large portions of extant species.
Joel_Huberman @1, your source suggests the Siberian Traps released 30,000 GtC of CO2 over the period of its erruption, ie, over a period of over a million years, representing an annual emission rate of around 0.03 GtC per annum. In contrast, since 1850 humans have emitted 560 GtC at a mean annual rate of 3.4 GtC. Since 1965 (ie, over the last 50 years for which we have published data), we have emitted 370 GtC at 7.4 GtC per annum. Since 2010 the average annual emission rate has exceeded 10 GtC per annum. In short, we are emitting CO2 at rates that far exceed those during the deposition of large igneous provinces.
The graphic was great. None of the deniers will read the text and few would understand if they did. How about two more graphics. a) The total yearly emissions from all geological sources vs the total yearly emissions of us and b) Our yearly rate of emissions vs the rate of emissions during the laying down of the Siberian traps. Then we can send this to our denier friends in a form they can comprehend.
William @3, I totally agree. However you can imagine what the deniers will say. "Volcanic emissions of CO2 in recent decades are underestimated, the figures are junk science concocted by people promoting big government (or some other ulterior motive, or grand and completely silly conspiracy theory).
All you need is a graph on global sea ice... highlighting 2016 against the sattelite record.
Hi William, I like your suggestions and will look into drawing the 2nd. Your first suggestion my be covered already by one of our illustrations here:
Human vs natural CO2 emissions
The first diagram in this post is based on the graphic I've linked to.