2012: One of the 10 Warmest Years on Record
Posted on 19 August 2013 by John Hartz
This article is a reprint of a news release posted by the U.S. National Oceanic and Atmospheric Administration (NOAA) on Aug 6, 2013.
The end of weak La Niña, unprecedented Arctic warmth influenced 2012 climate conditions

Worldwide, 2012 was among the 10 warmest years on record according to the 2012 State of the Climate report released online today by the American Meteorological Society (AMS). The peer-reviewed report, with scientists fromNOAA’s National Climatic Data Center in Asheville, N.C., serving as lead editors, was compiled by 384 scientists from 52 countries (highlights, full report). It provides a detailed update on global climate indicators, notable weather events, and other data collected by environmental monitoring stations and instruments on land, sea, ice, and sky.
“Many of the events that made 2012 such an interesting year are part of the long-term trends we see in a changing and varying climate — carbon levels are climbing, sea levels are rising, Arctic sea ice is melting, and our planet as a whole is becoming a warmer place," said Acting NOAA Administrator Kathryn D. Sullivan, Ph.D. “This annual report is well-researched, well-respected, and well-used; it is a superb example of the timely, actionable climate information that people need from NOAA to help prepare for extremes in our ever-changing environment."
Conditions in the Arctic were a major story of 2012, with the region experiencing unprecedented change and breaking several records. Sea ice shrank to its smallest “summer minimum” extent since satellite records began 34 years ago. In addition, more than 97 percent of the Greenland ice sheet showed some form of melt during the summer, four times greater than the 1981–2010 average melt extent.
The report used dozens of climate indicators to track and identify changes and overall trends to the global climate system. These indicators include greenhouse gas concentrations, temperature of the lower and upper atmosphere, cloud cover, sea surface temperature, sea-level rise, ocean salinity, sea ice extent and snow cover. Each indicator includes thousands of measurements from multiple independent datasets.

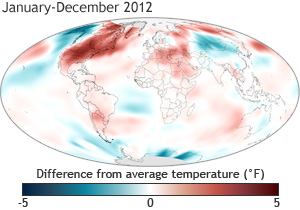
Temperature in 2012 compared to the 1981-2010 average based on NCDC data. See more. Credit: NOAA Climate.gov,
Highlights:
- Warm temperature trends continue near Earth’s surface: Four major independent datasets show 2012 was among the 10 warmest years on record, ranking either 8th or 9th, depending upon the dataset used. The United States and Argentina had their warmest year on record.
- La Niña dissipates into neutral conditions: A weak La Niña dissipated during spring 2012 and, for the first time in several years, neither El Niño nor La Niña, which can dominate regional weather and climate conditions around the globe, prevailed for the majority of the year.
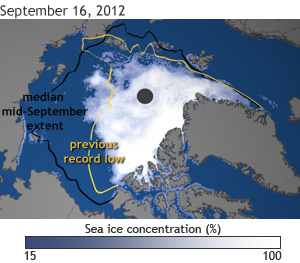
- The Arctic continues to warm; sea ice extent reaches record low: The Arctic continued to warm at about twice the rate compared with lower latitudes. Minimum Arctic sea ice extent in September and Northern Hemisphere snow cover extent in June each reached new record lows. Arctic sea ice minimum extent (1.32 million square miles, September 16) was the lowest of the satellite era. This is 18 percent lower than the previous record low extent of 1.61 million square miles that occurred in 2007 and 54 percent lower than the record high minimum ice extent of 2.90 million square miles that occurred in 1980. The temperature of permafrost, or permanently frozen land, reached record-high values in northernmost Alaska. A new melt extent record occurred July 11–12 on the Greenland ice sheet when 97 percent of the ice sheet showed some form of melt, four times greater than the average melt this time of year.

Sea ice concentration reached a new record low in mid-Sept 2012 based on NSIDC data. See more. Credit: NOAA Climate.gov
- Antarctica sea ice extent reaches record high: The Antarctic maximum sea ice extent reached a record high of 7.51 million square miles on September 26. This is 0.5 percent higher than the previous record high extent of 7.47 million square miles that occurred in 2006 and seven percent higher than the record low maximum sea ice extent of 6.96 million square miles that occurred in 1986.
- Sea surface temperatures increase: Four independent datasets indicate that the globally averaged sea surface temperature for 2012 was among the 11 warmest on record. After a 30-year period from 1970 to 1999 of rising global sea surface temperatures, the period 2000–2012 exhibited little trend. Part of this difference is linked to the prevalence of La Niña-like conditions during the 21st century, which typically lead to lower global sea surface temperatures.
- Ocean heat content remains near record levels: Heat content in the upper 2,300 feet, or a little less than one-half mile, of the ocean remained near record high levels in 2012. Overall increases from 2011 to 2012 occurred between depths of 2,300 to 6,600 feet and even in the deep ocean.
- Sea level reaches record high: Following sharp decreases in global sea level in the first half of 2011 that were linked to the effects of La Niña, sea levels rebounded to reach record highs in 2012. Globally, sea level has been increasing at an average rate of 3.2 ± 0.4 mm per year over the past two decades.
- Ocean salinity trends continue:Continuing a trend that began in 2004, oceans were saltier than average in areas of high evaporation, including the central tropical North Pacific, and fresher than average in areas of high precipitation, including the north central Indian Ocean, suggesting that precipitation is increasing in already rainy areas and evaporation is intensifying in drier locations.
- Tropical cyclones near average: Global tropical cyclone activity during 2012 was near average, with a total of 84 storms, compared with the 1981–2010 average of 89. Similar to 2010 and 2011, the North Atlantic was the only hurricane basin that experienced above-normal activity.
- Greenhouse gases climb: Major greenhouse gas concentrations, including carbon dioxide, methane, and nitrous oxide, continued to rise during 2012. Following a slight decline in manmade emissions associated with the global economic downturn, global CO2emissions from fossil fuel combustion and cement production reached a record high in 2011 of 9.5 ± 0.5 petagrams (1,000,000,000,000,000 grams) of carbon , and a new record of 9.7 ± 0.5 petagrams of carbon is estimated for 2012. Atmospheric CO2 concentrations increased by 2.1 ppm in 2012, reaching a global average of 392.6 ppm for the year. In spring 2012, for the first time, the atmospheric CO2concentration exceeded 400 ppm at several Arctic observational sites.
- Cool temperature trends continue in Earth’s lower stratosphere: The average lower stratospheric temperature, about six to ten miles above the Earth’s surface, for 2012 was record to near-record cold, depending on the dataset. Increasing greenhouse gases and decline of stratospheric ozone tend to cool the stratosphere while warming the planet near-surface layers.
The 2012 State of the Climate report is peer-reviewed and published annually as a special supplement to the Bulletin of the American Meteorological Society. This year marks the 23rd edition of the report, which is part of the suite of climate services NOAA provides to government, the business sector, academia, and the public to support informed decision-making. The full report can be viewed online.


 Arguments


"...ranking either 8th or 9th, depending upon the dataset used..."
Not true. As I pointed out on an earlier story, in the NCDC dataset 2012 is actually #10 and here are the numbers to prove it:
These numbers come from
The rank for 2012 in the RSS TLT dataset is 11th. No current dataset for atmospheric temperature shows 2012 to be 8th so the range is 9th to 11th. The NOAA is victim of the incessant corrections to these datasets I guess.
@Klapper
I presume the Global SAT anomaly in in oC. do you know the error on these figures? Is it truely 0.001 degree or less?
@Klapper: You seem to be jumping to conclusions.
The article says "Four major independent datasets show 2012 was among the 10 warmest years on record, ranking either 8th or 9th, depending upon the dataset used."
Presumably you just picked a different one than the four they did. It seems you should be quibbling with the issue of which data set is better, rather than inccorectly declaring "not true" based on a data set of your chosing.
@Klapper: Sorry - I just returned and saw your last paragraph! It will be interesting if anyone can cite the datasets used.
@StBarnabas #2:
I doubt any of the datasets are accurate to .001C degrees but if you want to rank them that's the number of significant digits required. Are you suggesting that NOAA only ranked by 2 significant digits and then awarded any ties with 2012 to 2012?
@ianw01 #4:
I checked the latest versions of all the datasets, July 2013, using HadCRUT4 SAT, GISS SAT, NCDC SAT, RSS TLT and UAH TLT to make my assertions. As I see it none of these datasets are truly independent, the TLT ones being less so. Maybe the NOAA comment meant land temperature only, which would include Berkeley. However if so their comment is misleading.
Klapper @6.
It might have been a wiser move to check the source document rather than faff about on your own. On the PDF's page 28 it says:-
And Table 2.1 gives Land, Ocean & Land/Ocean thus:-
The fact that every year in the new century was hotter than every year except 1998 says that warming has not stopped as deniers claim.
The discussion of whether 2012 is the 8th, 9th 10th or 11th warmest annual global average surface temperature is intellectually engaging (and a bit of a waste of the engaged intellect), but a more significant point is that the warm years since 1998 have all occured without a transient bump comparable to the one that 1998 recieved from the signifcant El Nino that occured. As mentioned, 2012 was warmer because a weak La Nina ended.
How much warmer the globe has become compared to 1998 can only really be commented on after an El Nino influence on the global average surface temperatures similar to the 1997-1998 El Nino occurs, and other transient or cyclical influences on the "annual average" are considered.
The difference in global average between the 1982-83 El Nino event and the 1997-98 event may give an indication of how much warmer than 1998 the yet to come next major El Nino year will be.
The rolling average of 30 years still climbs with every new month of temperature data.