


 Arguments


2013 was the second-hottest year on record without an El Niño
Posted on 6 February 2014 by dana1981
According to the global surface temperate data set compiled by Kevin Cowtan & Robert Way, which achieves the best coverage of the rapidly-warming Arctic by filling in data gaps between temperature stations using a statistical method called kriging, 2013 was the 5th-hottest year on record (since 1850). The top three hottest years (2010, 2005, and 2007) were influenced by El Niño events, which cause short-term warming of the Earth's atmosphere.
Over the past decade, we've seen less warming at the surface and more warming in the oceans. This has been in large part due to a change in Pacific Ocean cycles. We're currently in a cycle that tends to produce more La Niña than El Niño events, which has resulted in the oceans accumulating more heat, leaving less energy than normal to warm the atmosphere. This in turn has led to the widespread myth that the slowed rate of increase of global surface temperatures means we no longer have to worry about global warming, or that its consequences won't be as bad as expected.
The fundamental flaw in this argument is that it neglects a key fact: cycles are cyclical. In the '80s and '90s when the Pacific Ocean was in the previous phase of this cycle, we saw more El Niño events and more warming of global surface temperatures than the average of climate models projected. However, we can separate out the short-term El Niño and La Niña influences from the human-caused global warming component in the simple manner first suggested by Texas state climatologist John Nielsen-Gammon, shown in this animated graphic:
Global surface temperature data from Cowtan & Way, separated into El Niño (red), La Niña (blue), and Neutral (black) years for 1966–2013, with linear trends plotted for each category.
The El Niño/Neutral/La Niña years here are categorized using a slightly modified approach from the one described in this post last year. In essence, a year with a significant (magnitude larger than 0.3 of the average of the 3 ENSO indices described in that post) surface cooling influence from a La Niña event is put in the La Niña category, ditto for El Niño, and a year with no significant influence is put in the Neutral category. The graphed data begin in 1966 to avoid the effects of the 1963 Mount Agung volcanic eruption.
For each of these three categories, the linear global surface warming trend for 1966–2013 is 0.16°C per decade. That is our long-term underlying global surface warming trend, caused almost entirely by human influences. Note that the colored data points tend to fall close to each of their respective trend lines. This tells us that, for example, an El Niño year today is about 0.6–0.7°C hotter than an El Niño year in the 1970s, and the same is true of Neutral and La Niña years.
What's also interesting is that despite being a Neutral year, 2013 was hotter than 1998, which saw one of the strongest El Niño events on record. This tells us that humans have caused as much global warming over the past 15 years as a powerful El Niño event. The difference is that an El Niño is a temporary event, while human-caused global warming is permanent, unless we can quickly pull a lot of carbon dioxide out of the atmosphere.
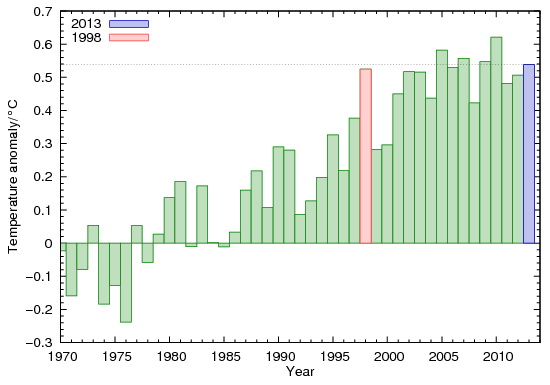
Cowtan & Way global surface temperature data, with the powerful El Niño year of 1998 in red and the Neutral year of 2013 in blue.
Due to the current phase of the Pacific Ocean cycles, of the past six years, four have been cooled by La Niñas. Seven of the past 15 years have seen La Niñas, compared to just four El Niños. Conversely, in the previous Pacific Ocean phase, the 1990s saw seven El Niño years to just two La Niñas. Thus natural ocean cycles amplified human-caused global warming at the Earth's surface in the 1990s, but have dampened it since 1999.
It's really interesting to compare the reactions to these two cycles. Today, climate contrarians are arguing that the slowed rise in surface temperatures means global warming is nothing to worry about – they're confusing short-term cycles with something meaningful in the long-term. Just a few years ago, mainstream climate scientists looked at the accelerated rise in global surface temperatures. Rahmstorf et al. (2007) concluded,
"The global mean surface temperature increase ... is 0.33°C for the 16 years since 1990, which is in the upper part of the range projected by the IPCC. Given the relatively short 16-year time period considered, it will be difficult to establish the reasons for this relatively rapid warming, although there are only a few likely possibilities. The first candidate reason is intrinsic variability within the climate system."
Climate scientists didn't panic and decide the short-term acceleration in rising surface temperatures meant that climate models were underestimating global warming, or that it would be worse than expected. They correctly suggested that it was probably just due to short-term noise from natural cycles. On the other hand, climate contrarians have overreacted to and misinterpreted the current short-term noise, incorrectly declaring that it means climate models are overestimating global warming and we have nothing to worry about.
What this really means is that climate models may underestimate the internal variability of the climate system due to these types of ocean cycles, but they still get the long-term global warming trend right.
2013 also saw an incredible amount of heat accumulate in the oceans – 2.5 x 10²² Joules, which is equivalent to 390 million Hiroshima atomic bomb detonations, or over 12 atomic bomb detonations per second. 2013 tied 2006 as the year with the most energy accumulating in the oceans since the Argo buoy network began producing much-improved estimates of ocean temperatures to depths of about 2,000 meters. This is significantly higher than the average of about 4 atomic bomb detonations per second over the past decade, and also much higher than 2009. This helps explain why 2009 had higher surface temperatures than 2013 – less heat went into the oceans and more into the atmosphere that year.
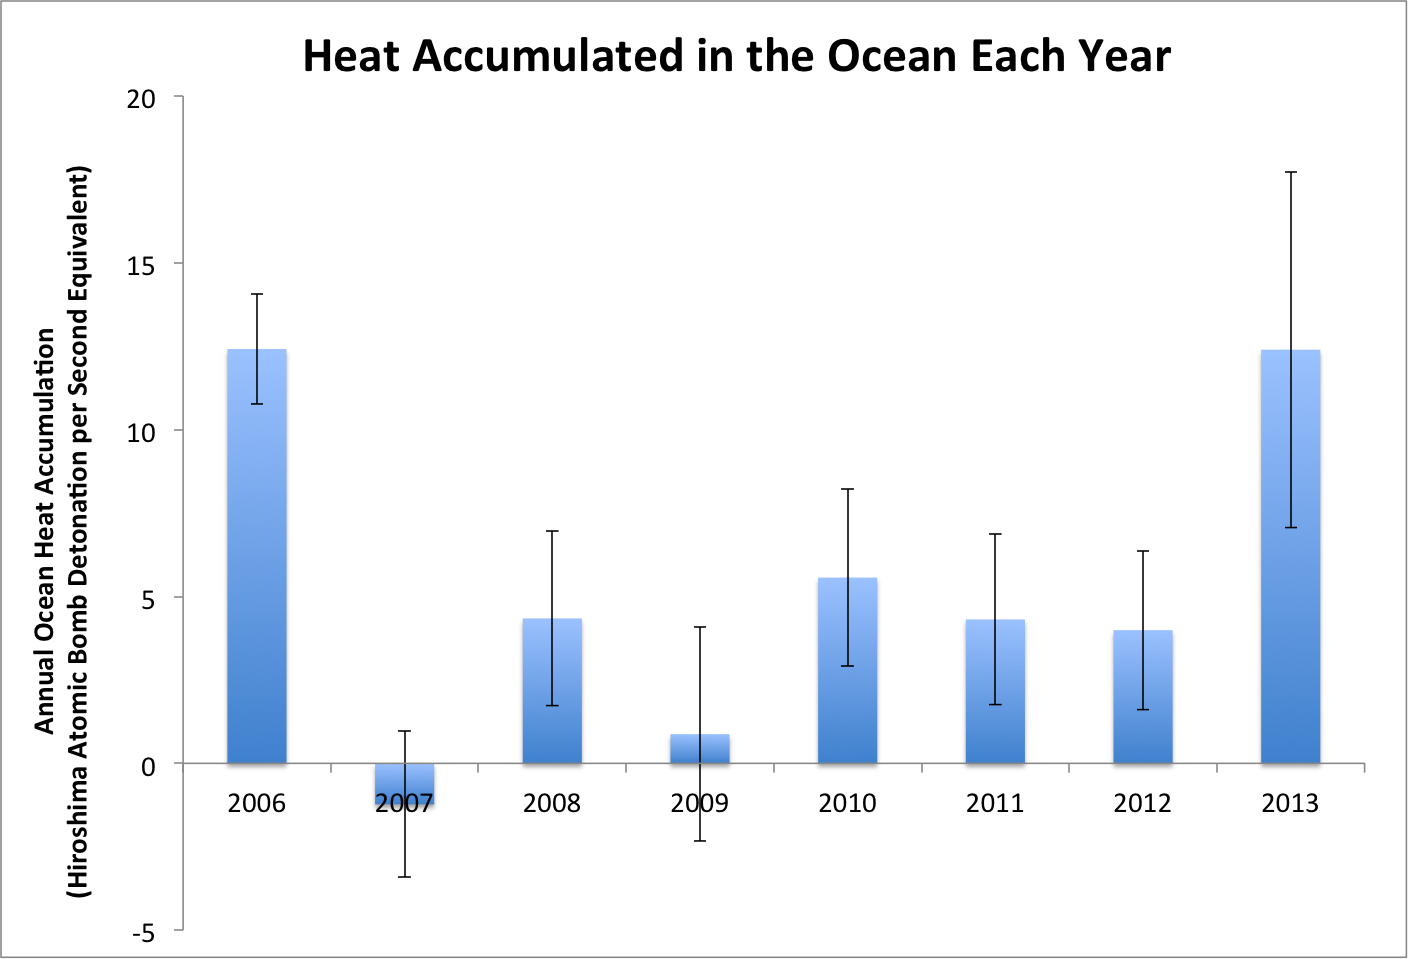
Annual ocean heat content accumulation to 2,000 meters in units of atomic bomb detonations per second, with standard error shown. Data from NODC.


Excellent post. Thanks again to Kevin and Robert for their work. Tamino has a post on this as well.
Things are looking good for a late 2014 El Nino, and about time that is.
This means that 2015 could very likely set a new record in at least some of the datasets. UAH placed 2013 in 4th place, so I've got a feeling that unless there are adjustments done (often happens in record warm years for some reason) we will see a record in the UAH data for this coming year I can't even imagine the amount of backpeddlin' and spinning among the ''skeptics'' if UAH sets the record as the only dataset, as I have a hunch that GISS, etc won't beat the record until 2015. Interesting times ahead.
"The winter months of December 2013 and January 2014 averaged over the contiguous 48 United States were the 3rd coldest Dec/Jan in the last 30 years."
http://www.drroyspencer.com/2014/02/u-s-decjan-temperatures-3rd-coldest-in-30-years/
Two points:
It's called the Pacific Decadal Oscillation for a reason. To refer to it as a cycle is to call it something it Isn't. I've seen deniers criticized on this very point; we shouldn't be doing it either.
I can't help thinking that it would be useful to empasize the pattern we see in the temperature curve that deniers keep pointing at as indicating a cessation of warming--there was a big jump in temperatue associated with the 1998 El Nino (the strongest on record) and since then temperatures HAVEN'T GONE BACK DOWN. Shift the discussion away from Is there a heating trend or not; the record is too short to spot a trend anyway. Emphasize that temperatures have stayed up there.
The question is: where does this excess heat in the ocean come from and how does it get in there? Does CO2 heat the oceans? If yes, how come not all of the oceans are getting warmer; is the influence of CO2 regional rather than global?
topal @3... Yes, the lower 48 states (less that 3% of the Earth's surface) was the third coldest 3 month period, while Alaska and northern Canada were breaking all kinds of record warm temps.
Surely you can see this as the rather ridiculous cherry pick that it is.
topal - as to cold winter in USA, note USA is 4% surface of earth. Picking on specific area is cherry-picking. As to why there are cold winters lately, perhaps start here.
Ocean heating (and global energy imbalance) is due to an enhanced greenhouse effect but the detail is complicated. A look at NOAA data for all basins would show all of them heating although you expect a very uneven distribution of temperature since there is very significant horizontal and vertical movements of water. (Look up thermohaline circulation). Which basin do you believe is not getting warmer?
topal @5... The answer is, CO2 does not heat the oceans. Radiative processes heat the ocean. Incoming short wave radiation penetrates into the upper layers of the ocean and produces heating. The ocean is also heated through conduction and back radiation.
http://eesc.columbia.edu/courses/ees/climate/lectures/o_atm.html
Heat moves in and out of the oceans at different rates at different places. Oceans are moving bodies of water where the thermohaline circulation is actively transporting heat from the tropics to the poles.
The long and short is, it's a dynamic system. Thus, it's not going to warm evenly.
Seeing there is apparent disagreement, I ran the figures and the CONtiguous United States (CONUS) is just 1.6% of the Earth's surface.
Thanks, Tom!
okay, 5% of the total land area.
Topal @ 5,
Learning is all about becoming more fully informed. I hope you continue to strive to learn by following and asking questions on a 'helpful site' like this one.
The main point made by the article was that even without the significant temporary bump of global average temperatures that occur due to a strong El Nino is acting, 2013 was a very warm year compared to others. It was as warm as 1998 when one of the strongest El Nino events occurred.
topal @3 reports Spencer's claim, but not its context. First, Spencer is not reporting official USHCN figures, but his own figures which use a larger Urban Heat Island (UHI) adjustment than do the official figures. Second, he is only reporting on two winter months. Indivicual months are always more variable than annual figures, which have some of the variations cancelled out be averaging. Consequently it is not surprising that a two month period should be unusually cold, even with the background of a warming trend. It makes such comparisons mere curiosities, having no bearing on the long term change in temperatures.
Spencer shows a graph of his adjusted ISH figures compared to the official USHCN figures:
It can be seen clearly that Spencer's adjustment significantly cools later years relative to earlier years. Indeed, by 2013, it cools it by 0.35 C. As it turns out, that does not make a large difference in the ranking of 2013, which is the 13th coldest of 41 years in his adjusted figures, wheras it is tied for 15th and 16th coldest in the official USHCN data over that 41 years. Of course, the USHCN has many more years on record than just 41, and most of them much colder. Further, the early years of the 41 Spencer shows are obviously colder than the later years. Indeed, 8 of the first 15 years shown are colder than 2013. That brings to mind a recent comic by xkcd:
Which brings us to the December/January figures ;)
In those figures, Spencer shows that Dec/Jan of 2013/2014 have indeed been cold relative to the last 41 years, being the 6th coldest out of 41 years data. And it was indeed cold, at a chilly -0.55 C average for the CONUS. Of course, relatively warm relative to the -2.1 C in 78/79. And the years before that were colder still. What was commonplace has simply become note-wothy. XKCD has it right.
FYI, I have expanded my on my comment @13 on my blog, including additional information and sources, for anybody who wants more data.
I'm well aware that the USA surface is only a small part of the total surface, but it shows that a significant part of the world population is exposed to cold conditions despite global warming. On a considerably larger scale, there has not been a substantial increase in the subsurface temperatures of the Pacific Ocean and the North Atlantic to depths of 2000 meters over the past decade. Why is the warming of the global oceans (0-2000 meters) limited to the Indian and South Atlantic Oceans, when carbon dioxide is said to be a well-mixed greenhouse gas, meaning all ocean basins should be warming? The obvious answer is that a regionally limited force must be responsible for acting on the heat content. Let's try ENSO.
(Rob P) All ocean basins are undergoing long-term warming - see the attached image from Balmaseda (2013) below. That there is an exchange of water masses between ocean basins, and large short-term variation in ocean circulation, may come as a surprise to you, but it shouldn't.
We will have a lot more on ocean warming and the basics of the wind-driven ocean circulation in the coming months - it's a key component in understanding why so much heat has been going into the ocean of late. There is also a great post by Dana Nuccitelli coming out in a couple of days on the latest research into to this recent unprecedented ocean warming.
Topal,
Your claim that it was cold in the USA the last two months is simply false. According to the NOAA record table here, since January 1 there have been 121 monthly hot records set and 71 monthly cold records set. The monthly records are more extreme records than the daily records so they reflect more extreme records (there are more dailly cold records). This data set does not show 2 month data, but December was not as cold as January. How could there have been more record hot temperatures set if it was cold?
The yearly data show 258 all time hot records set and only 39 all time cold records. Obviously all time hot records cannot be set in the winter so we have to use the yearly data. There is no comparison between the recent mildly cold weather and the scorching hot summers we have suffered through recently. If we looked at the all time record hot 2012 data there were many more hot records.
What you really mean is: while the West Coast and Alaska suffered historic record high temperatures, the Midwest and East coasts had a winter that was typical fifty years ago. Since AGW made it so hot for the past 30 years, people who refuse to read the historic records think it is cold.
It was only cold in 1/2 of the CONUS. You have to discard the Alaska data and half the CONUS to claim it was cold. That reduces the affected area of the globe to about 0.8% of the globe that had a typical winter for 50 years ago.
@One Planet ...
"The main point made by the article was that even without the significant temporary bump of global average temperatures that occur due to a strong El Nino is acting, 2013 was a very warm year compared to others"
So we can conclude that an El Nino increases the temperature. But El Nino just displaces energy that was accumulated in the ocean, it doesn't generate any warming, so the energy added to the energy budget of the globe must come from another source. What is it?
You seem to assume that after an El Nino the global temperature returns to the precedent level before another El Nino occurs. This is not the case, since there is no opposite forcing that can remove energy from the globe, other than by natural processes, independant of ENSO. Hence energy can accumulate and higher temperature can persist when the next El Nino hits.
Topal,
Obviously the energy that is added comes from AGW. Before AGW, the energy would be radiated into space. The argument that El Nino creates enough energy to heat the globe does not stand up to any examination because there is no energy source available except AGW.
topal @18
You are making a really elementary mistake.
The MST (mean surface temp) is computed from all the different areas of the planet. So, ENSO causes the temp to rise or fall in one part of the planet, and that is reflected in the value of MST.
What you have to do is stop using the ambiguous verb "warm" and replace it with the correct language specific to the context:
Greenhouse gases "increase the energy" of the entire system.
ENSO "increases or decreases the temperature" measured as MST.
Hope that helps.
Esop, you must be the only person that I have heard of that is hoping and wanting a bad El Niño In 2015. You sure?
"Climate scientists didn't panic and decide the short-term acceleration in rising surface temperatures (didn't mean)? that climate models were underestimating global warming"
Markoh, I personally think that El Nino's are natural and knowing they will happen soon and help the public see that the Earth is getting warmer is a good thing. Like what was stated before, we can feel fine about them because they don't last very long, unlike man made CO2.
My comment at 22 is wrong Dana is spot on as usual. :)
Topal,
You are not alone in struggling to better understand this issue. Many people continue to make many similar claims. Other posts have tried to help you better understand this issue. I offer the following.
The graph showing the global average temperatures not only shows the bumped values during El Nino and the reduced values during La Ninas. It shows how much variation can occur just because of the condition of the ENSO at any given time. But the important point is that the global average is what needs to be tracked. The surface of the Pacific varies by far more than 10ths of a degree.
A rather basic measure of the Pacific Surface temperature variations can be seen at the following site. Note that this is not a full evaluation of the ENSO and its ability to influence the global average (that which involves the timing and strength and patterns of trade wind circulations and other considerations).
http://www.cpc.ncep.noaa.gov/products/analysis_monitoring/ensostuff/ensoyears.shtml
As can be seen the '3 month averages' of the overall zone being measured fluctuate by many degrees C. Regions within the zone being averaged have even higher variations. That regional short-term fluctuation can also be seen to not be 'truly cyclical in timing or strength'.
However, as the graph in this article clearly shows, the average trend line of the widely fluctuating global surface average annual surface temperature is what really needs to be noted.
So, to better understand what changes are occurring, it is important to also follow the global average temperature values. And it is important to review a long time series of data since there are many random significant factors creating fluctuations of even the global average values.
Another way of looking at the changes over time is to compare every new year's global average temperature to the value 20 or 30 years prior. In the graph it is clear that every new year has been significantly warmer than those 'previous years'.
A final point has to be the amount of global average temperature 'warming'. As can clearly be seen the warming is less than 1 degrees C. With the global average warming being so small (yet very significant even though ‘it is small’), and the many reports of how the warming of the Arctic and the Antarctic has been more than other regions of the planet, it should be clearer why it can still get cold in the US 'in spite of the warming'. A concern should be the increasing frequency of freezing temperatures reaching down to places like Florida due to the 'predicted weakening of the jet stream' which allows Arctic air masses to be pushed further south more frequently.
I hope that helps.
Topal@3
What part of the term "Global Warming" do you not understand. It means the warming of the entire planet, averaged out as a whole. So why then do you think a single colder than normal winter in 2% of the globe falisfies it?
Australia last year had the warmest Day ever recorded, the warmest month, and the warmest year ever recorded since accurate record keeping began (150 years). That in itself does not prove Global Warming. Individual records do not prove anything, it is the overall trend, averaged out over many years that is important.
So comments like:
"The winter months of December 2013 and January 2014 averaged over the contiguous 48 United States were the 3rd coldest Dec/Jan in the last 30 years."
Are entirely meaningless in this context.
#21 (Markoh):
An El Nino will likely bring a new record and that means that the denier claims of ''no warming since...'' will have much less impact among at least moderately educated folks.
Ie. for those of us who wish to see meaningful action done to reduce the likelihood of a completely messed up climate in the future, having the public see and feel what is going on now is a lot better than having a monster Nino wreak havoc closer to 2020. The deniers are having massive success with help from the MSM, lying to a largely completely clueless public about AGW since they are helped by repeated La Ninas that mask the surface warming.
However, for those who for various reasons do not want to cut emissions, I guess they keep their fingers crossed for another La Nina and further masking of the warming signal, so they can continue lying to the public and still have a chance of being listened to.
Same goes for Arctic sea ice. We know from basic physics and the long term trend that it is doomed, so pretending to be happy for another year of ''recovery'' is like pretending to be happy that the canary in the coalmine appears fine while miners are dropping dead around it.
"Australia last year had the warmest Day ever recorded, the warmest month, and the warmest year ever recorded since accurate record keeping began (150 years)."
And CONUS is only about 5% larger than Australia. So the fact that half of CONUS has had a cold winter (by recent definitions of "cold") apparently, disproves global warming despite a big chunk of CONUS having unusually warm and dry weather (worst drought known in CA, severe drought in OR and WA) and Australia's warmest year on record.
That's interesting logic ...
And while parts of the US are chilly due to the displaced Arctic air, what about the Arctic, where that air was supposed to be?
Well, for example at Longyearbyen, Spitsbergen, the average for the last 30 days is a silly 23.5F (13.1C) above normal:
http://www.yr.no/place/Norway/Svalbard/Longyearbyen/statistics.html
Not just the last 30 days, look at the curve for the past year.
The deniers should not be too happy, though, since a much, much warmer than normal Arctic will mean less Arctic sea ice, and we all know that the ''skeptics'' themselves into a corner about that last fall by claiming that the bottom had been reached and it was all recovery from 2013 and on.
The tragic thing is that they can to a despicable degree spout BS like that and still not being held to task by the very MSM (that they lied to in 2013), when the record very likely gets beaten sometime before the end of 2016.
[PW] In order to facilitate better communication, I'd strongly suggest ceasing using the term 'deniers;" it's as disrespectful as when dismissives--the more widely-acceptable term for those who reject all the standing scince that supports the AGW theory, according to Yale research--use the term 'alarmists.'
ESOP. So you would wish for a big El Niño knowing that it would mean drought, death and disease to South Eastern Africa? I couldn't do that. I'm one hoping El Niño stays away.
Markoh, I share ESOP's 'sentiment'. The lack of an ENSO event since 1997-98 as powerful as that one was has fueled far too much 'unacceptable belief' about what is going on.
Some people seek any excuse to 'refuse' to better understand what is going on (I say refuse because they are choosing not to better understand this issue and so many other issues). They correctly sense that they will not be able to enjoy as much benefit if 'popular opinion' fails to support those unsustainable and damaging activities they enjoy benefiting from.
The next strong ENSO will happen regardless of human actions. The severity of it will be significantly due to the lack of reduction of impacts by the 'most fortunate' among our predecessors. Into the future, the increased harm will be due to the deliberate lack of understanding among the current generation and demands that 'their popular interest must be accepted'. They already make absurd claims like "life would be horrible without burning fossil fuels the way they do". If everyone's lifestyle matched the fossil fuel burning habits of the biggest per-capita impacters that lifestyle would be over in a moment, with massive battles among the population fighting to get the most of the last possible benefits.
This is a really serious issue. But it is only regarding one of the many fundamentally unsustainable and damaging activities in the current global economy that not only have no future, they damage the future others will have to try to live in.
The next strong ENSO event will hopefully wake more of the global population out of their greed induced stupor. That awakening is essential for the development of a sustainable better future for all life on this amazing planet.
One Planet. I have a concern for humanity and would never wish bad on the helpless.
@One Planet: "The next strong ENSO will happen regardless of human actions."
Agreed. And it will inevitably warm the planet.
"The severity of it will be significantly due to the lack of reduction of impacts by the 'most fortunate' among our predecessors."
Can you elaborate on that. What exactly will determine its severity; our predessors, your ancestors? How severe will it be?
I'm still looking for the anthropogenic footprint in the natural process called ENSO.
Markoh,
I am definitely striving to help the least fortunate, by hoping that many among the more fortunate who are currently callously creating the greater harm for those less fortunate, get 'awakened from their greedy stupor'.
The reality of the result of their callous behaviour is clear to me. It unfortunately needs to be 'clear to them'.
The tragedy resulting from the next strong ENSO needs to be squarely and clearly 'blamed on all those who have chosen not to accept the climate science and the resulting need to stop trying to benefit from burning fossil fuels'. The only acceptable benefit from that unsustainable and damaging activity would be exclusive short term benefits for the less developed least fortunate to help the poorest of the poor develop through to a way of living that is sustainable and not damaging (what the most fortunate should have already been doing for 20 years).
I consider the very informed and intelligent people who have been carefully but deliberately trying to keep public opinion from growing 'against allowing continuation of benefiting from the burning of fossil fuels by any people except temporary development benefit for the very least fortunate' to be the most despicable. I consider their deliberate actions trying to promote unsustainable and damaging attitudes and activities to prolong the benefits obtained by the callous greedy are almost 'criminal'. Burning fossil fuels for benefit is not 'too essential to curtail'. Sure, there are many people who believe they are wealthy. But is that believed wealth is from burning fossil fuels it is make-believe wealth that needs to be wiped from the global socio-economic system. Anyone still gambling on benefiting that way has had 20 years of warning. It is time for those undeserving callous greedy people to lose the full value of their unsustainable and damaging gambles.
Topal,
The ENSO strength of consequences will be greater due to the warmer global system it is occurring in.
Human activity does not 'create ENSO'. Human acivity has led to the capture of more solar energy which is increasing the energy of the climate system (warming of the surface being one clear measure of that added energy in the system, but warming of the deeper oceans also being due to that human impact).
One item to note about the NOAA OSI in the link in my first comment is they have 'updated the baseline temperature value for idenifying an El Nino'. This is because the long term average of the surface of the Pacific has been warming. So the circulation conditions creating an El Nino now produce an even warmer average surface in the Pacific.
It is all adding up because of human impacts.
topal@32
You appear to be ignoring my comment @19, so I refer you to it again.
When you say "Agreed. And it [El Nino] will inevitably warm the planet.", you are incorrect.
ENSO will not "warm the planet". El Nino will cause the MST to be higher, because it will increase SST (sea surface temp) where it occurs, and that will be part of the computation of average temperature for the entire surface of the planet.
However, El Nino doesn't add any energy to the climate system as a whole ('the planet').
If you are serious about learning how this works, you have to distinguish between:
1) An increase in *one* temperature measurement
and
2) An increase in the total energy of the system.
Why don't you try asking your questions without that ambiguous use of the term "warm"; it will make things clearer.
mgardner @35, ENSO warms (or cools with La Ninas) the planet more than would be expected just by adding the warming or cooling of the tropical Pacific to the global average. Further, the maximum warming (or cooling) of the planet from ENSO is experienced approximately 6 months after the maximum warming (or cooling) of the tropical Pacific associated with ENSO fluctuations.
In a way that is unsurprising. Temperature feedbacks are feedbacks on changes in surface temperatures. Therefore any widespread net change in surface temperatures would be expected to result in further changes in the same direction globally as a result of feedbacks. If that were not the case, climate sensitivity would be very low. As it happens, it is not low, and the ENSO effect on global temperatures is one of the pieces of evidence that that is the case. However, for ENSO to work as a ratchet that elevates tempertures in the long term (rather than simply results in oscillations around the mean), the feedback response to temperature would need to be greater than 1, and would need to be higher for rises in temperature than for falls in temperature. Both are known not to be the case from past climates.
Esop #2, 26, 28
I agree completely!
If the surface temperature trend between 1975 and 2000 had continued for the last 14 years we might have seen at least some action in stead of just talk, talk and more talk from the politicians. It’s bad enough that we now have a climate denier party in the Norwegian government, but the effort from the last government led by the Labour party wasn’t particularly impressive either.
BTW, the average temperature in Longyearbyen, Svalbard, for the last 30 days is now 13.6oC above normal, though the forecast predicts somewhat colder weather towards the end of next week. In fact, February will very likely become the 39th consecutive month that is warmer than normal in Longyearbyen!
Topal,
As others have pointed out an ENSO or El Nino event does not 'add energy to the global system'. It only ceates a short term global average surface temperature that is higher than the 'norm' (the norm being the average trend line of global average surface temperature - or the line created by a long average of temperatures like 20 or 30 year averages which can be created for each new month of new data).
So the period since the extremely strong ENSO event of 1997/98 has 'appeared to indicate a slower rate of warming in the global average surface temperarure record. There have been El Nino events since 1997/98 but they have not produced the magnitude of bump of global average that the 1997/98 event produced.
If you are wondering about recent reports that 'strong El Ninos are expected to be more frequent', that would be the expectation of a more energetic global climate system and the pattern of global warming that is occurring (more polar warming). The strong El Nino events in the NOAA ONI history (linked to in my earlier post), occurred in 1972/73, 1982/83, 1997/98. These stronger events would be expected to occur more frequently in a warmed planet (our planet with more energy in the surface climate system).
However, it is not just the strength of the ONI (or El Nino), that matters. The Southern Oscillation occurring with the El NIno (the ENSO), and the relative timing and magnitudes of the combined conditions will affect the magnitude of the temporary bump of global average surface temperature warming.
The main point remains. Human activity is leading to more energy in the global climate system. This can be seen in many things like the global average surface warming to rebalance the rate of its energy emissions with the higher captured/trapped incoming energy (the higher capture being due to increased greenhouse gases in the atmosphere which are mainly due to human activity and additive feedback responses to that human activity - such as less surface ice reflecting incoming solar radiation). The continued increase of global average surface temperature since the very significant ENSO event of 1997/98 (combined with very little volcanic dimming in the same time period), will clearly become more difficult to claim isn't occurring when the next significant ENSO event occurs. The current ENSO conditions are on the La Nina side of neutral (the cooling from the norm side) and yet the global average for 2013 nearly matches the significantly ENSO bumped 1998.
@ #35 mgardner:
@ #38 One Planet:
"...However, El Nino doesn't add any energy to the climate system as a whole ('the planet')...."
"...As others have pointed out an ENSO or El Nino event does not 'add energy to the global system'...."
ENSO can change global heat content. Read Loeb et al 2012. Net global TOA radiative imbalance on a monthly basis can spike +/- 2Wm2 based on the state of ENSO, and can average +/- 0.5 W/m2 over the period of a year. However the imbalance is the opposite of what you might think. The planet is losing heat during an El Nino and gaining it during a La Nina (which I'm sure shows in in the ocean).
Since the posters here like the metric "Hiroshimas per second", I'll convert the La Nina between the start of 2008 and early 2009 from Loeb Figure 2, which shows a global TOA measured energy imbalance of about 0.4W/m2 (heat gain). Convert global to ocean and you have a heat gain of about 3 hiroshimas per second thanks to La Nina over the 1 and 1/2 year period or so.
"...What's also interesting is that despite being a Neutral year, 2013 was hotter than 1998.."
Only in the Cowtan and Way dataset. This is not true in any of the other atmospheric datasets. It is definitely not true in the datasets with the best spatial coverage, RSS and UAH TLT. The satellite data shows 2013 is 2/10's off of 1998 in the UAH TLT dataset and 3/10's lower in the RSS dataset.
This is significant in that Cowtan and Way use the relationship between surface air temperature and the lower troposphere to help fill the big spatial holes in the instrument network, especially in the Arctic. However, while the adjusted version of HadCRUT4 shows 2013 to be warmer than 1998, UAH, the source of the adjustments clearly does not.
I dont think you are understanding how C&W use UAH. What is obvious when you overlay the surface temperature record with the satellite lower troposphere, is that UAH has much stronger response to ENSO that than any surface record. Therefore you do not expect neutral 2013 to top an extemely strong El Nino in 1998 in UAH. However C&W do not use UAH measurement to replace missing data, but instead use the relationship between UAH and surface records to infill the surface record.
@#41 scanddenp:
I know how C&W use the UAH dataset. Re-read the 1st sentence in the 2nd paragraph of my post.
Over the long term the C&W dataset produces a warmer trend than either the source or target datasets it creates it's adjustment from. From 1979, the beginning of the satellite record, the C&W-adjusted HadCRUT4 is .17C/decade vs. .15C/decade for unadjusted HadCRUT4 and 0.14C/decade for UAH TLT (global trends).
A little analysis shows where the magic of C&W comes from. In the early half of the satellite record (1979 to 1996, C&W mimics the trend of HadCRUT4 while UAH lags (.11 C&W vs. .11 HadCRUT4 vs. .03C/decade UAH). Then in the last half of the satellite record period, 1997 to 2013 it follows UAH which in this period is warming faster than HadCRUT4 (C&W = .11C/decade vs .05 HadCRUT4 vs .09 UAH).
The C&W algorithm creates an opportunistic result. That doesn't mean it's wrong. However, we should investigate further why there is some kind of mode change 1/2 way through the record with the adjustment.
klapper@39
I'm not convinced that your conclusion from Loeb is probative or even correct, but for the purpose here it isn't really relevant. My interest is in educating people who are getting the basic physics wrong, whether due to their own misconception or the efforts of denialists.
Clearly, topal is far from the point of being able to formulate simple questions properly, so a debate at the margins of significance is hardly useful pedagogy, don't you think?
Just a question regarding ocean warning. I read that due to the warning affect of extra greenhouse gases, the oceans don't release as much heat because of the thin water layer on the surface of the ocean. Does this mean that greenhouse gases can't warm the earth up very fast because ocean can only rise from short wave radiation? Also with increasing greenhouse gases will this mean that El Nino's will not release as much heat due to it being warmer in the atmosphere then in the ocean?
tom curtis @36,
Sorry, I missed your comment before I replied to klapper. You say:
"However, for ENSO to work as a ratchet that elevates tempertures in the long term (rather than simply results in oscillations around the mean), the feedback response to temperature would need to be greater than 1, and would need to be higher for rises in temperature than for falls in temperature. Both are known not to be the case from past climates."
As I pointed out to klapper, how is this information relevant to my interaction with topal? It seems clear that topal does believe that (it is being claimed that) ENSO somehow increases the long-term energy gain for the entire climate system.
I don't mean to be argumentative or critical-- well, a little critical-- but the obsessive need to avoid correction from one's peers can interfere with providing information that matches the educational level of the person we are trying to educate.
I'm not a specialist in this area, but I am well aware that ENSO has knock-on effects, and, exactly as you explain in what I quoted, that it doesn't matter much at all, in terms of the public debate. I enjoy reading and learning from interchanges by the real experts, but I don't think those are much use to people like topal. Sometimes, less is more.
mgardner @45, in public forums on the internet, you are never just talking to the person you directly address. Rather, you are being read (in a popular and widely accessed blog like SkS) by a large number of other observers. The little detail you left out may well be irrelevant to your discussion with Topal, but as you stated it was inaccurate. Without correction the potential consequence is that a significant number of readers may become misinformed, or confused.
For that reason, while I recognize the need for simplicity in language in communicating the gist of complex ideas, we should err on the side of accuracy rather than simplicity. Also for the same reason, when we encounter an unfortunate turn of phrase or mistatement, we should correct it. I also understand that that can be inconvenient, and even irritating at times. Better that, however, than for a casual reader peaking up a false idea from SkS, only to have it rebutted by a denier, who thereby gains false credence.
@46 Tom Curtis
Tom,
This may be more on topic on one of the strategy/tactics threads, but...
I don't agree that a significant numbers of readers may become misinformed or confused by my leaving out details. I'm trying to demonstrate an approach to teaching-- one which requires that we listen more than we lecture. My 'target audience' is people who do know some of the details but may not be good at communicating basic concepts to those who are less educated. I thought that was a major thrust of the effort at SkS?
Someone like topal may be sincere and willing to learn, or may be ideologically biased and just trolling, I don't know. But you have to engage in an actual dialogue to figure that out, and to figure out where to begin his education if the former. It is almost universally the case that performing a data dump of all you know is not where to begin.
As for 'rebuttal' by deniers, I think their greatest weapon is exploiting the honesty of scientists, by conflating what is well established with the areas under exploration and debate--simply because long explanations appear equivocal even when they are not.
So, with all due respect, I will continue to do my best when I feel I can contribute, and suffer any subsequent academic purity humiliation with good grace.
Klapper,
I am aware that a warmer global surface generally means a higher rate of radiation emissions (but all feedbacks including added capture of energy due to more water vapour need to be considered). That is why the norm of the global average is trending up. It needs to reach a new balance norm with the higher rate of energy capture due to added greenhouse gases and feedback effects resulting from the added CO2 like added water vapour.
As you note, and I am aware, when an El Nino is occurring the bump in the global average can send more heat out than is coming in, but it is only noise in the trend line of global average surface temperature. When the La Nina occurs, more heat energy gets captured into the oceans as the planet stores up more heat energy because the surface is not as warm, not emitting as much.
As for the satellite data values of the troposphere, those are a completely different way of tracking the changes of energy of the planet. The NASA/GISS data set also show 2013 to be 'as warm as 1998'. The satellite values are not 'comparable to the global average surface temperature data set'. They are just another measure of things that is 'trending up' as expected. It is improper to claim that a difference between the satellite and surface data sets proves that one or the other is inaccurate. However, the clear difference of the HadCRUT4 with other surface data sets did ‘beg an explanation’.
Which brings us to C&W. They pointed out the 'siginificant gap' in the method of determining global averages in the HadCRUT4 data (large areas of the planet are not accounted for leading to a presumption that the areas not accounted for are trending just like the areas that are accounted for...which they aren't). Their algorithm filled the gap in a rigorous manner that resulted in 'correcting' the 'global average' in the data set (producing what you refer to as ‘magic’), resulting in trends that were more in line with the other surface data sets. This shows how ‘using HadCRUT4 exclusively as the basis for the IPCC AR5 report statements about warming since the late 1990s' was not necessarily producing an accurate representation of the changes. This is not ‘magic’ it is science.
These are indeed complicated issues to develop a clear understanding of, but it can be harder to develop the understanding if you are tempted to not want to ‘change your mind’ as you strive to better understand things. And on this issue there is a very powerful motivation for many people to ‘not want to change their mind’. Their desire to benefit more in their moment from the unsustainable and damaging burning fossil fuels becomes less acceptable as they better understand this issue.
Klapper:
The fact that the CW datasets (all versions, i.e. UAH, kriging or a new hybrid to be released this week) produce trends which diverge from HadCRUT4 from about 1998 is both expected, and in fact inevitable for any global temperature series. Take a look at this figure from GISS and you will see why:
(Hint: Look at the Arctic and the Antarctic lines, the main regions missing from HadCRUT4.)
You get the same result if you look at GISTEMP, UAH, NCEP/NCAR, ERA-i, or MERRA.
The much more intriguing question is why our trends are higher than GISTEMP. We will be addressing that question in a month or two, and the answers are looking very interesting indeed.
Michael. Not true. For details on this I highly recommend the series at Science of Doom on "Does Back Radiation warm the ocean" and the follow up.