


 Arguments


2015 SkS Weekly Digest #3
Posted on 20 January 2015 by John Hartz
SkS Highlights
Dana's Global warming made 2014 a record hot year – in animated graphics received the highest number of comments of the articles posted on SkS during the past week.
Comments Policy Update
The SkS Comments Policy was amended with the addition of the following sentence.
Moderation complaints are always off topic and will be deleted.
El Niño Watch
There has been a lot of buzz over the last few months of an El Nino taking shape across the globe. These often bring wet conditions to the southern and western U.S. and warmer conditions to the state of Minnesota. But recent observations are showing that our El Nino may not even happen.
There are many different ways to measure if an El Nino is occurring, but the main way is to measure sea surface temperatures in the equatorial Pacific… it's this area that is often most affected by an El Nino event. Well, the latest trends aren't promising…
Our El Nino year may not happen by Cody Matz KMSP (Detroit), Jan 18, 2015
As colder than seasonal temperatures have taken hold across Canada this winter, you may be asking, “Where is El Niño?” The answer is that El Niño conditions are already in place in the Pacific, but not all El Niños are created equal. Analysis of current conditions shows how this year’s unique flavour of El Niño will help keep some parts of Canada warm, while others will remain in the deep freeze.
El Niño update explains impact on Canada in months to come by Michael Carter, The Weather Newtwork, Jan 16, 2015
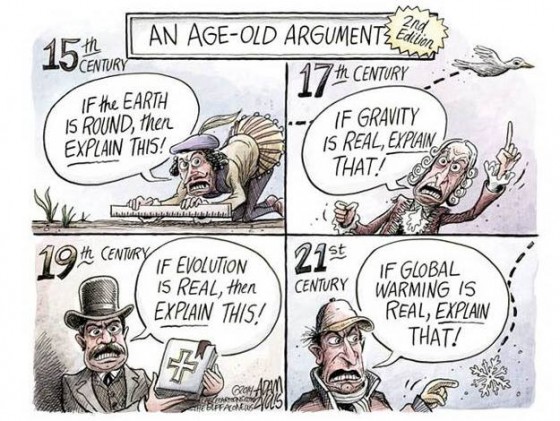
Toon of the Week
Quote of the Week
"Climate change is particularly tricky," said Alexander Aylett, a professor at the National Institute of Scientific Research in Montreal and author of a Massachusetts Institute of Technology report, "Urban Climate Change Governance Survey," that examined to what extent cities around the world are trying to tackle climate change.
"Governments are used to dealing with problems that are somebody else's business," he said. "The people who build your roads don't regulate what happens on top of them or how we build next to them, but climate change is everywhere, all the time, all at once."
U.S. Cities Lag in Race against Rising Seas by Brittany Patterson, ClimateWire/Scientific American, Jan 15, 2015
SkS Spotlights
Coming Soon on SkS
- The Most Trrifying Papers I Read Last Year (climatesight)
- 2015 SkS Weekly News Roundup #4A (John Hartz)
- Extreme oxygen loss in past climate change events could be repeated (Sarah Moffit)
- 2015 Begins With CO2 Above 400 PPM Mark (Andrea Thompson)
- Climate change could impact the poor much more than previously thought (Dana)
- 2015 SkS Weekly News Roundup #4B (John Hartz)
- 2015 SkS Weekly Digest #4 (John Hartz)
Poster of the Week

SkS Week in Review
- Call to climate scientists: submit your quote for 97 Hours of Consensus 2015 by John Cook
- 2015 SkS Weekly News Roundup #3B by John Hartz
- Global warming made 2014 a record hot year – in animated graphics by Dana
- Uncertainty, sensitivity and policy: Kevin Cowtan's AGU presentation by Kevin Cowtan
- The Antarctic ice sheet is a sleeping giant, beginning to stir by John Abraham
- 2015 SkS Weekly News Roundup #3A by John Hartz
- Just when did humans first start affecting the climate? by Howard Lee
- Corrosive Seawater, Not Low pH, Implicated As Cause of Oyster Deaths by Rob Paintingi
- 2015 SkS Weekly Digest #2 by John Hartz
Media Matters Posts about Environment & Science
- George Will Bungles Basic Facts While Cheerleading For Keystone XL by Andrew Seifter, Jan 15, 2015
- Despite Dropping Oil Prices, Media Are Still Dismissing Keystone XL's Climate Impact by Andrew Seifter, Jan 15, 2015


The dip in the Nino 3.4 value over the past month may be connected to the lack of a strong SOI (-8 or lower) over the past month.
The daily SOI values (here) show that since day 358 of 2014 the SOI has been above the -8 value considered a threshhold to help push the Tropical Pacific surface waters into an El Nino conditions. So it is no surprise that the Nino 3.4 average has been declining.
However, since January 16, the SOI daily values show another strong negative surge. Mind you, there was also a strong negative surge of the SOI daily values at the end of December.
Accurately predicting region specific near-term changes is definitely more challenging than understanding the likely long term global changes. That seems to be easily twisted into claims that the understanding of what is going on must be wrong about the future if it can't predict the near-term.
As important as near-term regional predictions are for many things like agriculture planning, emergency planning, and ocean transporation planning it may be prudent to try to avoid discussion of near-term predictions when discussing climate change. Explaining the importance of actual measured occurances like 2014 being the new Hottest Year even though it was not boosted by El Nino is helpful. Speculating too much about 2015 may not be helpful.
Thanks for your continual attention to the on-again-off-again El Nino situation. SOI 30-day average now below -8 so no longer neutral, iirc, but pointing toward El Nino. Daily value about -40.
I have a question if that’s ok. In light of all the resent studies that have found missing heat, has there been a gathering of the data to show how much heat is actually building up on the Earth and how this compares to the expected warming from anthropogenic climate change. Thanks.
wili,
The preliminary SOI values (here) do indeed show that as of January 20 the 30 day average SOI is just at -8. However, the value may only be momentarily that low. The current 30 day averages include a few very low values in late December (that is when a set of 6 days below -8 occurred). The values for these dates and earlier are in the table I linked in my earlier post. As soon as the 30 day average moves past that set of lows (by January 24), the daily SOI values will need to be significantly below -8 to keep the 30 day average below -8.
The very long lull between the end of December set of low SOI values and this very recent set of very low values is probably why the Nina 3.4 has noticeably dropped even though the 30 day SOI averages have remained negative (the lowest 30 day value being about -5.3 even though most of the daily values were much higher).
As always the near term is more 'wait and see' than 'sure to be'.
Thanks for that broader perspective, OPOF.
Here are 'Lord M Vader's' views, from Arcti Sea Ice blog:
Michael Whittemore @3... Hm. I'd be more inclined to say that there are a number of studies that have proposed solutions to Trenberth's questions about "missing heat." But I'm not sure I'd say that it's been found, per se.
The amount of heat being trapped by the atmosphere is a function of both models and measurements of outgoing radiation. The "missing heat" is more of an accounting question of exactly where the heat is moving around within the climate system.
Nothing (to my knowledge) has changed relative to expectations of warming trends, since those calculations are just a function of the physics involved.
As the Talking Heads said, it's...
The toon is a repeat from 5 Oct 2014 and rightly so, because it's a very good one, as testified buy comments therein.
wili,
As a further clarification, I was a little sloppy when I referred to significant negative SOI values as 'low'.
The SOI is the pressure diffence between Darwin and Tahiti. So a significant negative value is a 'large pressure difference' between the locations.
The categories of SOI are presented here and are more correctly:
Thanks for the reference indicating that a TS as the reason for the current SOI value. It is possble that a storm system could create temporary SOI values that only apper as if they would support El Nino. A steadier set of negative daily values resulting in a 30 day average SOI of -10 is probably more supportive of El Nino than short spurts of very significant negative values with long periods between them that produce a 30 day average of -10.